Team of NOAA oceanographers zooms in on Atlantic Ocean

A team of oceanographers at NCEI created a finer-resolution map of ocean data as a test case to study the world ocean. Using two primary ocean resources stewarded by NCEI—the World Ocean Database (WOD) and the World Ocean Atlas (WOA)—the approach took a closer look at seawater temperature and salinity reflecting the ocean circulation patterns and air–sea interactions.
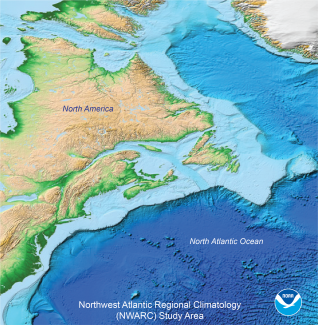
The study, published in the January 2019 issue of the Journal of Geophysical Research: Oceans, could help uncover many details of long‐term ocean climate variability with much higher than previously achievable spatial resolution. The work used comprehensive information of the Northwest Atlantic (NWA)—one of the most climatically important and data-rich regions of the world ocean.
Developing a New Ocean Climatology
Many ocean parameters, such as temperature, salinity, oxygen, and nutrients are collected by a number of international organizations for monitoring and studying the ocean’s condition and change. The collected observations are used to create monthly, seasonal, and annual values of those parameters employing the objective analysis of historical oceanographic data.
Researchers map ocean data at specified depths and resolutions on a regular grid with the grid horizontal dimensions in latitude and longitude measured in degrees (°). For example, one degree of latitude or longitude is about 60 nautical miles, approximately 69 statute miles. The ocean data within grid cells, averaged over decades or longer, are called “ocean climatologies.” Essentially, ocean climatologies describe the average long-term state of the ocean.
In the NWA region, characterized by perhaps the highest density of data coverage in the world, the research team created a new temperature and salinity climatology, a subset of the WOA. The team wanted a testing field for inquiry into ocean climate change on a decadal time span. This new NWA regional climatology (NWARC) included WOD data from nearly six decades, beginning in 1955. The large volume of temperature and salinity data available from long-term observations in the region allowed a much higher resolution than attainable in most other regions of the world ocean. This higher spatial resolution helped to assess ocean climate decadal-scale variability with unprecedented magnification.
A 1° x 1° grid (about 60 square nautical miles) was a standard resolution of ocean climatologies for many years and has been only recently replaced by a higher resolution grid of 1/4° x 1/4° (about 15 square nautical miles). In the NWARC case, the NCEI Regional Climatology team drilled down further, to the resolution of 1/10° x 1/10° (about 6 square nautical miles), to examine the temperature and salinity structure that reflected energetic mid-sized ocean currents.
Results of the NWARC Study
One of the primary goals of the research based on NWARC was to find out if the cumulative effects of the ocean currents—eddies, meanders, filaments, and rings—would become evident in high‐resolution mapping over periods of a decade or longer. The authors successfully proved that this is a case for the NWARC.
“The high‐resolution versions of the NWARC, on 1/4° and 1/10° grids, provide a more precise depiction of the ocean climate state and its variability with details not attainable in coarser‐resolution analyses,” the authors stated.
In the Northwest Atlantic, the authors diagnosed a very localized multidecadal subsurface heat gains southeast of the Gulf Stream. The finer grid showed details that the coarser mapping could not reveal in principle. Similar to how a magnifying glass can allow the viewing of details in a specimen that are undetectable by the human eye, the finer details of the ocean structure and change emerged from zooming into the ocean data.
Besides providing an indispensable tool for ocean research, ocean mapping contributes to the study of Earth’s climate. Within the Earth’s climate system, the ocean absorbs heat at a greater capacity than the atmosphere or land. Thus, better and more detailed knowledge of ocean thermal variability facilitates more precise charting of ocean heat content and contributes to gaining a clearer picture of climate shifts over several decades.


