
Warm temperatures are a hallmark of July in the United States

In honor of Independence Day, we take a look at the country’s historical July climate conditions and Climate Normals for several patriotic-named U.S. locations.
July U.S. Climate Conditions
Heat is the key characteristic of America’s July climate. And, in many parts of the country, it’s accompanied by sticky humidity, afternoon thunderstorms, and possibly severe weather. It marks the second month of the North Atlantic hurricane season, and it’s typically the fourth most active month for tornadoes.
Temperatures
Climatologically speaking, July is the hottest month of the year for the contiguous United States with an average temperature of 73.6°F. The average daytime high temperature is nearly 87°F, while the average nighttime low is around 60°F.
The hottest July—and subsequently the hottest month—on record for the contiguous U.S. occurred in 1936 during the Dust Bowl. The July 1936 average temperature was 76.8°F, 3.2°F above the twentieth-century average.

The hottest monthly average temperature for any state in our country's 128-year record occurred in 2011. The Oklahoma July 2011 average temperature was 89.2°F, 7.5°F above average. But, overall, Texas is typically the warmest state in July with an average temperature of 82.3°F.

The coldest July on record for the contiguous U.S. occurred in 1915 with a temperature of 71.0°F, 2.6°F below average. Washington state is typically the coolest state in the Lower 48 in July with an average temperature of 64.1°F. The coldest state in the last 127 years during July was Idaho in 1993 with a 56.2°F average value. Six states across the Northwest had their coldest July during 1993.
The July temperature for the contiguous United States has warmed at an average rate of 1.2°F per century since 1895. Since 1950, the rate of change is double that at 2.4°F per century.
Precipitation
Climatologically, July is the third-wettest month of the year for the contiguous United States with an average of 2.78 inches of precipitation. Both 1950 and 1958 tied for the wettest July on record with a nationally averaged precipitation total of 3.86 inches, 1.08 inches above average. The contiguous United States saw its driest July in 1930 with an average of just 1.79 inches of precipitation, 0.99 inch below average.

Tropical Systems
July is the second month of the North Atlantic hurricane season. On average, July typically sees one tropical storm every year, a hurricane once every other year, and a major hurricane about once a decade. The years 2005 and 2020 tied for the most tropical storms forming in July with five named storms each. In a three-way tie for the most hurricanes during July are 1916, 1966, and 2005, which each saw three. And, 1916 and 2005 tied for the most major hurricanes during the month with two each.

Hurricane Emily on July 19, 2005, in the morning, as captured by GOES-12 band 1. Courtesy of NOAA Satellites.
Hurricane Emily in 2005 is the only North Atlantic hurricane to ever have reached Category 5 strength in July. Other, less severe, tropical systems have caused tremendous damage and loss of life during July, including:
- Tropical Storm Alberto in 1994, which caused $1.9 billion in damages and killed 32 people when it dumped torrential rains across parts of Georgia, Alabama, and the Florida Panhandle
- Hurricane Dennis in 2005, which caused $3.6 billion in damages and took 15 lives when it made landfall in the western Florida Panhandle as a Category 3
- Hurricane Dolly in 2008, which caused $1.6 billion in damages and claimed the lives of three people when it made landfall in southern Texas as a Category 2
- Hurricane Hanna in 2020, which caused over $1.2 billion in damages and was directly responsible for the deaths of at least four people due to storm surge flooding
Tornadoes
On average, the contiguous United States experiences 134 tornadoes during July with the activity focused in the Northern and Central Plains and Midwest. The most active July occurred in 1993, when the country had 242 confirmed tornado reports. The least active July occurred in both 1950 and 1951 when 23 tornadoes were reported.

Throughout the years, several significant tornado outbreaks have occurred during the month of July, including:
- In the Northeast in 1989 where an F-4 devastated towns in Connecticut
- In the Upper Midwest in 1996 where an F-5 touched down in Wisconsin
Since 1980, 14 severe weather outbreaks have each caused more than $1 billion in damages during July.
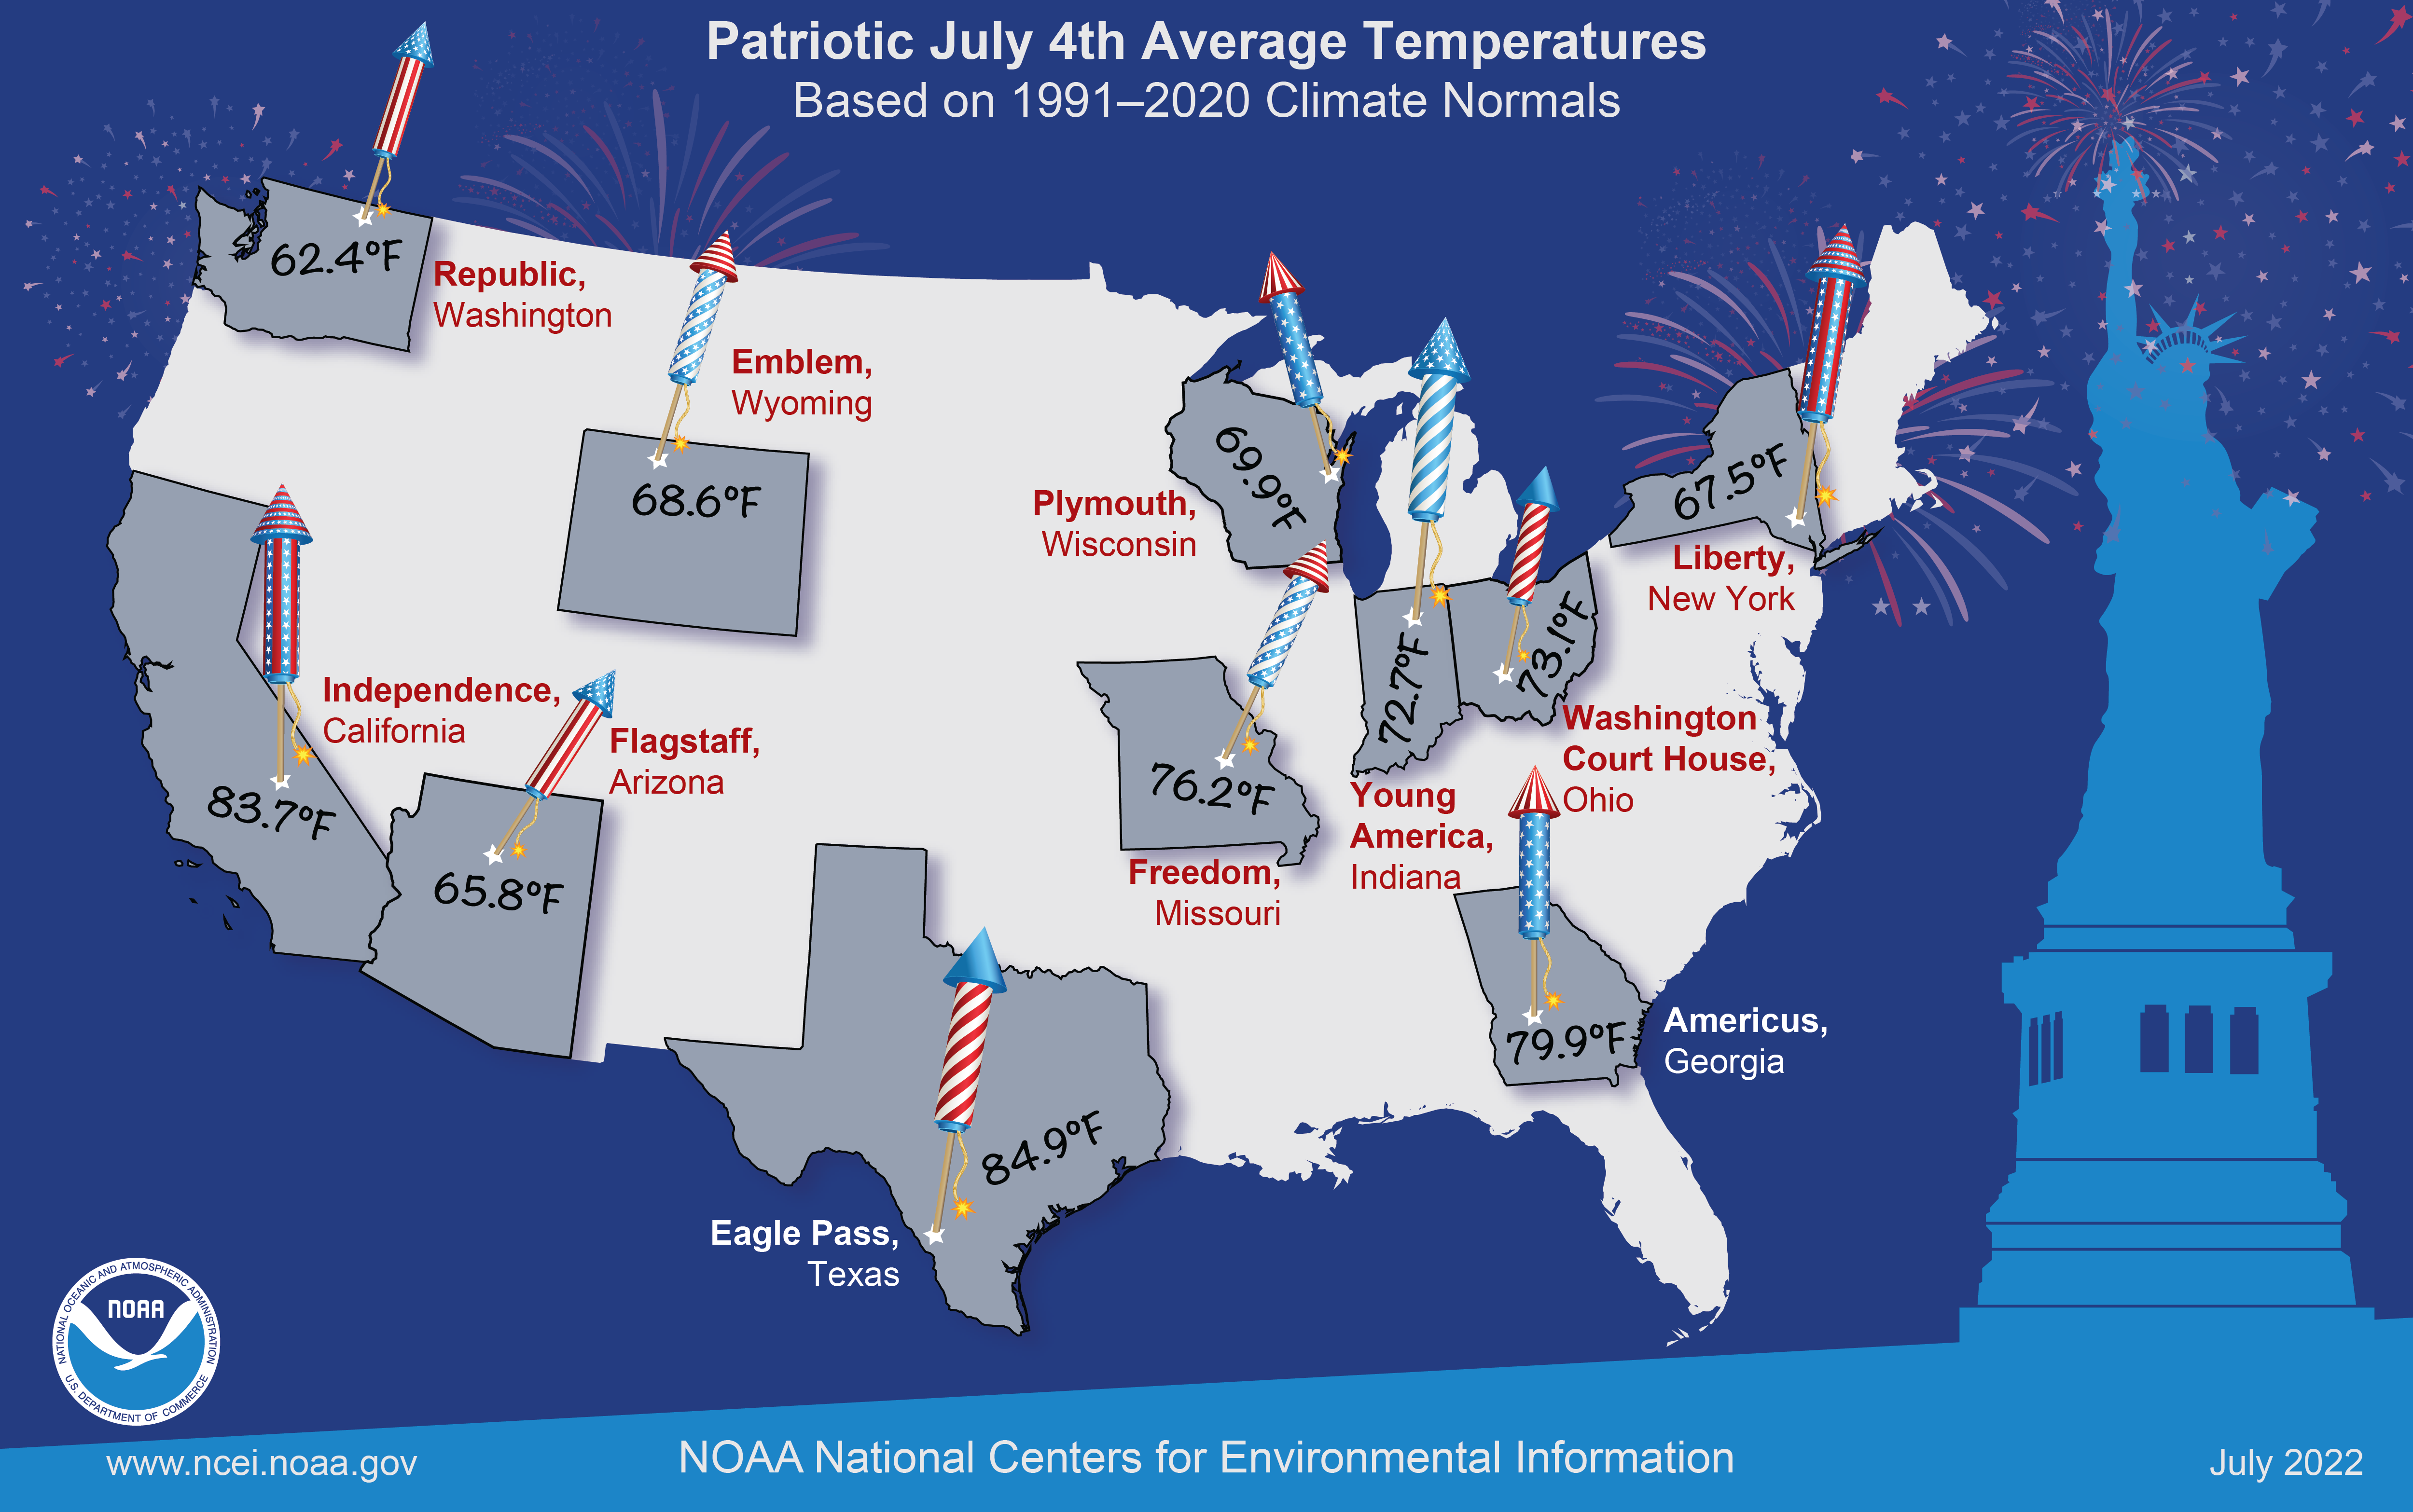
July 4th Climate Normals for Patriotic-named U.S. Locations
In such a geographically and climatologically diverse country, average conditions vary from place to place across the United States.

From the balmy warmth of Independence, California, to chilly Republic, Washington, the table below shows the normal minimum, maximum, and average temperatures on July 4th for 11 locations with patriotic names, according to our daily 1991–2020 Climate Normals data. New Climate Normals were released in May 2021.

While our Climate Normals provide average temperatures throughout the United States, the actual conditions this Independence Day may vary widely based on weather and climate patterns. For prediction of your actual local daily temperature, check out your local forecast on Weather.gov.


