
Fifth-warmest September on record; 18 disasters this year exceeded $1 billion in damages

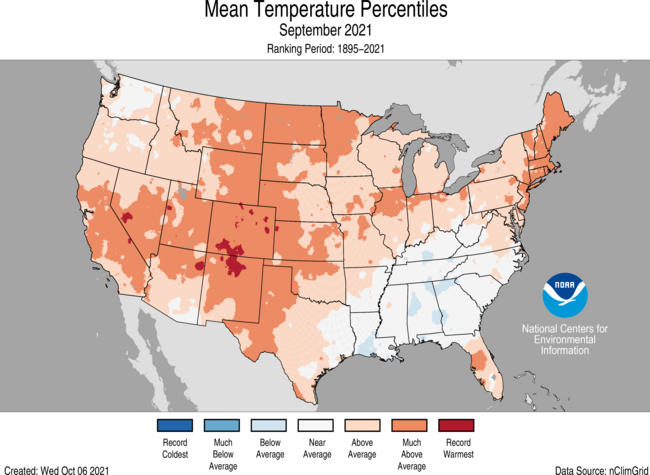
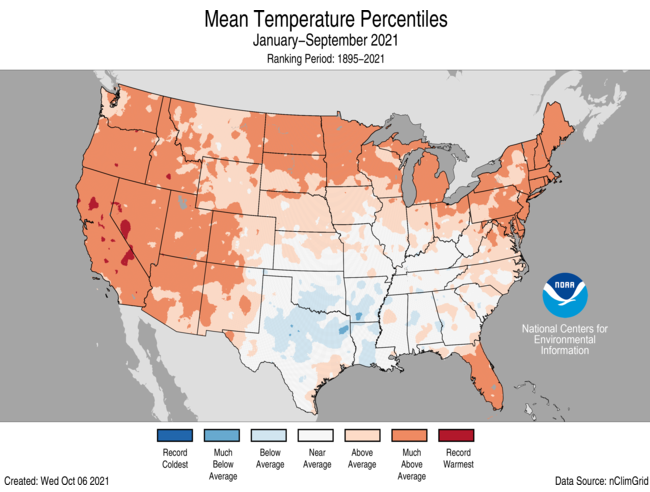
For September, the average contiguous U.S. temperature was 67.8°F, 3.0°F above the 20th-century average, the fifth-warmest September in the 127-year period of record. For the year-to-date, the contiguous U.S. temperature was 57.0°F, 1.9°F above the 20th-century average, ranking 10th warmest in the January-September record.
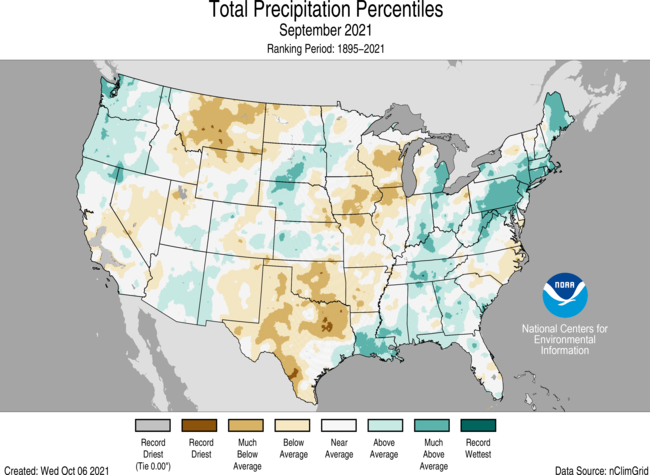
The September precipitation total for the contiguous U.S. was 2.33 inches, 0.16 inch below average, ranking in the middle one-third of the 127-year period of record. For the year-to-date, the national precipitation total was 23.58 inches, 0.38 inch above average, ranking in the middle one-third of the January-September record.
NCEI updated the 2021 billion-dollar weather and climate disaster dataset to include 10 additional events — five severe storm events, four tropical cyclone events and one wildfire event. This brings the year-to-date total to 18 weather and climate disaster events with losses exceeding $1 billion each across the U.S. and is four events shy of the 2020 record for the most disasters on record in a calendar year.

This monthly summary from NOAA National Centers for Environmental Information is part of the suite of climate services NOAA provides to government, business, academia, and the public to support informed decision-making.
September
Temperature

- September temperatures were above average from the West Coast to the Great Lakes and into New England. Colorado and Rhode Island ranked third warmest on record for the month while five additional states across the West and Northeast ranked in the top five for September. Temperatures were near average across parts of the Northwest, Gulf Coast and Southeast.
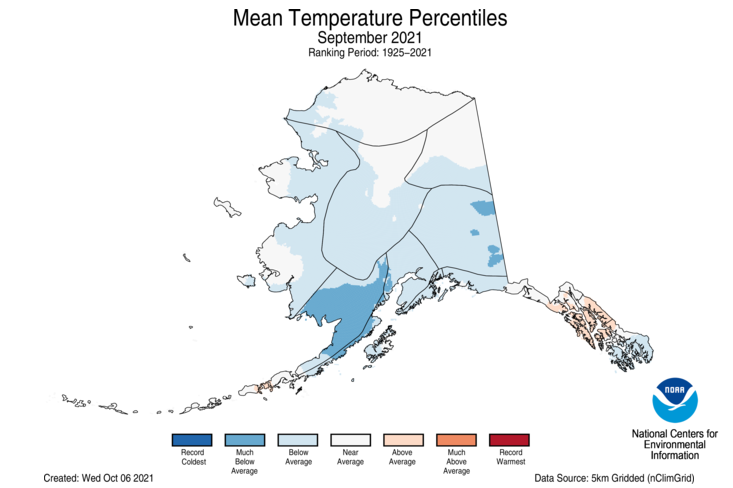
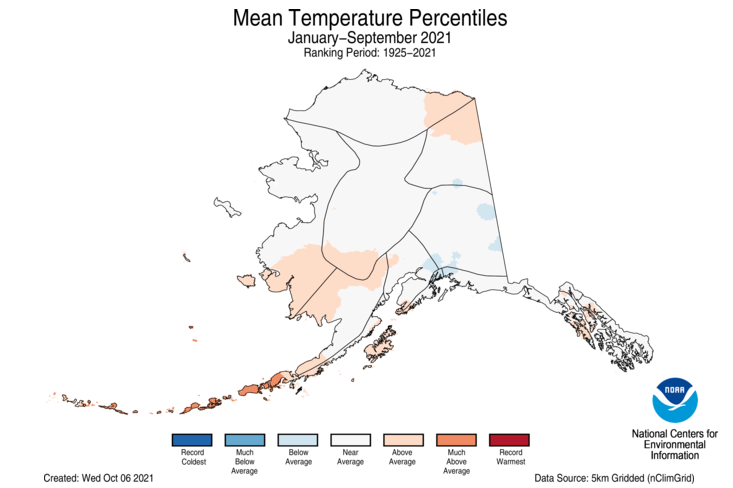
- Alaska had a statewide average temperature of 39.3°F, 1.3°F below the long-term average and ranking in the coolest one-third of the 97-year record. Temperatures were below average across much of the state with near-average temperatures dominating the North Slope and portions of the northern interior regions. Temperatures were above average across the Central Panhandle.

Precipitation

- Precipitation was above average across portions of the Northwest, Southwest, northern and central Plains and from the central Gulf Coast to New England. A series of atmospheric river events during the second half of September contributed to the above-average precipitation received across the Northwest. Resulting primarily from precipitation received as a result of the remnants of Hurricane Ida, Pennsylvania had its seventh-wettest September while Massachusetts ranked eighth wettest. Precipitation was below average across much of the northern Rockies, Deep South and Midwest. Oklahoma had its ninth-driest September on record.
- Alaska’s average of 4.36 inches of precipitation in September was 0.21 inch below average and ranked in the middle one-third of the 97-year record. Precipitation was above average across the North Slope and the South Panhandle regions and below average from Bristol Bay to the Northeast Gulf region.
- According to the September 28 U.S. Drought Monitor report, approximately 47.8 percent of the contiguous U.S. was in drought, up about 1 percent from the end of August. Drought conditions expanded or intensified across portions of the Midwest and central Plains and rapidly developed across the southern Plains during the second half of September. Drought severity and/or coverage lessened across parts of the West, northern Plains and New England.

Extremes
- The western U.S. continues to battle an active fire season in 2021.
- By the end of September, almost six million acres were consumed across the U.S. This is approximately 500,000 acres less than the year-to-date 10-year (2011-2020) average.
- The KNP Complex wildfires erupted in Sequoia and Kings Canyon National Parks in California during September, threatening some of the oldest and largest sequoia trees in the world.
- On September 21, the Wildfire Preparedness Level was reduced to PL4, indicating that officials expected fire activity and demand on resources to continue declining as the wildfire season begins to wane. By September 28, officials further reduced the Preparedness Level to PL3.
- The Atlantic Basin hurricane season continued to be active with 20 named storms identified during the first nine months of 2021. In September alone, nine new named storms formed — Larry, Mindy, Nicholas, Odette, Peter, Rose, Sam, Teresa and Victor.
- Remnants of Hurricane Ida combined with a frontal system and brought unprecedented rainfall to parts of the Northeast on September 1. Flash Flood Emergencies were declared for the first time on record across parts of New Jersey and New York. Flash flooding, strong tornadoes and many fatalities resulted.
- Tropical Storm Mindy made landfall on St. Vincent Island, Florida, on September 8 and quickly moved across Georgia and into the Atlantic Ocean causing minimal damage.
- Hurricane Nicholas made landfall near Sargent Beach, Texas, on September 14 and drifted slowly toward Louisiana over the next several days, bringing flooding rainfall to parts of the Gulf Coast already saturated from Hurricane Ida.
Year-to-date (January-September)
Temperature

- Year-to-date temperatures were above average across the West, the northern and central Plains, Great Lakes, Northeast, Mid-Atlantic and portions of the Southeast. Maine had its second-warmest January-September on record while California ranked third warmest. Temperatures were below average across parts of the Deep South.
- Year-to-date temperatures averaged across Alaska were near normal. Above-average temperatures observed across the southwestern and northeastern portions of the state, while most of Alaska had near-average temperatures over the first nine months of 2021.

Precipitation

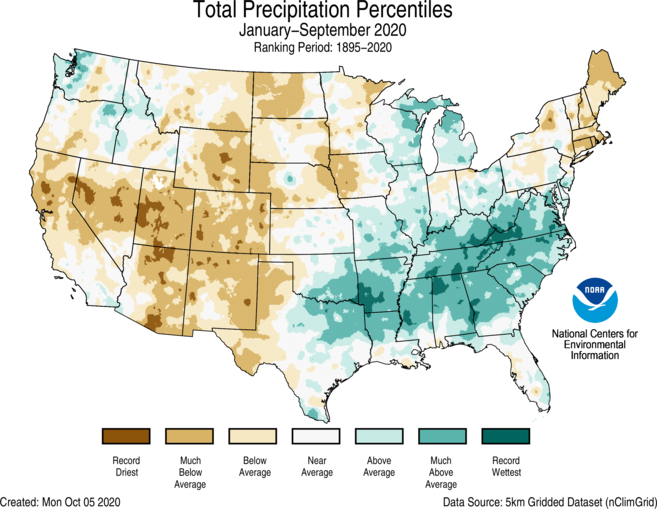
- January-September precipitation was above average across portions of the Southwest and from the Gulf Coast to the Ohio Valley and into the Northeast. Mississippi had its third-wettest year-to-date period while Louisiana ranked fourth wettest on record. Precipitation was below average from the West Coast to the northern Plains. Montana had its third-driest year-to-date on record, while North Dakota was fifth driest.
- For Alaska as a whole, January-September precipitation was above average. Precipitation was average to below average from the Aleutians to the Northeast Gulf and above average across much of the remaining portions of the state.

Billion-dollar Weather and Climate Disasters
- Through the end of September, 18 weather and climate disaster events have been identified with losses exceeding $1 billion each across the U.S. during 2021. These events include one drought/heat wave event, two flooding events, nine severe storm events, four tropical cyclone events, one wildfire event and one winter storm/cold wave event. This is four events shy of the 2020 annual record of 22 events.
- The U.S. disaster costs for the first nine months of 2021 are $104.8 billion, already surpassing the disaster costs for all of 2020 ($100.2 billion, inflation-adjusted).
- Through September, disasters in 2021 have also caused more than twice the number of fatalities than from all the events that occurred in 2020.
- Hurricane Ida is the most costly disaster to-date in 2021 — exceeding $60 billion — and will be ranked among the top-five most costly hurricanes on record (since 1980) for the U.S. Ida’s total cost will likely increase further, which will be reflected in our end-of-year report.
- Since records began in 1980, the U.S. has sustained 308 separate weather and climate disasters where overall damages/costs reached or exceeded $1 billion (based on the CPI adjustment to 2021) per event. The total cost of these 308 events exceeds $2.085 trillion. Disaster costs over the last five years (2017-2021) will exceed a record $700 billion, reflecting the increased exposure and vulnerability of the U.S. to extreme weather and climate events.
See all September U.S. temperature and precipitation maps.