Global Highlights:
- Based on preliminary data, the globally-averaged combined land and sea surface temperature was the eighth warmest on record for May, the seventh warmest for boreal spring (March-May), and the January-May year-to-date period ranked twelfth warmest.
- March-May 2008 temperatures were above average in Europe, Asia, Mexico, the southwestern and south-central contiguous U.S., southern and western Australia, northwestern Africa, and parts of Alaska and eastern Brazil. Cooler-than-average conditions occurred across eastern Australia and most of the northern half of the continental U.S.
- Precipitation during March-May 2008 was above average across Philippines, parts of Europe, Asia, and South America, and most of the eastern half of the contiguous U.S. Drier-than-average conditions were observed in the Hawaiian Islands, southeastern China, southern Africa, the northwestern and parts of the southern continental U.S., most of Australia, and parts of Paraguay and Argentina.
- Weakening La Niña conditions were present across the equatorial Pacific Ocean during May.
Contents of this Section:
The data presented in this report are preliminary. Ranks and anomalies may change as more complete data are received and processed. The most current data may be accessed via the Global Surface Temperature Anomalies page.
Introduction
Temperature anomalies for March-May 2008 and May 2008 are shown on the dot maps below. The dot maps, below left, provide a spatial representation of anomalies calculated from the Global Historical Climatology Network (GHCN) data set of land surface stations using a 1961-1990 base period. The dot maps, below right, are a product of a merged land surface and sea surface temperature anomaly analysis developed by Smith and Reynolds (2005). Temperature anomalies with respect to the 1961-1990 mean for land and ocean are analyzed separately and then merged to form the global analysis. Additional information on this product is available.
Anomalously warm temperatures covered much of the global land throughout the first five months of the year. January-May 2008 had cooler-than-average temperatures across eastern Australia and parts of the north-central and western contiguous U.S. The year-to-date map of temperature anomalies shows the presence of warmer-than-average temperatures across Mexico, Europe, Asia, central and western Australia, the northeastern and southern continental U.S., and most of Africa, Alaska, Brazil, and southern Chile and Argentina. The sea surface temperatures (SSTs) were warmer than average across the Atlantic, western North Pacific, and most of the Indian oceans. Cooler-than-average SSTs were present across the equatorial Pacific Ocean and along the western coast of North America and most of the southern oceans.
During the boreal spring, temperatures were above average in Europe, Asia, Mexico, the southwestern and south-central contiguous U.S., southern and western Australia, northwestern Africa, and parts of Alaska and eastern Brazil. Cooler-than-average conditions occurred across eastern Australia and most of the northern half of the continental U.S. As shown in the maps below, temperatures across Europe and most of Asia were 1-5°C (2-9°F) above the 1961-1990 mean. The warm conditions that engulfed Eurasia during the spring were associated with the lowest recorded snow cover extent for Eurasia and the third least snow cover extent on record for the Northern Hemisphere.
During May, above-average temperatures were observed across Alaska, Mexico, British Isles, central Europe, northwestern and southern Africa, the northwestern and south-central contiguous U.S., northern Canada, and most of Asia. Meanwhile, cooler-than-average conditions were present across Finland, Thailand, the northeastern and north-central continental U.S., and parts of Argentina, western Russia, the eastern half of Mongolia, and northern and northeastern Australia.
May SSTs were warmer than average in the Atlantic and parts of the South Indian and northwestern Pacific oceans. Cooler-than-average conditions were present in parts of the southern oceans, the central equatorial Pacific, and parts of the northeastern Pacific oceans. SSTs warmed across the Niño 3.4 and Niño 4 regions during May, but the anomalies remained below average. Please see the latest ENSO discussion for additional information.

The mean position of the upper-level ridges of high pressure and troughs of low pressure (depicted by positive and negative 500-millibar height anomalies on the March-May 2008 map and the May map) are generally reflected by areas of positive and negative temperature anomalies at the surface, respectively. For other Global products see the Climate Monitoring Global Products page.
Images of sea surface temperature conditions are available for all weeks during 2008 at the weekly SST page.
Temperature Rankings and Graphics
Current Month / Seasonal / Year-to-date
Effective with the February 2006 report, NCDC transitioned from the use of the Operational Global Surface Temperature Index (Quayle et al. 1999) to the blended land and ocean dataset developed by Smith and Reynolds (2005). The differences between the two methods are discussed in Smith et al. (2005).
The combined global land and ocean surface temperature was the eighth warmest on record in May and the seventh warmest on record for boreal spring (March-May). Spring 2008 global land temperatures tied with 2000 as the third warmest spring since records began in 1880. Meanwhile, the Northern Hemisphere combined land and ocean, as well as land only, had their third warmest spring on record.
| May | Anomaly | Rank | Warmest (or Next Warmest) Year on Record |
|---|---|---|---|
GlobalLandOcean Land and Ocean |
+0.70°C (+1.26°F) +0.36°C (+0.65°F) +0.45°C (+0.81°F) |
7th warmest 10th warmest 8th warmest |
2007 (+0.96°C/1.73°F) 1998 (+0.54°C/0.97°F) 1998 (+0.62°C/1.12°F) |
Northern HemisphereLandOcean Land and Ocean |
+0.79°C (+1.42°F) +0.38°C (+0.68°F) +0.53°C (+0.95°F) |
8th warmest 8th warmest 8th warmest |
2007 (+1.20°C/2.16°F) 2005 (+0.60°C/1.08°F) 2005 (+0.74°C/1.33°F) |
Southern HemisphereLandOcean Land and Ocean |
+0.41°C (+0.74°F) +0.34°C (+0.61°F) +0.35°C (+0.63°F) |
18th warmest 15th warmest 11th warmest |
2002 (+0.98°C/1.76°F) 1998 (+0.58°C/1.04°F) 1998 (+0.61°C/1.10°F) |
| March-May | Anomaly | Rank | Warmest (or Next Warmest) Year on Record |
|---|---|---|---|
GlobalLandOcean Land and Ocean |
+1.04°C (+1.87°F) +0.33°C (+0.59°F) +0.52°C (+0.94°F) |
3rd warmest 10th warmest 7th warmest |
2007 (+1.17°C/2.11°F) 1998 (+0.53°C/0.95°F) 2005 (+0.65°C/1.17°F) |
Northern HemisphereLandOcean Land and Ocean |
+1.28°C (+2.30°F) +0.34°C (+0.61°F) +0.69°C (+1.24°F) |
3rd warmest 8th warmest 3rd warmest |
2000 (+1.36°C/2.45°F) 2005 (+0.52°C/0.94°F) 2007 (+0.77°C/1.39°F) |
Southern HemisphereLandOcean Land and Ocean |
+0.27°C (+0.49°F) +0.33°C (+0.59°F) +0.32°C (+0.58°F) |
25th warmest 19th warmest 20th warmest |
2005 (+0.96°C/1.73°F) 1998 (+0.57°C/1.03°F) 1998 (+0.61°C/1.10°F) |
| January-May | Anomaly | Rank | Warmest (or Next Warmest) Year on Record |
|---|---|---|---|
GlobalLandOcean Land and Ocean |
+0.75°C (+1.35°F) +0.31°C (+0.56°F) +0.42°C (+0.76°F) |
12th warmest 10th warmest 12th warmest |
2007 (+1.28°C/2.30°F) 1998 (+0.53°C/0.95°F) 2007 (+0.65°C/1.17°F) |
Northern HemisphereLandOcean Land and Ocean |
+0.89°C (+1.60°F) +0.31°C (+0.56°F) +0.53°C (+0.95°F) |
10th warmest 8th warmest 8th warmest |
2007 (+1.48°C/2.66°F) 1998 (+0.50°C/0.90°F) 2007 (+0.83°C/1.49°F) |
Southern HemisphereLandOcean Land and Ocean |
+0.32°C (+0.58°F) +0.31°C (+0.56°F) +0.31°C (+0.56°F) |
18th warmest 22nd warmest 20th warmest |
2005 (+0.89°C/1.60°F) 1998 (+0.57°C/1.03°F) 1998 (+0.61°C/1.10°F) |
The most current data may be accessed via the Global Surface Temperature Anomalies page.
Precipitation
The maps below represent anomaly values based on the GHCN data set of land surface stations using a base period of 1961-1990. During boreal spring, above-average precipitation fell over areas that included the Philippines, parts of Europe, Asia, and South America, and most of the eastern half of the contiguous U.S. Drier-than-average conditions were observed in the Hawaiian Islands, southeastern China, southern Africa, the northwestern and parts of the southern continental U.S., most of Australia, and parts of Paraguay and Argentina.
During May 2008, above-average precipitation fell over areas that included the Philippines, southern Burma, Japan, northeastern China, southwestern Europe, parts of South America, and from the northern Plains to the Lower Mississippi Valley. Drier-than-average conditions were observed across the Hawaiian Islands, British Isles, Sri Lanka, central Europe, parts of India, eastern China, northern Argentina, Paraguay, and most of Australia.
According to Australia's Bureau of Meteorology (BoM), precipitation across Australia was 73 percent below normal during May, resulting in the driest May on record. May 2008 had a national average of 7.86 mm (0.31 inches) of rain, surpassing the previous record of 8.27 mm (0.32 inches) set in 1961. During March-May, Australia, as a whole, experienced 53 percent below-normal precipitation, resulting in the eighth driest austral autumn.
During May 2008, typhoon Rammasun and typhoon Halong brought heavy rain across the Philippines, prompting widespread floods and landslides on the islands. Tropical cyclone Nargis, the most devastating cyclone to strike Asia since 1991, caused widespread floods across Burma (Myanmar). This resulted in the worst natural disaster ever recorded in the country. Heavy rain during May 21-26 prompted flash floods and landslides that killed 5 people and displaced nearly 15,000 people across south-central Chile. Additional details on flooding and drought can also be found on the May Global Hazards page.
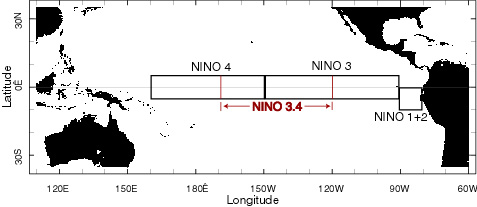
ENSO SST Analysis
Sea surface temperature (SST) anomalies in the Niño 3.4 and 4 regions warmed, but remained below average during May. Niño 1+2 region SST anomalies remained above average. These conditions are indicative of a weakening ENSO cold event (as shown in the adjacent animation of weekly SST anomalies). A comprehensive summary of May 2008 ENSO conditions can be found on the ENSO monitoring page. For the latest advisory on ENSO conditions go to NOAA's Climate Prediction center (CPC) and the CPC ENSO Diagnostic Discussion.
Images of sea surface temperature conditions are available for all weeks since 2003 at the weekly SST page.
References
Peterson, T.C. and R.S. Vose, 1997: An Overview of the Global Historical Climatology Network Database. Bull. Amer. Meteorol. Soc., 78, 2837-2849.
Quayle, R.G., T.C. Peterson, A.N. Basist, and C. S. Godfrey, 1999: An operational near-real-time global temperature index. Geophys. Res. Lett., 26, 333-335.
Smith, T.M., and R.W. Reynolds (2005), A global merged land air and sea surface temperature reconstruction based on historical observations (1880-1997), J. Clim., 18, 2021-2036.