Global Highlights:
- Based on preliminary data, the globally averaged combined land and sea surface temperature was the eighth warmest on record for June and the ninth warmest for January-June year-to-date period.
- June 2008 temperatures were above average in Australia, northwestern Africa, eastern Brazil, the eastern and southern continental U.S., and most of Europe and Russia. Meanwhile, cooler-than-average conditions were present across the north-central and northwestern contiguous U.S., the southern countries of South America, northern India, and western Russia.
- Precipitation during June 2008 was above average in the Philippines, British Isles, Finland, Kenya, the midwestern and northeastern continental U.S., northern India, and eastern and southern China. Drier-than-average conditions were observed across the southern and most of the western U.S., parts of Europe, southern Australia, and South America.
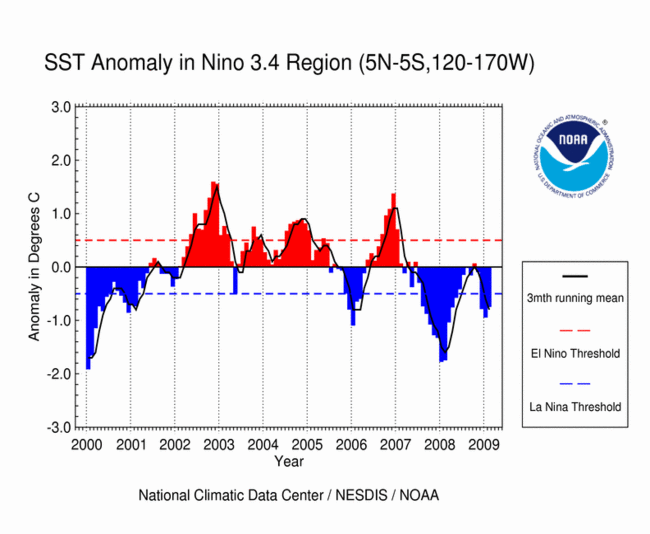
- El Niño Southern Oscillation (ENSO) conditions transitioned to a neutral phase during June.
Contents of this Section:
The data presented in this report are preliminary. Ranks and anomalies may change as more complete data are received and processed. The most current data may be accessed via the Global Surface Temperature Anomalies page.
Introduction
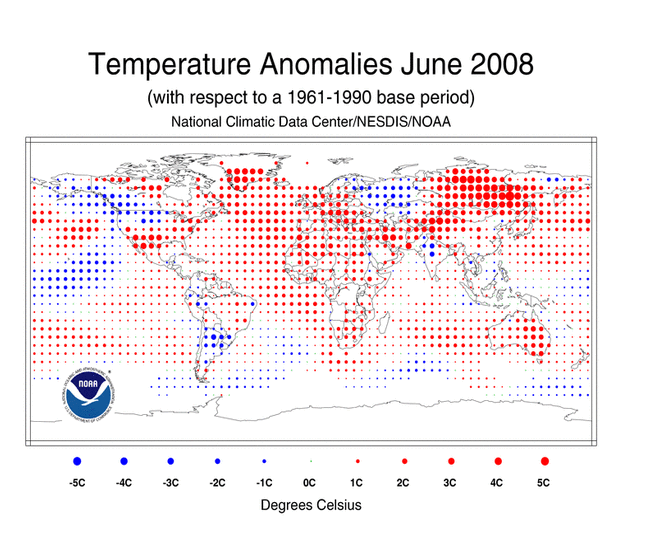
Temperature anomalies for June 2008 are shown on the dot maps below. The dot map, below left, provides a spatial representation of anomalies calculated from the Global Historical Climatology Network (GHCN) data set of land surface stations using a 1961-1990 base period. The dot map, below right, is a product of a merged land surface and sea surface temperature anomaly analysis developed by Smith and Reynolds (2005). Temperature anomalies with respect to the 1961-1990 mean for land and ocean are analyzed separately and then merged to form the global analysis. Additional information on this product is available.
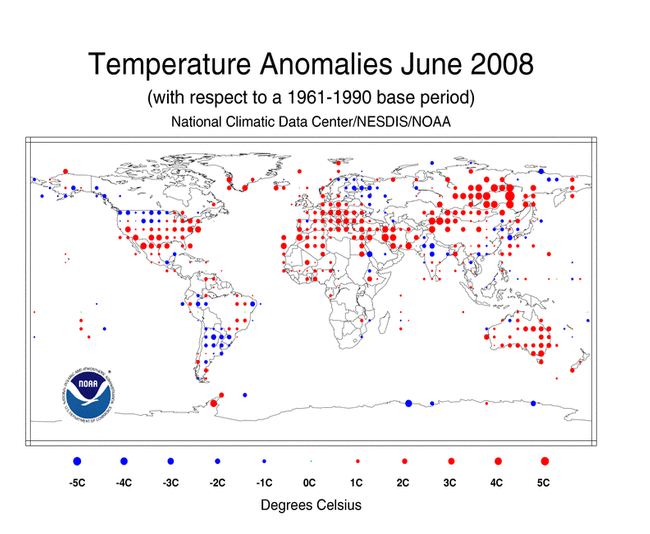
During June, above average temperatures were observed across Australia, northwestern Africa, eastern Brazil, the eastern and southern continental U.S., and most of Europe and Russia. Meanwhile, cooler-than-average conditions were present across the north-central and northwestern contiguous U.S., the southern countries of South America, northern India, and western Russia.
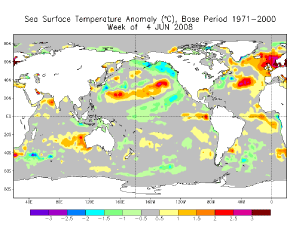
Sea surface temperatures (SST) during June 2008 were warmer than average in the Atlantic, northwestern Pacific and eastern equatorial Pacific oceans, and parts of the Indian Ocean. Cooler-than-average conditions were present in parts of the southern oceans and in the Niño 3.4 and 4 regions. Temperatures across the Niño 3.4 and Niño 4 regions warmed but the anomalies remained below average. Please see the latest ENSO discussion for additional information.
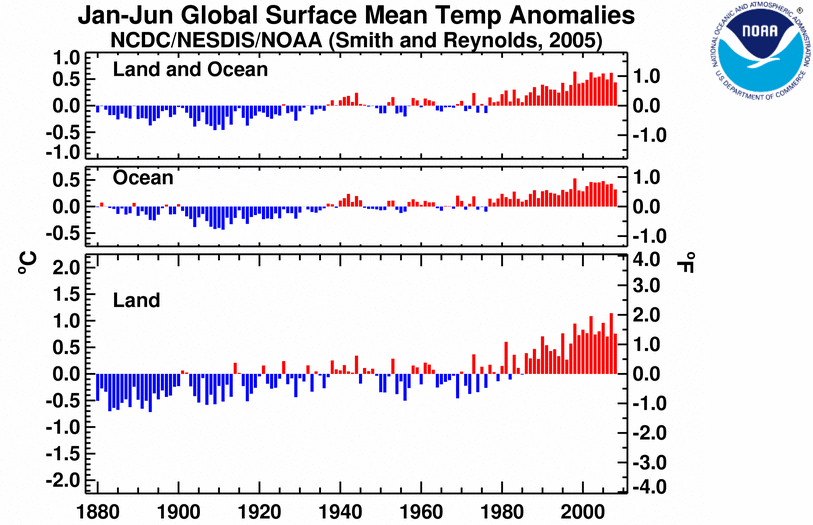
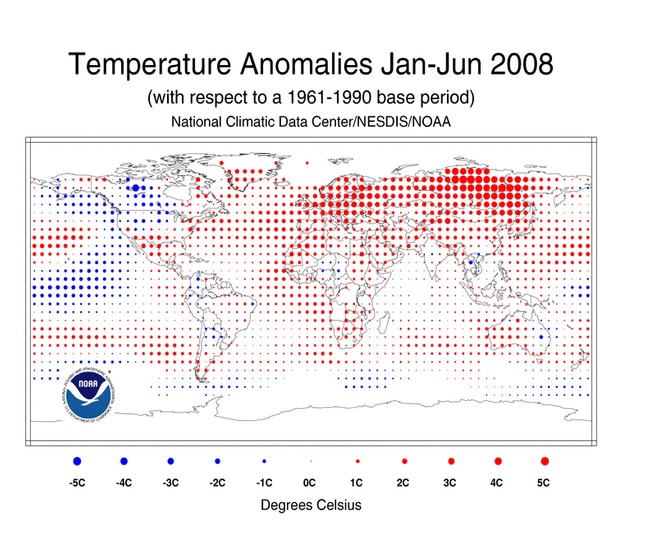
Anomalously warm temperatures covered much of the world's land surface throughout the first half of the year. The January-June 2008 map shows the presence of warmer-than-average temperatures across Europe, Asia, western and central Australia, the eastern and southern continental U.S., parts of South America, and most of Africa. Elsewhere, cooler-than-average conditions were observed in parts of the northwestern and north-central states of the contiguous U.S., central Africa, eastern Australia, and other parts of South America.
Warmer-than-average SST conditions during January-June 2008 were present in the Atlantic and Indian oceans, eastern equatorial Pacific and parts of the northwest Pacific oceans. Cooler-than-average conditions were observed in the central equatorial Pacific, parts of the northeastern Pacific and some areas in the southern oceans.
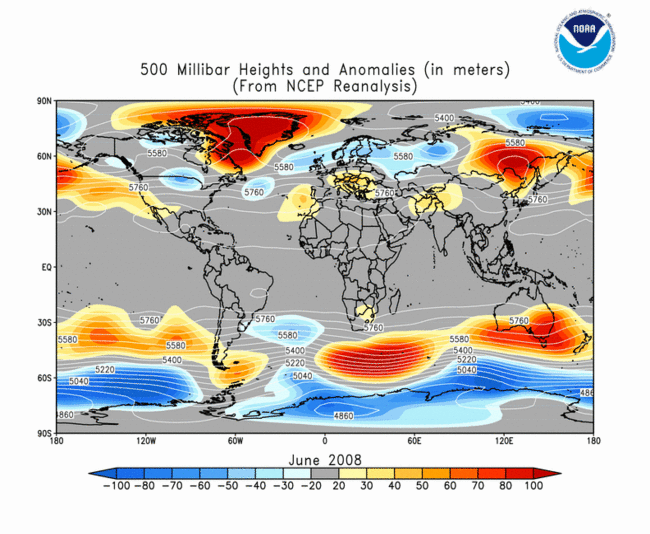
The mean position of the upper level ridges of high pressure and troughs of low pressure (depicted by positive and negative 500-millibar height anomalies on the June map, respectively) are generally reflected by areas of positive and negative temperature anomalies at the surface, respectively. For other Global products, please see the Climate Monitoring Global Products page.
Images of sea surface temperature conditions are available for all weeks during 2008 at the weekly SST page.
Temperature Rankings and Graphics
Effective with the February 2006 report, NCDC transitioned from the use of the Operational Global Surface Temperature Index (Quayle et al. 1999) to the blended land and ocean dataset developed by Smith and Reynolds (2005). The differences between the two methods are discussed in Smith et al. (2005). The ranks found in the tables below are based on records that began in 1880.
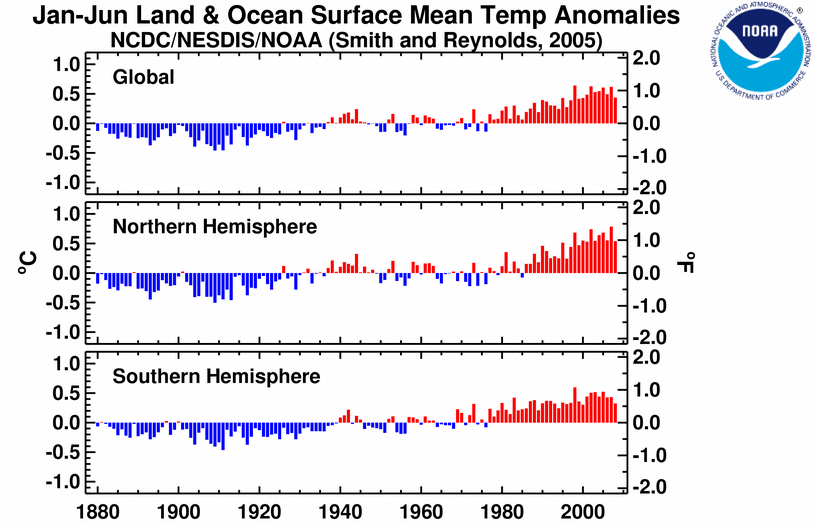
The combined global land and ocean surface temperature was the eighth warmest on record in June and the ninth warmest on record for the January-June year-to-date period. The global average ocean sea surface temperature (SST) in June was the tenth warmest on record.
| June | Anomaly | Rank | Warmest (or Next Warmest) Year on Record |
|---|---|---|---|
GlobalLandOcean Land and Ocean |
+0.71°C (+1.28°F) +0.39°C (+0.70°F) +0.48°C (+0.86°F) |
4th warmest 10th warmest 8th warmest |
2005 (+0.98°C/1.76°F) 2005 (+0.52°C/0.94°F) 2005 (+0.64°C/1.15°F) |
Northern HemisphereLandOcean Land and Ocean |
+0.82°C (+1.48°F) +0.45°C (+0.81°F) +0.59°C (+1.06°F) |
5th warmest 9th warmest 6th warmest |
2006 (+1.09°C/1.96°F) 2005 (+0.62°C/1.12°F) 2005 (+0.74°C/1.33°F) |
Southern HemisphereLandOcean Land and Ocean |
+0.36°C (+0.65°F) +0.35°C (+0.63°F) +0.35°C (+0.63°F) |
23rd warmest 11th warmest 12th warmest |
2005 (+1.10°C/1.98°F) 1998 (+0.51°C/0.92°F) 1998 (+0.55°C/0.99°F) |


| January-June | Anomaly | Rank | Warmest (or Next Warmest) Year on Record |
|---|---|---|---|
GlobalLandOcean Land and Ocean |
+0.76°C (+1.37°F) +0.32°C (+0.58°F) +0.44°C (+0.79°F) |
8th warmest 10th warmest 9th warmest |
2007 (+1.14°C/2.05°F) 1998 (+0.53°C/0.95°F) 1998 (+0.64°C/1.15°F) |
Northern HemisphereLandOcean Land and Ocean |
+0.88°C (+1.58°F) +0.33°C (+0.59°F) +0.54°C (+0.97°F) |
8th warmest 8th warmest 8th warmest |
2007 (+1.34°C/2.41°F) 2005 (+0.51°C/0.92°F) 2007 (+0.78°C/1.40°F) |
Southern HemisphereLandOcean Land and Ocean |
+0.36°C (+0.65°F) +0.32°C (+0.58°F) +0.32°C (+0.58°F) |
18th warmest 19th warmest 19th warmest |
2005 (+0.92°C/1.66°F) 1998 (+0.56°C/1.01°F) 1998 (+0.60°C/1.08°F) |
The most current data may be accessed via the Global Surface Temperature Anomalies page.
Precipitation
The maps below represent anomaly values based on the GHCN data set of land surface stations using a base period of 1961-1990. During June 2008, above average precipitation fell over areas that include the Philippines, British Isles, Finland, Kenya, the midwestern and northeastern continental U.S., northern India, and eastern and southern China. Drier-than-average conditions were observed across the southern and most of the western U.S., parts of Europe, southern Australia, and South America.
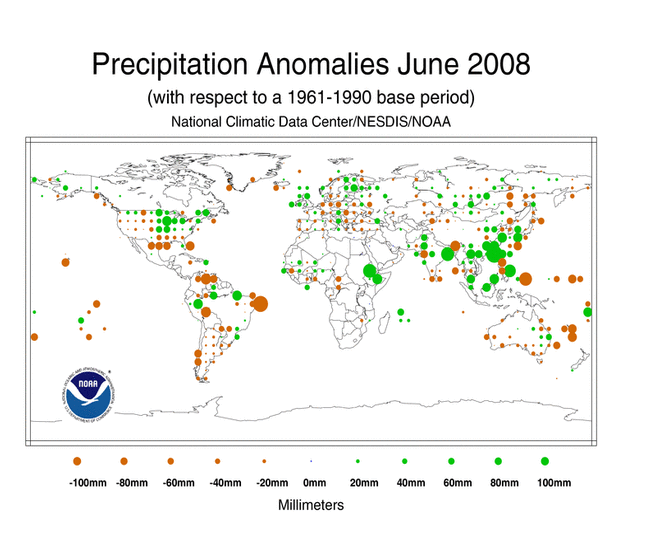

In the U.S., heavy rain fell during the first half of June across much of the Midwest, prompting the worst floods in 15 years and causing numerous new record river crest levels. For more information, please visit the June Midwest Flooding page. In southern China, severe storms and Typhoon Fengshen brought heavy rain across the area, causing widespread floods and landslides. The copious amounts of rainfall the storms brought across southern China prompted June 2008 to be the wettest month ever on record for Hong Kong, Guangzhou, and Macao, according to the Hong Kong Observatory. Records began in 1884. Hong Kong received a total of 1,346.1 mm (53 inches) of rain during June 2008, surpassing the previous record set in May 1889 by 105 mm (4 inches) of rain. As of 29 June 2008, Guangzhou received a total of 872.7 mm (34.4 inches) of rain and Macao received a total of 1200.8 mm (47.3 inches) of rain. The previous records for Guangzhou and Macao were set in June 1959 and May 1972 when a total of 684 mm (27 inches) and 975.2 mm (38.4 inches) of rain fell, respectively.
Additional details on flooding and drought can also be found on the June Global Hazards page.
ENSO SST Analysis
Sea surface temperatures (SST) warmed across the equatorial Pacific Ocean during June, as the La Niña episode weakened to a neutral phase (shown in the adjacent animation of weekly sea surface temperature anomalies). A comprehensive summary of June 2008 ENSO conditions can be found on the ENSO monitoring page. For the latest advisory on ENSO conditions go to NOAA's Climate Prediction Center (CPC) and the CPC ENSO Diagnostic Discussion.
Images of sea surface temperature conditions are available for all weeks since 2003 at the weekly SST page.
References
Peterson, T.C. and R.S. Vose, 1997: An Overview of the Global Historical Climatology Network Database. Bull. Amer. Meteorol. Soc., 78, 2837-2849.
Quayle, R.G., T.C. Peterson, A.N. Basist, and C. S. Godfrey, 1999: An operational near-real-time global temperature index. Geophys. Res. Lett., 26, 333-335.
Smith, T.M., and R.W. Reynolds (2005), A global merged land air and sea surface temperature reconstruction based on historical observations (1880-1997), J. Clim., 18, 2021-2036.