Temperature
NOAA's National Centers for Environmental Information calculates the global temperature anomaly every month based on preliminary data generated from authoritative datasets of temperature observations from around the globe. The major dataset, NOAAGlobalTemp version 5, updated in mid-2019, uses comprehensive data collections of increased global area coverage over both land and ocean surfaces. NOAAGlobalTempv5 is a reconstructed dataset, meaning that the entire period of record is recalculated each month with new data. Based on those new calculations, the new historical data can bring about updates to previously reported values. These factors, together, mean that calculations from the past may be superseded by the most recent data and can affect the numbers reported in the monthly climate reports. The most current reconstruction analysis is always considered the most representative and precise of the climate system, and it is publicly available through Climate at a Glance.
June 2022
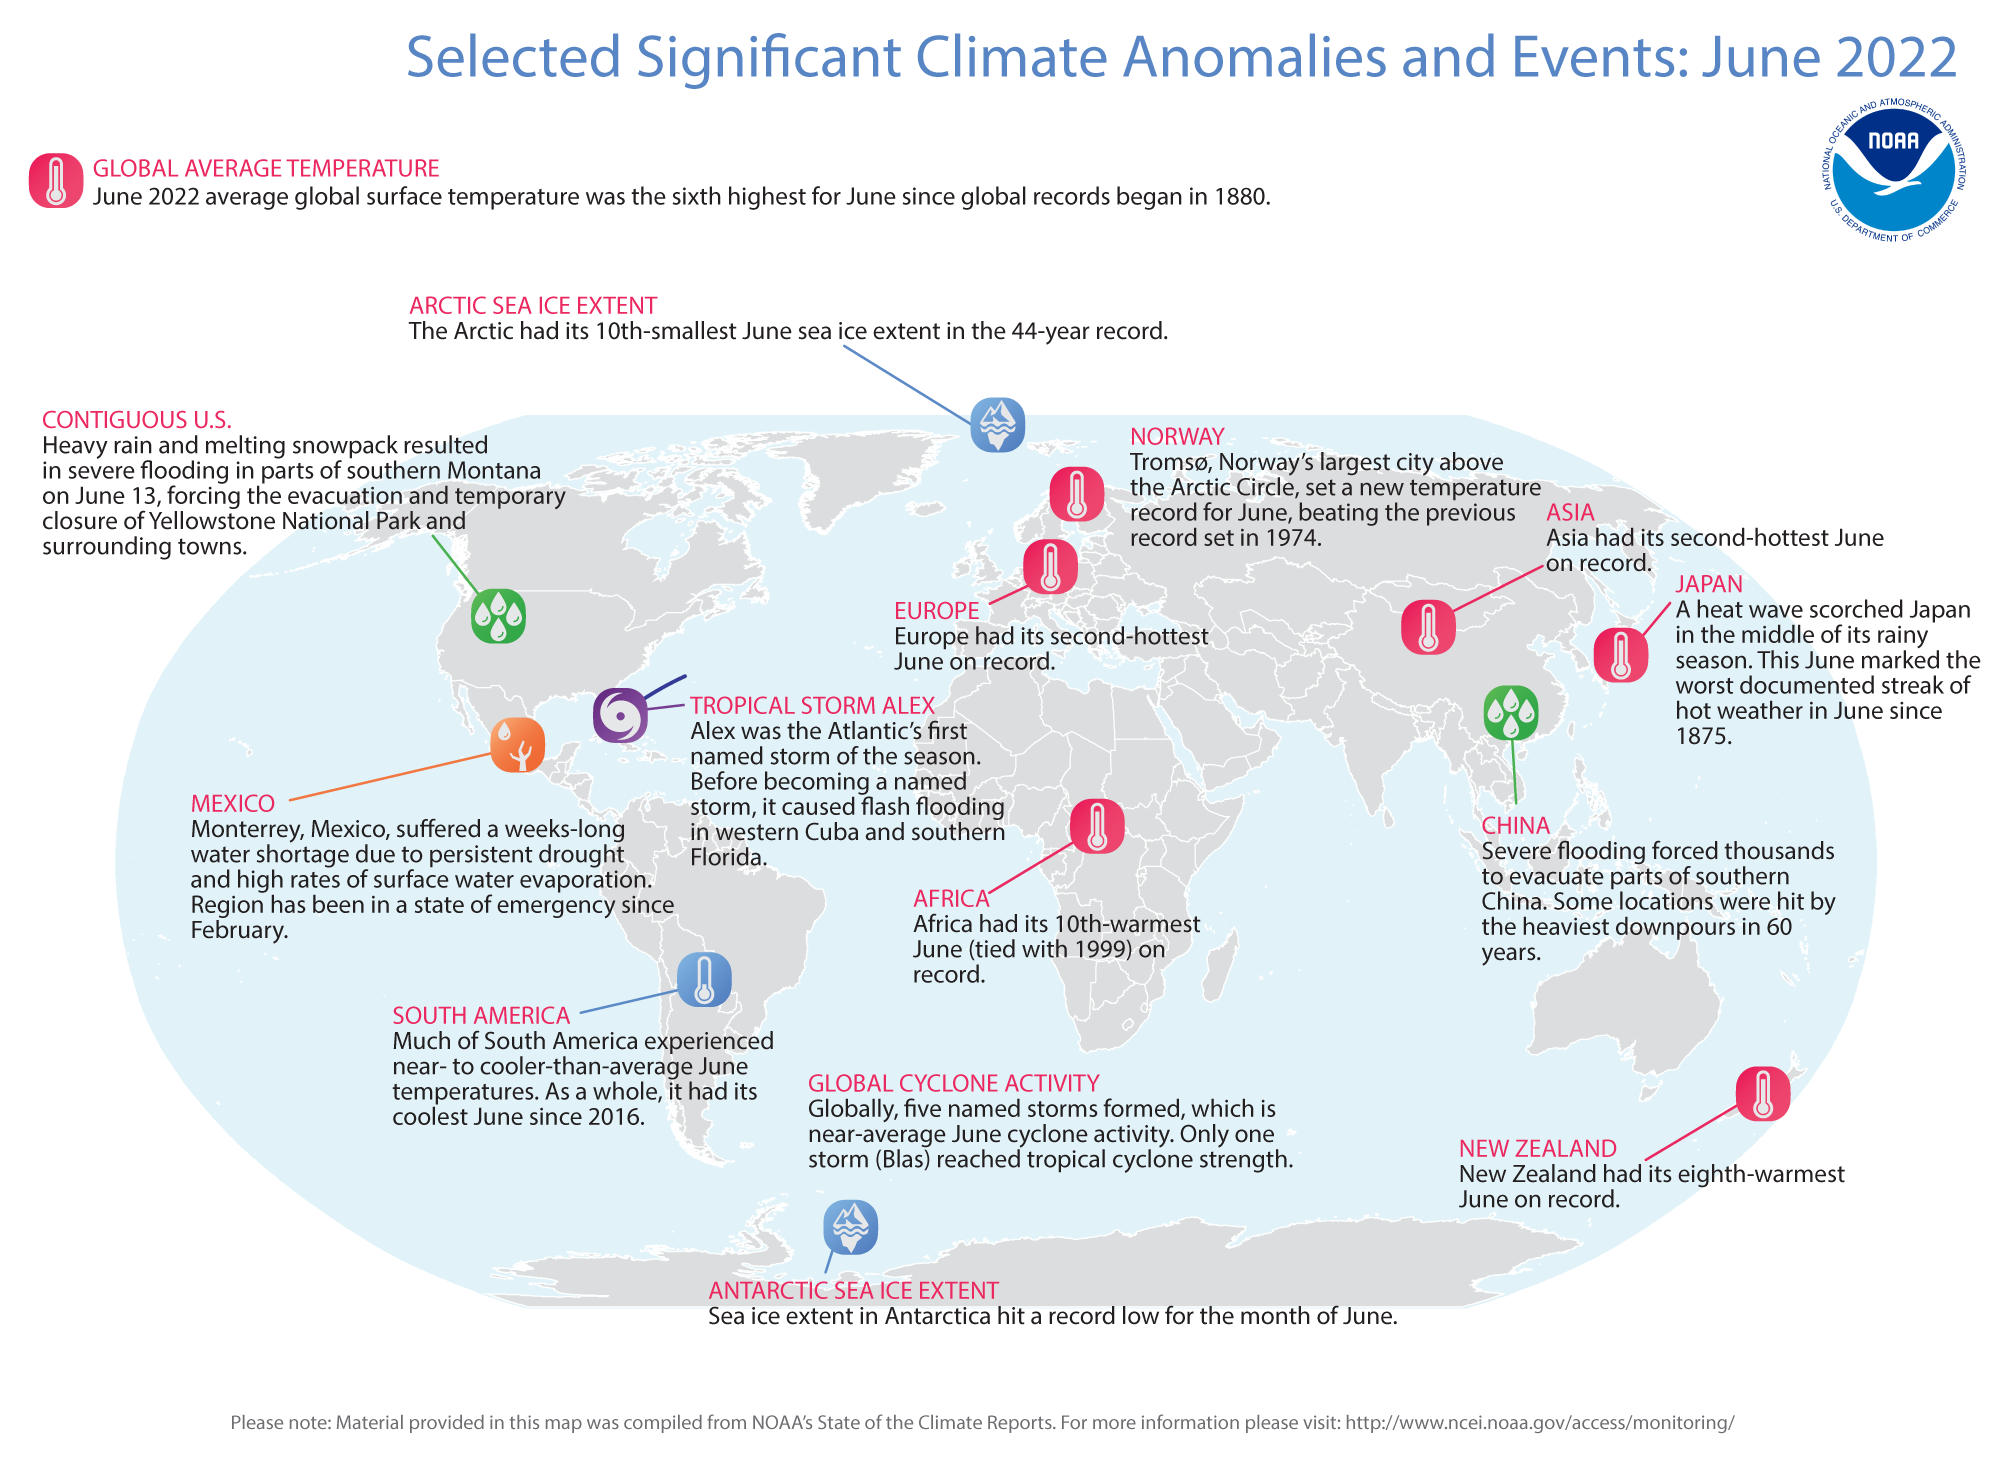
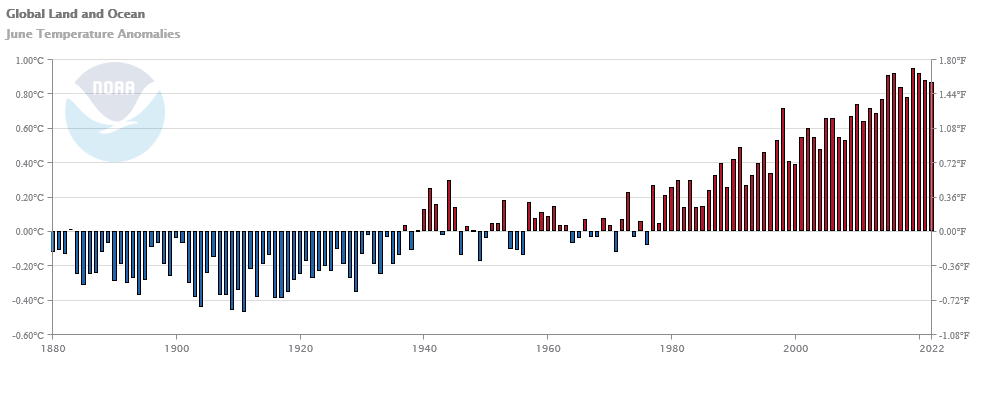
The global surface temperature for June 2022 was the sixth-highest in the 143-year record at 0.87°C (1.57°F) above the 20th century average. This month was also 0.08°C (0.14°F) cooler than the warmest June on record set in 2019. The ten warmest Junes have all occurred since 2010. June 2022 also marked the 46th consecutive June and the 450th consecutive month with temperatures, at least nominally, above the 20th-century average.
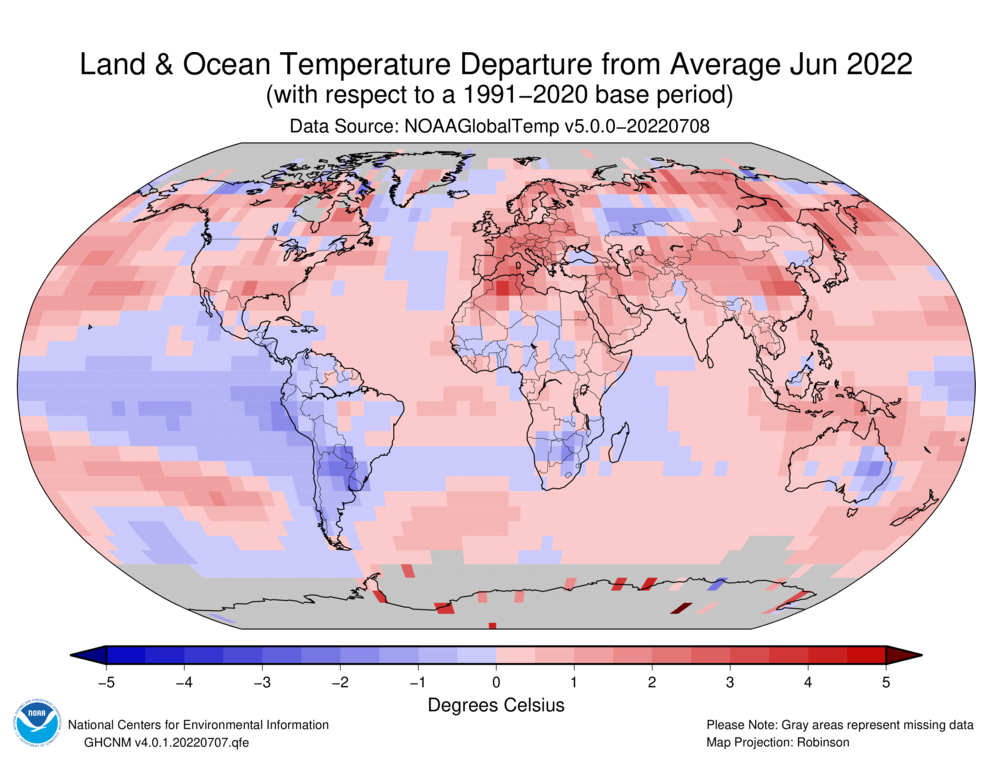
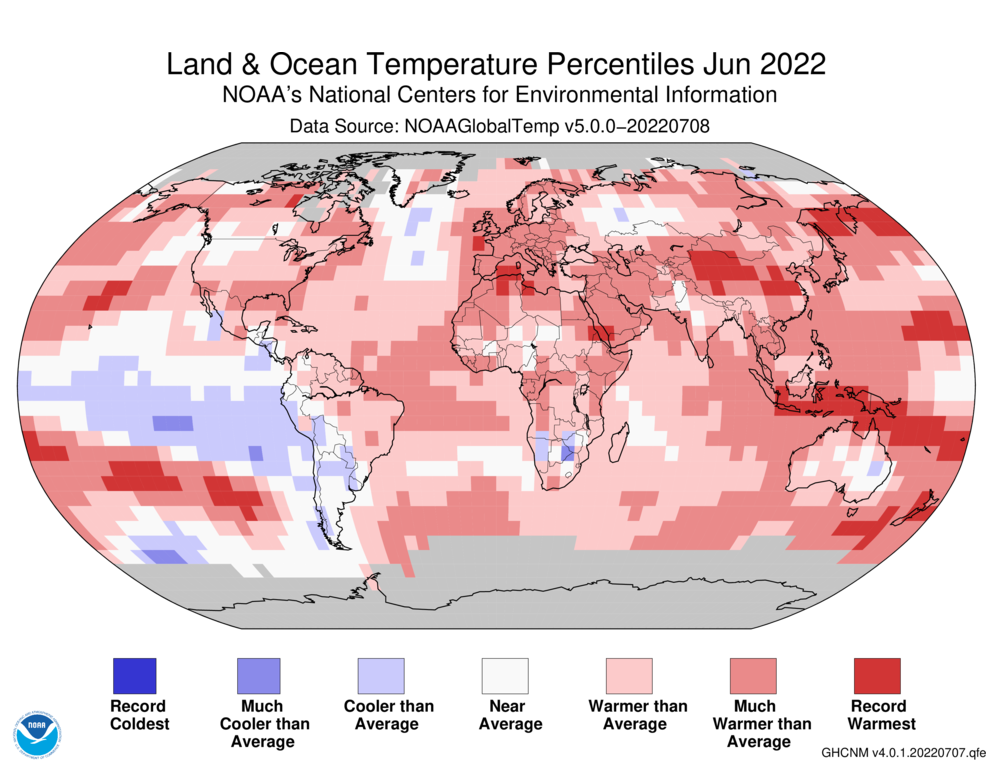
June 2022 was characterized by much-above-average temperatures across parts of North America, Europe, Africa, Asia, and across parts of the northern, western, and southwestern Pacific Ocean, as well as parts of the Atlantic and eastern Indian oceans. Record-warm June temperatures were present across parts of China, the northern, western, and southeastern Pacific Ocean, as well as across small areas in the Middle East and northern Africa. This encompassed about 7.68% of the globe's land and ocean surfaces with a record high June temperature. This was the highest percentage for June since records began in 1951, surpassing the previous record set in 2010 (7.37%).
Meanwhile, near- to cooler-than-average temperatures were observed across parts of western and southern South America, south-central, central and eastern tropical Pacific Ocean, the northern Atlantic Ocean, as well as small regions in western Russia, southern Africa and eastern Australia. However, during June 2022, there were no areas with record-cold June temperatures.
The month of June marks the beginning of the meteorological summer for the Northern Hemisphere and winter for the Southern Hemisphere. The Northern Hemisphere, as a whole, had its fifth-warmest June on record. However, the land portion of the Northern Hemisphere had a near-record warm June with a temperature departure of +1.56°C (+2.81°F), which is 0.14°C (0.25°F) shy of tying the record set only last year (2021). Meanwhile, the Southern Hemisphere's June surface temperature departure of +0.62°C (+1.12°F) tied with 2009, 2014, and 2018 as the seventh-highest on record.
The month of June started off with very warm temperatures across much of the Northern Hemisphere. Several locations across Europe, northern Africa, and the Middle East experienced daily maximum (daytime) temperatures over 35.0°C (95.0°F), with some locations reaching 50.0°C (122.0°F) during the first week of the month. The city of Isesaki, which is located in Japan's Gunma prefecture, had a maximum temperature of 40.1°C (104.2°F) on June 25, 2022 — a new national maximum temperature record for June. This also marked the first time Japan had a maximum temperature of 40.0°C (104.0°F) in June and was only 1.0°C (1.8°F) cooler than the all-time record of 41.1°C (106.0°F). Minimum (nighttime) temperatures were also unusually warm, not allowing any respite since some locations remained above 25.0°C (77.0°F). According to the World Meteorological Organization, minimum temperatures across Scandinavia were above 30.0°C (86.0°F).
The extreme heat that was present across much of Asia and Europe throughout the month resulted in both continents having their second-warmest June on record, trailing closely behind their respective record-warm Junes of 2012 and 2019.
- Norway had its tenth-warmest June on record at 1.7°C (3.1°F) above average. According to Meteorologisk Institute, 44 stations across Norway set their highest June temperature on record.
- Spain's June 2022 temperature was 2.0°C (3.6°F) above the 1981–2010 average, which is the fourth-highest for June since national records began in 1961. Only Junes of 2003, 2005, and 2017 were warmer. A heat wave affected the Peninsula and Balearic Islands during June 11–18 and, according to Spain's Agencia Estatal de Meteorología, this was the earliest heat wave, equaling records set back in June 1981.
- France had its third-warmest June since national records began in 1900. Only Junes of 2003 and 2017 were warmer. According to Météo France, six of the nation's 10 warmest Junes have occurred in the last 10 years.
- Switzerland had a monthly temperature that was 2.7°C (4.9°F) above the 1991–2020 average and was the second-warmest June since national records began in 1864. Only June of 2003 was warmer (+4.7°C / +8.5°F).
- Austria had a national temperature that was 2.3°C (4.1°F) above the 1991–2020 average — tying with June 2017 as the fourth-warmest June in the nation's 256-year record. Five of Austria's ten warmest Junes have occurred since 2017, while eight of the ten have occurred since 2002.
North America and Africa had their seventh and tenth-warmest June on record, respectively. Although South America had a June temperature that was above average, it was its coldest June since 2016. Oceania also had an above-average June; however, it didn't rank among the top 20 warmest on record.
- Australia, as a whole, had an above-average June temperature. During the start of the month, temperatures were between 1.0°–4.0°C (1.8°–7.2°F) above average in the northern region, with several locations setting new daily maximum temperature records for the month. Of note, Bradshaw (Northern Territory) had a maximum temperature of 37.8°C (100.0°F) on June 5 — tying the second-warmest maximum temperature in June for Australia and was only 0.1°C (0.2°F) shy of tying the national record set on June 7, 2016. Meanwhile, the McCluer Island set a new record for the highest minimum temperature for the Northern Territory when minimum temperatures dropped to 28.1°C (82.6°F). This was also the sixth-highest minimum June temperature for Australia. New South Wales was the only Australian region to experience below-average June temperatures and had its coldest maximum June temperatures since 2007.
- New Zealand had a June temperature of 9.9°C (49.8°F), which is 1.3°C (2.3°F) above the 1981–2010 average and the eighth-warmest June since national records began in 1909.
| June | Anomaly | Rank (out of 143 years) | Records | ||||
|---|---|---|---|---|---|---|---|
| °C | °F | Year(s) | °C | °F | |||
| Global | |||||||
| Land | +1.30 ± 0.20 | +2.34 ± 0.36 | Warmest | 2nd | 2021 | +1.41 | +2.54 |
| Coolest | 142nd | 1907 | -0.64 | -1.15 | |||
| Ties: 2019 | |||||||
| Ocean | +0.71 ± 0.14 | +1.28 ± 0.25 | Warmest | 5th | 2016, 2019 | +0.81 | +1.46 |
| Coolest | 139th | 1911 | -0.49 | -0.88 | |||
| Ties: 2017 | |||||||
| Land and Ocean | +0.87 ± 0.15 | +1.57 ± 0.27 | Warmest | 6th | 2019 | +0.95 | +1.71 |
| Coolest | 138th | 1911 | -0.47 | -0.85 | |||
| Northern Hemisphere | |||||||
| Land | +1.56 ± 0.20 | +2.81 ± 0.36 | Warmest | 2nd | 2021 | +1.70 | +3.06 |
| Coolest | 142nd | 1907 | -0.77 | -1.39 | |||
| Ocean | +0.86 ± 0.14 | +1.55 ± 0.25 | Warmest | 5th | 2019, 2020 | +1.03 | +1.85 |
| Coolest | 139th | 1904 | -0.53 | -0.95 | |||
| Land and Ocean | +1.12 ± 0.17 | +2.02 ± 0.31 | Warmest | 5th | 2019, 2021 | +1.16 | +2.09 |
| Coolest | 139th | 1909 | -0.49 | -0.88 | |||
| Southern Hemisphere | |||||||
| Land | +0.63 ± 0.11 | +1.13 ± 0.20 | Warmest | 22nd | 2015 | +1.21 | +2.18 |
| Coolest | 122nd | 1885 | -1.03 | -1.85 | |||
| Ties: 2001 | |||||||
| Ocean | +0.61 ± 0.15 | +1.10 ± 0.27 | Warmest | 6th | 2016 | +0.71 | +1.28 |
| Coolest | 138th | 1911 | -0.51 | -0.92 | |||
| Land and Ocean | +0.62 ± 0.14 | +1.12 ± 0.25 | Warmest | 7th | 2015, 2019 | +0.73 | +1.31 |
| Coolest | 137th | 1911 | -0.59 | -1.06 | |||
| Ties: 2009, 2014, 2018 | |||||||
| Arctic | |||||||
| Land and Ocean | +1.68 ± 0.23 | +3.02 ± 0.41 | Warmest | 7th | 2016 | +2.03 | +3.65 |
| Coolest | 137th | 1886 | -1.42 | -2.56 | |||
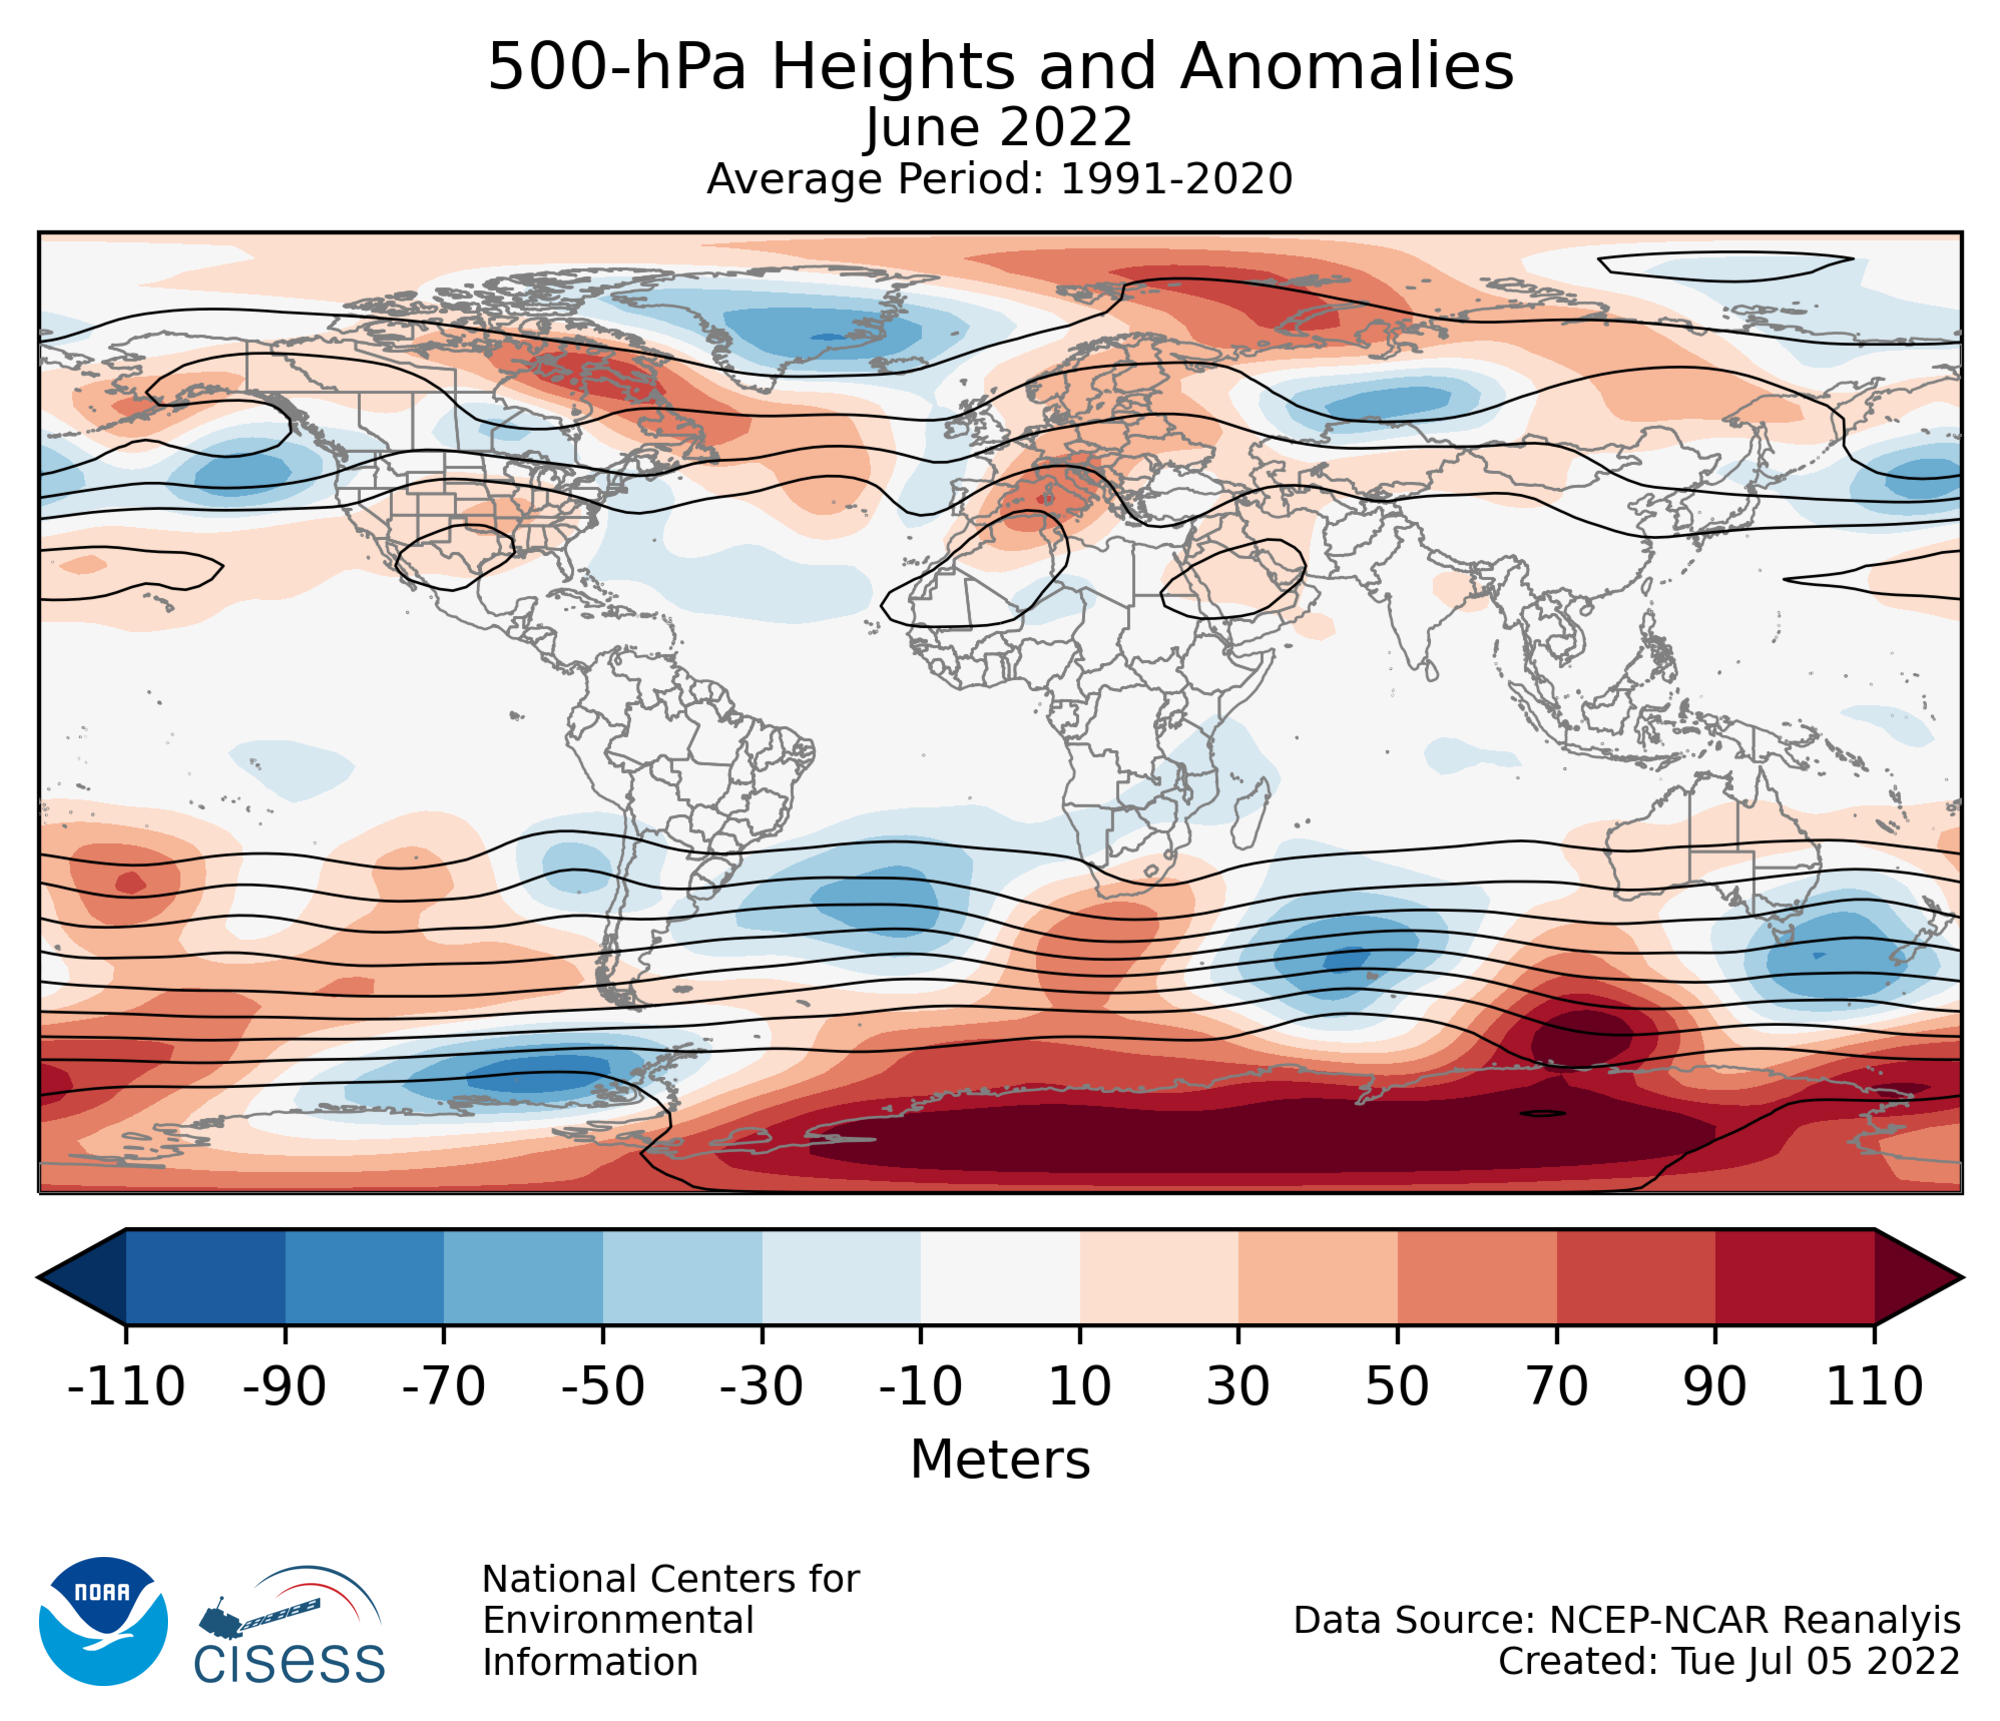
500 mb maps
In the atmosphere, 500-millibar height pressure anomalies correlate well with temperatures at the Earth's surface. The average position of the upper-level ridges of high pressure and troughs of low pressure—depicted by positive and negative 500-millibar height anomalies on the June 2022 map—is generally reflected by areas of positive and negative temperature anomalies at the surface, respectively.
January–June 2022
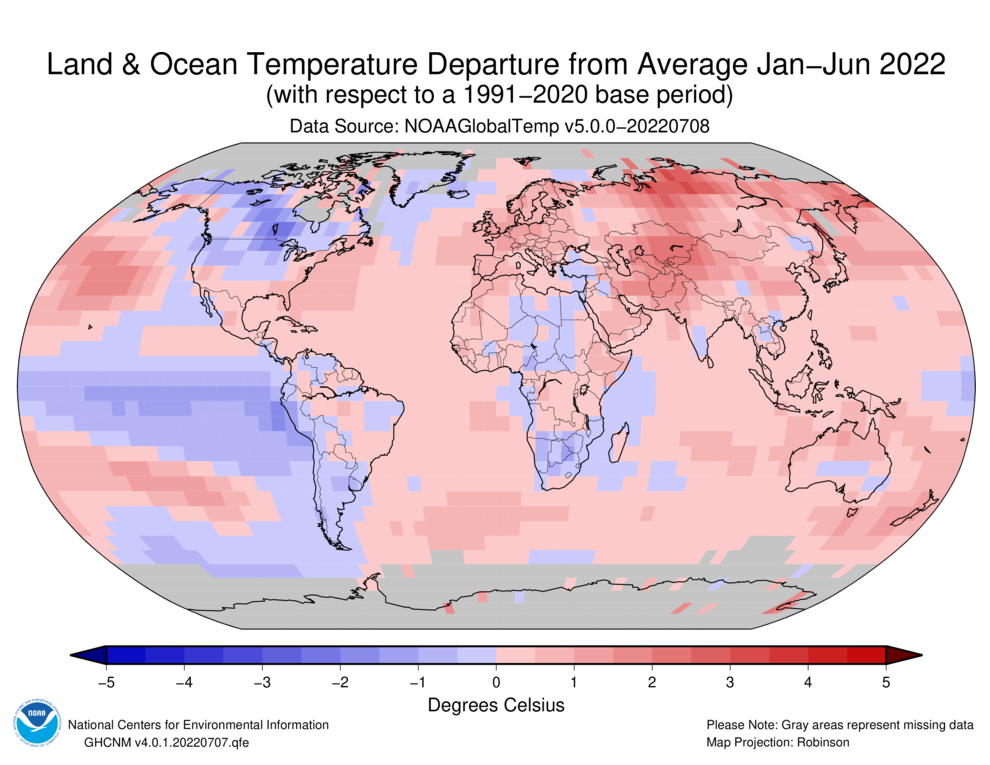
The January–June 2022 global surface temperature was 0.85°C (1.53°F) above the 20th century average, which is the sixth-highest for the January–June period since records began in 1880. This was 0.26°C (0.47°F) less than the record set in 2016. According to NCEI's global annual temperature ranking outlook, there is greater than 99% chance that the year will rank among the 10 warmest years on record, with only 11% chance of ranking among the five warmest years.
The first half of the year was characterized by much-warmer-than-average conditions across much of the globe, with record-high temperatures across parts of the North Atlantic and Pacific oceans, as well as parts of Asia and small areas in Africa and South America. Meanwhile, cooler-than-average temperatures during January–June were present across the central, eastern tropical and southeastern Pacific Ocean, North America, North Atlantic (southern Greenland) and southern Africa. However, no land or ocean areas had a record-cold January–June.
Asia, as a whole, had a temperature departure of +2.23°C (+4.01°F) — the second-highest for January–June since continental records began in 1910. This value was 0.54°C (0.97°F) less than the record set in 2020.
Europe and Oceania had a top seven warm January–June period. Despite North America, South America, and Africa having an above-average year-to-date temperature, this was their coldest such period since 2014, 2011, and 2012, respectively.

| January–June | Anomaly | Rank (out of 143 years) | Records | ||||
|---|---|---|---|---|---|---|---|
| °C | °F | Year(s) | °C | °F | |||
| Global | |||||||
| Land | +1.36 ± 0.16 | +2.45 ± 0.29 | Warmest | 6th | 2016 | +1.84 | +3.31 |
| Coolest | 138th | 1893 | -0.87 | -1.57 | |||
| Ocean | +0.66 ± 0.17 | +1.19 ± 0.31 | Warmest | 5th | 2016 | +0.84 | +1.51 |
| Coolest | 139th | 1904, 1911 | -0.50 | -0.90 | |||
| Ties: 2015 | |||||||
| Land and Ocean | +0.85 ± 0.17 | +1.53 ± 0.31 | Warmest | 6th | 2016 | +1.11 | +2.00 |
| Coolest | 138th | 1911 | -0.54 | -0.97 | |||
| Northern Hemisphere | |||||||
| Land | +1.58 ± 0.19 | +2.84 ± 0.34 | Warmest | 5th | 2016 | +2.09 | +3.76 |
| Coolest | 139th | 1893 | -0.98 | -1.76 | |||
| Ocean | +0.78 ± 0.16 | +1.40 ± 0.29 | Warmest | 5th | 2016, 2020 | +0.95 | +1.71 |
| Coolest | 139th | 1904 | -0.52 | -0.94 | |||
| Land and Ocean | +1.09 ± 0.16 | +1.96 ± 0.29 | Warmest | 5th | 2016 | +1.38 | +2.48 |
| Coolest | 139th | 1893 | -0.63 | -1.13 | |||
| Southern Hemisphere | |||||||
| Land | +0.81 ± 0.14 | +1.46 ± 0.25 | Warmest | 12th | 2019 | +1.26 | +2.27 |
| Coolest | 132nd | 1917 | -0.89 | -1.60 | |||
| Ocean | +0.58 ± 0.17 | +1.04 ± 0.31 | Warmest | 8th | 2016 | +0.77 | +1.39 |
| Coolest | 136th | 1911 | -0.52 | -0.94 | |||
| Land and Ocean | +0.61 ± 0.17 | +1.10 ± 0.31 | Warmest | 8th | 2016 | +0.83 | +1.49 |
| Coolest | 136th | 1911 | -0.54 | -0.97 | |||
| Ties: 2018 | |||||||
| Arctic | |||||||
| Land and Ocean | +1.94 ± 0.20 | +3.49 ± 0.36 | Warmest | 5th | 2016 | +2.92 | +5.26 |
| Coolest | 139th | 1902 | -1.59 | -2.86 | |||
Precipitation
June 2022
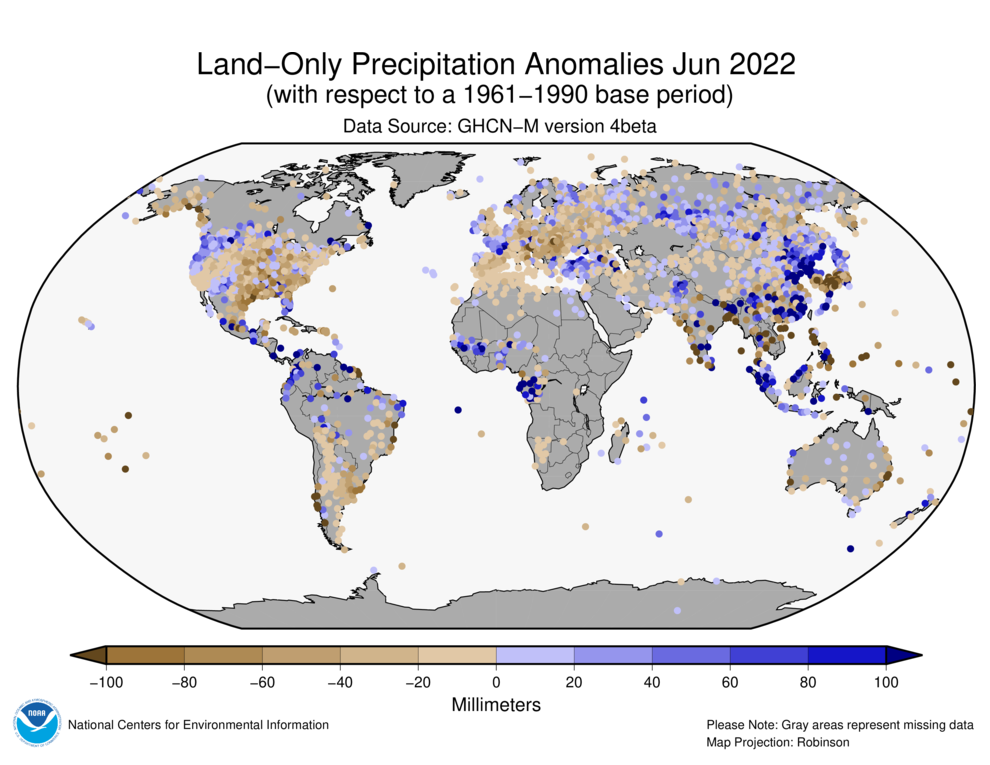
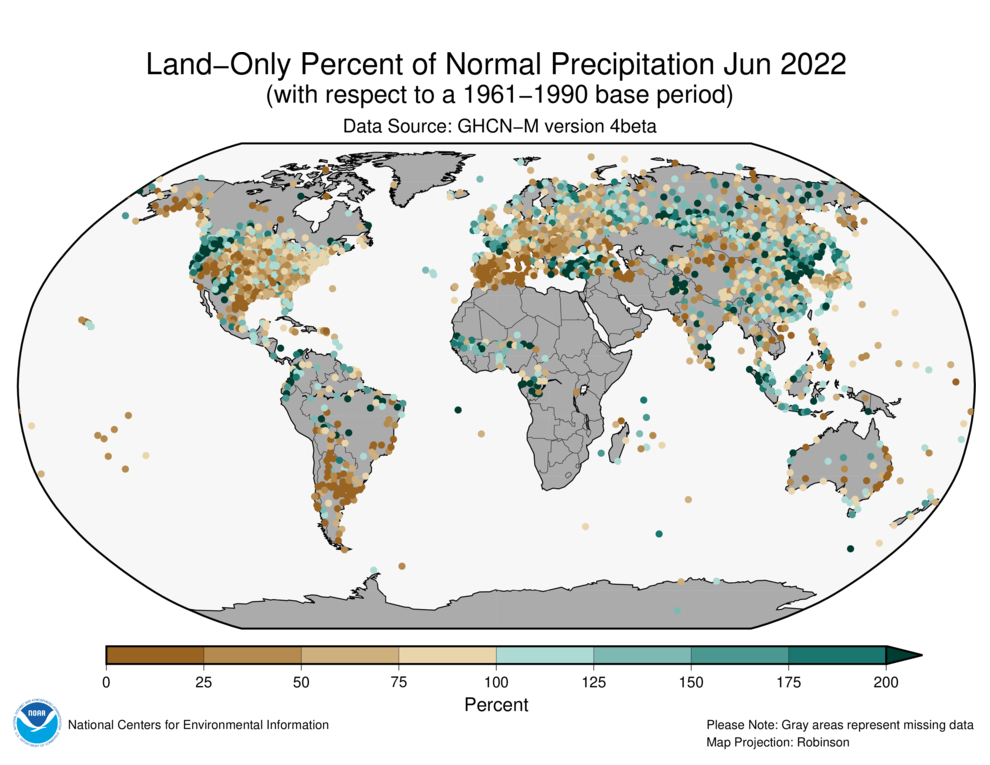
As is typical, precipitation anomalies during June 2022 varied significantly around the world. Significantly below-average precipitation occurred across southern Alaska, southern and central parts of the contiguous U.S, southern South America, western and southern Europe, eastern coast of Australia, and across parts of Asia. Significantly above-average precipitation occurred across parts of western contiguous U.S., northern South America, northern parts of Europe, Turkey, central and eastern Russia, and eastern and southern Asia.
Several heavy rain events impacted parts of Colombia during June. On June 10, floods were triggered by copious amounts of rain, leaving over 500 people affected in the Magdalena Departments.
Much of Spain experienced very dry conditions during the month. Overall, the national precipitation average of 18.8 mm (0.74 inch) was 53% of normal and the eighth-driest June on record.
According to ReliefWeb, torrential rain affected parts of southern and eastern China during the latter half of the month. The heavy downpours prompted the overflow of rivers and devastating floods that damaged over 1,500 homes and over 25 hectares of crops. According to reports, some locations had their highest rainfall totals in 60 years.
The Republic of Kiribati (an island in the central Pacific Ocean) was affected by drought, forcing its government to declare a State of Disaster on June 11. According to ReliefWeb, close to 40% of the nation's population was affected by drought. As drought continues to worsen the risk of water contamination, water accessibility, and availability also increases, which can lead to health issues in the island.
Drier-than-average conditions were present across much of Australia, resulting in a national average that was 22% below average for June. Regionally, New South Wales had the most deficit during the month at 58% below average, which is the driest June since 1986 and the eighth-driest in the nation's 123-year precipitation records. Victoria, Tasmania, and Northern Territory had a wetter-than-average June, with the Northern Territory having the largest precipitation departure at 71% above average.
Much of northern and central Mexico was in some type of drought, according to the May 31, 2022 North American Drought Monitor. Drought conditions in the northern region have been lingering since the start of the year. However, the lack of precipitation and very warm conditions have only made things worse. Monterrey, a city in northeastern Mexico, was one of the most affected. It was reported that by the end of June, two of its main water dams were at less than 10% capacity. Restrictions on water use have been in place since February 2022.
Global Precipitation Climatology Project (GPCP)
The following analysis is based upon the Global Precipitation Climatology Project (GPCP) Interim Climate Data Record. It is provided courtesy of the GPCP Principal Investigator team at the University of Maryland.
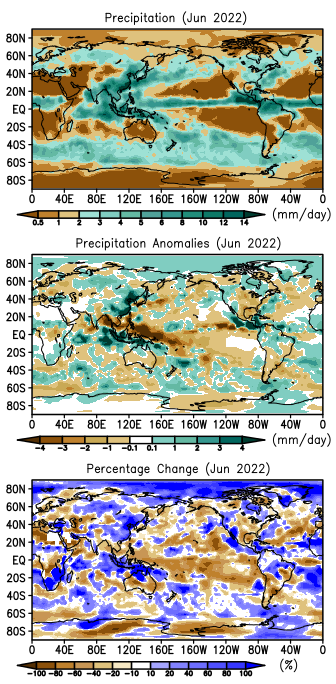
June, the Summer/Winter solstice month in the Northern/Southern Hemispheres, presents its precipitation patterns shifting seasonally northward, especially drying out Australia and dampening South Asia, with similar latitude shifts over the other continents and across the oceans. The month is also the first real month of the Northern Hemisphere tropical cyclone season. The precipitation mean pattern for June 2022 (Fig. 1, top panel) follows the general pattern of the climatology with the ocean and land Inter-Tropical Convergence Zone (ITCZ) featuring prominently along with South Asian rains and a dry Australia, along with other climatological wet and dry features. The rainiest region for this June can be detected along the ITCZ in the extreme eastern Pacific Ocean.
However, relatively subtle shifts in these monthly features produce differences from climatology as seen in the anomaly fields for this June in the bottom two panels of Fig. 1. The most striking feature in the middle panel is the drier-than-normal zone stretching from the Bay of Bengal southeastward through the Philippines into the central Pacific, along with a parallel, wetter-than-normal zone just to the southwest, extending from the Indian Ocean, across the northern tip of Australia and into the Pacific. To the north of the dry zone, another positive rain anomaly is evident over Asia. This pattern of the early Asian summer monsoon has brought relative dryness to that central strip, but with floods in southern China, northern Bangladesh and northeastern India on the northside and Indonesia on the southside. Just to the east Japan had a hot and dry June.
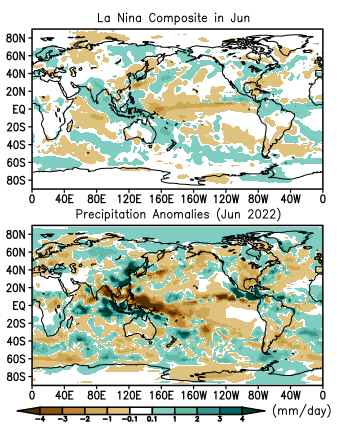
The long-term La Niña, with its below normal sea surface temperatures (SSTs) in the central/eastern Pacific along the Equator, continues this month, but in a somewhat weakened condition index-wise (Nino 3.4 Index ~0.6). Figure 2 shows the La Niña composite anomaly map for June and repeats the anomaly map for this June and shows generally negative matching anomaly patterns across the tropical Pacific, but the expected La Niña feature of generally positive anomalies over the Maritime Continent seems disrupted by this June's Asian monsoon-related features. Elsewhere the La Niña effects are mixed, although South America generally follows the expected La Niña pattern.
North America does not follow the La Niña composite but shows negative anomalies across the U.S. and Mexico east of the Rocky Mountains with a positive anomaly in the northwest U.S. and southwest Canada. Three additional features are of interest. First, at the end of May Hurricane Agatha hit southern Mexico on its southwest coast and its remnants managed to cross the Yucatan region and help initiate Tropical Storm Alex, the first named storm in the Atlantic, in early June. Alex swept across the Caribbean, western Cuba and the southern tip of Florida producing over 250 mm of rain in Havana and Miami and accompanying floods. Alex's storm track and associated rain contributed significantly to the positive anomaly features for June in Fig. 1 along that path and northeastward into the Atlantic. Other eastern Pacific tropical cyclone activity also dominates the rainfall features off the west coast of Mexico.
Second, the North American monsoon kicked in a little early this year giving northwest Mexico and most of the southwest U.S. (Arizona, New Mexico and southwest Colorado) more rain than normal for June and at least partially ameliorating the ongoing drought in the region and cutting off the early start to the wildfire season, especially in New Mexico. Third, across much of Alaska and northwest Canada drier than normal conditions and abnormally hot weather provided the backdrop for unusual wildfires in southwest Alaska.
Across Europe rainfall deficits continue to dominate and many areas are affected by drought. The Iberian Peninsula is in the middle of a long-term drought, with wildfires in Spain. Italy, especially the northern half of the country is also very dry, with significant impacts on agricultural production in the Po River valley. Eastern Europe and even Scandinavia had precipitation deficits compared to climatology. Even a dry Afghanistan had unusual wildfires in the eastern part of the country in June, in addition to a devastating earthquake.
With all the positive and negative anomalies across the globe in June and the relative weakness of La Niña (SSTs in tropical Pacific still below normal, but less so than a few months ago), the overall estimate of global precipitation for this June (2.69 mm -1) is still slightly lower than the June climatological mean (2.71 mm -1). This global negative anomaly is typical of La Niña conditions, as is the ocean/land partition of the global total, where the land anomaly is +0.15 mm d-1 and the ocean anomaly is -0.10 mm -1. Although the La Niña patterns are less distinct than stronger situations, and tend to be in this season, the globally integrated numbers still reflect a measurable effect.
Drought
Drought Information based on global drought indicators is available at the Global Drought Information System.
June 2022 was drier than normal across parts of Europe and excessively hot across all of Europe. The combination of heat and dryness resulted in short-term drought across parts of southern and eastern Europe. The dryness extended from southern and eastern areas into northern portions for the last 2 to 12 months and was reflected in precipitation-, temperature-, and evaporation-based indices. Satellite observations indicated dry soils and low groundwater across the continent, along with areas of stressed vegetation. The European Combined Drought Indicator showed drought across many parts of Europe. According to media reports, rivers and reservoirs in Italy were running dry, several regions have declared a state of emergency, and agricultural production was expected to plummet in key growing areas in the country; the European Union expected a reduced wheat crop in western Europe this year.
June was wetter than normal across a large part of Asia. Dry conditions were evident in northern and some central portions of the continent at 2- to 9-month time scales. Much warmer-than-normal temperatures increased evapotranspiration and enhanced drought conditions in some northern and southern areas, especially along the Arctic coast of Siberia. Satellite-based observations of groundwater and soil moisture showed dryness in northern areas and from central to southwest Asia. Vegetative health was poor in central to southwestern areas. According to media reports, Iraq's Lake Sawa dried up for the first time in centuries.
Southern and some northern portions of Africa were wetter than normal during June, but central Africa and other northern areas were drier than normal. Unusually warm conditions across much of the continent increased evapotranspiration and added to stress in the dry areas. Much of East Africa, the Sahel region, and the north coast were dry for the last 2 months to 3 years, with the satellite-based Vegetative Health Index (VHI) showing unhealthy vegetation. Conditions were especially acute in East Africa where evaporation was high and groundwater and soil moisture depleted. According to media reports, more than 23 million people in Ethiopia, Somalia, and Kenya were dealing with severe hunger, creating what the United Nations deemed a humanitarian emergency. At least 448 deaths have occurred this year (as of June 9) at malnutrition treatment centers in Somalia alone.
Northern portions of Australia were wetter than normal in June, while southern parts were dry. Temperatures were warmer than normal in the west and north and cooler than normal in the southeast. At longer time scales, especially the last 6 to 12 months, dry conditions were evident in the north, where low groundwater was detected by satellite (GRACE). Dry soils and stressed vegetation were detected in the southwest. The observations of dryness in the north and southwest were confirmed by the Australian Bureau of Meteorology's Combined Drought Indicator analyses.
The southern half of South America was drier than normal during June while parts of Brazil and northwest coastal areas were wetter than normal. Much of the northern half of South America was warmer than normal in June. The wet June in Brazil was not enough to overcome many months of dryness, with several drought indicators showing dryness at 2- to 12-month time scales from southeastern and central Brazil, westward to Peru, and southward through Argentina and Chile. The satellite-based indicators showed low groundwater, dry soils, and poor vegetative health in these areas. Drought in southern and eastern Brazil was confirmed on the Northeast Brazil Drought Monitor. According to media reports, Chile's Peñuelas Lake was severely depleted after 13 years of drought, causing a water shortage for farming and lithium mining, and the capital of Santiago was preparing for rationing.
June was warmer than normal across Alaska, parts of northern Canada, northern Mexico into the southwestern and southern Plains areas of the U.S., and across much of the U.S. east of the Mississippi River. The month was drier than normal across much of Alaska and the continental U.S. east of the Mississippi, and parts of northeastern Mexico and the southwestern U.S. Satellite-based indicators showed low groundwater, dry soils, and unhealthy vegetation in northern Mexico, the western United States, the southern U.S. Great Plains, and western Canada extending into Alaska. Dry conditions were indicated in parts of these areas at longer time scales, especially 1 to 3 months in Alaska and 2 to 12 months in northern Mexico and the western to central U.S. The North American Drought Monitor product depicts drought from central Mexico, across western and southern portions of the U.S., into the southern Canadian Prairies, and across parts of Alaska and northwestern Canada. According to media reports, nearly empty dams were followed by water rationing in Monterrey, Mexico.
Ocean Heat Content
Ocean Heat Content (OHC) is essential for understanding and modeling global climate since > 90% of excess heat in the Earth's system is absorbed by the ocean. Further, expansion due to increased ocean heat contributes to sea level rise. Change in OHC is calculated from the difference of observed temperature profiles from the long-term mean.
| Basin | 0-700 meters | Rank (1955-2023) | |||||
|---|---|---|---|---|---|---|
| Entire Basin | Northern Hemisphere | Southern Hemisphere | ||||
| Atlantic | 8.167 | 3rd | 4.664 | 2nd | 3.504 | 4th |
| Indian | 3.350 | 6th | 0.711 | 6th | 2.639 | 6th |
| Pacific | 7.867 | 1st | 3.806 | 1st | 4.061 | 2nd |
| World | 19.381 | 2nd | 9.178 | 1st | 10.203 | 2nd |
| Source: Basin time series of heat content | ||||||


Global OHC for April–June 2022 is the highest April–June OHC in our records, which extend back to 1955. Overall, the latest quarterly OHC reveals widespread warmer than normal conditions relative to the 1955–2006 mean, a situation observed since the end of 2016. In general, OHC features observed in April–June 2022 are very similar to those observed since October–December 2021. Cool conditions, about -10x105 J/m3, extending westward from South America to about 165W in the Equatorial Pacific Ocean continue to weaken, while cooler than normal conditions persist across the Subtropical North Pacific Ocean. Much higher, > 30x105 J/m3, than normal OHC conditions continue to exist in the Gulf of Mexico, Gulf Stream/North Atlantic Current, the North Pacific Current, and the western tropical South Pacific Ocean. Higher, > 10x105 J/m3, than normal OHC conditions dominate the Indonesian Throughflow, the South China Sea, the North Indian Ocean, along the Antarctic Circumpolar Current in the Indian Ocean and Southwestern Pacific Ocean sectors, and the Tasman Sea. Cool conditions, < -10x105 J/m3, persist in the subpolar North Atlantic Ocean south of Greenland and Iceland. Higher than normal OHC conditions in the South Atlantic Ocean extend southwestward across the Scotia Sea and around the Antarctic Peninsula.