March Temperatures
 larger image |
The graph to the left shows monthly mean temperature averaged across the contiguous United States based on long-term data from the U.S. Historical Climatology Network (USHCN). The value for 2003 is estimated from preliminary Climate Division data using the first difference approach. March 2003 ranked as the 34th warmest March in the 1895 to present record. The preliminary nationally averaged temperature was 44.0° F (6.7° C) which was 1.6° F (0.9° C) above the long-term mean. |
| Above average
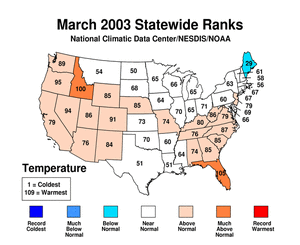
temperatures in March were present across 20 states including much
of the western U.S. and the Southeast. Much above average warmth
occurred in Idaho and Florida, where Florida experienced its 5th
warmest March on record. Below average temperatures were present in
Maine and the remaining 25 states including those in the Great
Lakes, the northern High Plains and the Deep South. As can be seen in a map of divisional temperature (below right), cooler than average temperatures also occurred in parts of Montana, North Dakota, Texas and Louisiana. In addition, the southern Florida peninsula had a record warm March. The pattern of warmth and cold in the contiguous U.S. in March broadly corresponded with the mean 500mb height and anomalies chart. This shows that above normal 500mb heights were present in the western U.S. and the Southeast. These regions experienced above average temperatures in March. It was the 43rd warmest March since reliable statewide records began in 1918 for Alaska. Anomalies of -0.4°F (-0.2°C) relative to the period 1971-2000 ranked March 2003 slightly below average. This was the first below normal March in Alaska over the last 4 years. |
 larger image  Click
here for animated image Click
here for animated image |
| Region | Rank |
|---|---|
| Northeast | 56th coldest / 54th warmest |
| East North Central | 64th coldest / 46th warmest |
| Central | 76th coldest / 34th warmest |
| Southeast | 89th coldest / 21st warmest |
| West North Central | 69th coldest / 41st warmest |
| South | 61st coldest / 49th warmest |
| Southwest | 83rd coldest / 27th warmest |
| Northwest | 97th coldest / 13th warmest |
| West | 89th coldest / 21st warmest |
Temperature Departures
| The map below, based on over 500 airport stations, shows departures from the 1971-2000 normal temperatures for March 2003. In the lower 48 states, positive departures (greater than 7.5°F [4.2°C]) occurred over much of Florida. Record warmth was present in parts of this state during the first few days of March (as can be seen in an animation of daily temperature anomalies). Significant negative departures were evident across portions of Montana and North Dakota. |
| A new maximum daily temperature record was set in Miami, FL on March 2nd when the high reached 90°F (32.2°C) breaking the old record of 87°F (30.6°C) set back in 1985. This was also the earliest ever in the calendar year that Miami reached 90°F (32.2°C). The previous earliest date was March 5th set back in 1964. Other record highs for March 2nd include West Palm Beach, FL (92°F/33.3°C) and Fort Lauderdale, FL (90°F/32.2°C). On March 3rd, Marquette, MI reported their lowest temperature ever recorded in March with -30°F (-34.4°C). The previous coldest record of -27°F (-32.8°C) occurred back on March 1, 1962. |  larger image |
| See NCDC's Monthly Extremes web-page for more records. |
January - March 2003
 larger image |
The graph to the left shows mean temperature averaged across the contiguous United States based on long-term data from the U.S. Historical Climatology Network (USHCN). The value for January-March 2003 is estimated from preliminary Climate Division data using the first difference approach. January-March 2003 was warmer than average and ranked as the 36th warmest such period in the 1895 to present record. The preliminary nationally averaged temperature for January-March was 36.7° F (2.6° C) which was 0.7° F (0.4° C) above the long-term mean. |
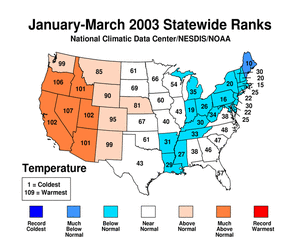
Six states averaged much warmer than the long-term mean for January-March. Nevada and Oregon were 3rd and 4th warmest on record, respectively, for the 3-month period. Warmer than average temperatures were also present along the front range of the Rockies and the Pacific Northwest. Nineteen states averaged colder than the long-term mean and Maine averaged much below normal for the January-March period. The January-March pattern is similar to the temperature pattern across the contiguous U.S. for January, with above average warmth evident in the West and below average temperatures along the Mississippi River valley, eastern Great Lakes and Northeast. |
 larger image |
National Temperatures - April 2002-March 2003
 larger image |
The graph to the left shows mean temperature averaged across the contiguous United States based on long-term data from the U.S. Historical Climatology Network (USHCN). April 2002-March 2003 ranked as the 15th warmest such period in the 1895 to present record. The preliminary nationally averaged temperature was 53.7°F (12.1°C) which was 0.9°F (0.5°C) above the long-term mean. |
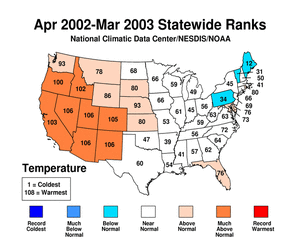
| The western half of the U.S. was generally warm over the April 2002-March 2003 period. Only 3 states (Pennsylvania, Vermont and Maine) averaged below normal. The West and Southwest regions were 2nd warmest and warmest on record, respectively for the last 12 months, with all the states in those regions ranking in the top ten such warmest periods. |  larger image |
March Precipitation
 larger image |
The graph to the left is a time series depicting precipitation averaged across the contiguous U.S. Based upon preliminary precipitation data, March 2003 was near average, ranking 51st driest. |
| Nine states from the
Gulf Coast to the Great Lakes averaged drier than the 109-year mean
for March 2003, with 4 additional states (Arkansas, Tennessee,
Kentucky and West Virginia) ranking much below average. Fourteen
states from the Pacific Northwest and along the front range of the
Rockies as well as in the Southeast ranked above average. Three
states (Washington, Colorado and South Carolina) were much above
average in March, where Washington
had its 2nd wettest such month in the last 109 years. Snow and
rainfall in March helped to bring short-term drought relief to
parts of the western U.S. which
has been suffering from drought conditions for several years. For
more details on drought across the country, please click on the
U.S. drought page. |
 larger
image larger
image |
| Significant snowfall in mid-March primarily
occurred in and around the Denver, CO area. More than 7 feet of
snow fell in some locations. More details of snowfall in March and
the season so far can be found on the snow season page. |
| Region | Rank |
|---|---|
| Northeast | 50th driest/ 60th wettest |
| East North Central | 41st driest/ 69th wettest |
| Central | 12th driest/ 98th wettest |
| Southeast | 85th driest/ 25th wettest |
| West North Central | 81st driest/ 29th wettest |
| South | 24th driest/ 86th wettest |
| Southwest | 81st driest/ 29th wettest |
| Northwest | 102nd driest/ 8th wettest |
| West | 47th driest/ 63rd wettest |
 larger image |
The graph to the left is a time series depicting precipitation for March 2003 averaged across the Primary Corn and Soybean Belt. The growing season runs from March to September for corn and soybeans and preliminary data indicate that precipitation was below average for the growing season as of the end of March 2003. Precipitation averaged across this region was about 1 inch below the long-term mean in March. Much of this region had below average precipitation over the last 6 months making for a slow start to the growing season. |
Precipitation Departures
| The map below, based on more than 500 airport stations, shows March 2003 total precipitation as a percent of the 1971-2000 station normals. Above normal precipitation was generally confined to the Pacific Northwest and the Southeast. Much of the remainder of the contiguous U.S. was drier than normal. |
| Some of the
precipitation which fell in March was in the form of snow. Click to
the snow page for
more details on March and the season-to-date. A snow storm in the central Rockies in mid-March produced upwards of 7 feet of snow in some mountain locations west of Denver,CO. The totals in some of the more familiar cities include: Boulder, CO with 51 inches (130 cm), Golden, CO with 50.5 inches (128 cm), Fort Collins, CO areas with 25 to 35 inches (64 to 89 cm) and Cheyenne, WY with over 18 inches (46 cm). Denver set a record for the snowiest March on record with a total of 35.2 inches (89 cm) of snow. It should be noted that this also ranks as the 3rd snowiest month on record (57.4 inches [146 cm] fell in December 1913 and 42.6 inches [108 cm] in November 1946). For more records during March 2003, see NCDC's Extremes Page. |
 larger image |
January-March 2003
 larger image |
The graph to the left
is a time series depicting precipitation averaged across the
contiguous U.S. Based upon preliminary precipitation data, January
-March 2003 was drier than average, ranking 26th driest in the last
109 years. This was the 4th consecutive January-March period with
below average precipitation, nationally. |
 larger
image larger
image |
January-March 2003 was among the top 10 driest January-March periods on record in 4 states in the Great Lakes region. Minnesota and Iowa each had their 5th driest January-March period in the past 109 years. Below average precipitation during January-March 2003 occurred in 17 states, primarily in the South, the Great Lakes region and in New England. Above average precipitation occurred in 11 states including some in the Mid-Atlantic region and the western U.S. January-March precipitation brought short-term relief to parts of the West that were experiencing long-term drought conditions. |
National Precipitation - April 2002-March 2003
 larger image |
The graph to the left is a time series depicting precipitation averaged across the contiguous U.S. Based upon preliminary precipitation data, April 2002-March 2003 was near average, ranking 46th driest in the last 108 such periods. The last 4 April-March periods have averaged below the long term mean. |
| The pattern of state-averaged April 2002-March 2003 precipitation can be seen in the map to the right. Nebraska reported its 6th driest April-March on record. Fifteen states, primarily from the West Coast to the central Plains, were below normal. Seventeen states extending from the Gulf Coast up through parts of New England were above average for April 2002-March 2003 and Delaware ranked 8th wettest. More information on drought analysis for these states and others can be found on NCDC's Drought Pages. |  larger image |
| As a result of wet conditions in March and the wetter than average fall, the residual dryness in the Carolinas has finally abated. Most of the Gulf Coast states were wetter than average in part due to the moisture associated with tropical systems during the summer and fall of 2002. |
 NOAA's National Centers for Environmental Information