Climate Extremes Index | Tornadoes | Tropical Cyclones | Snow
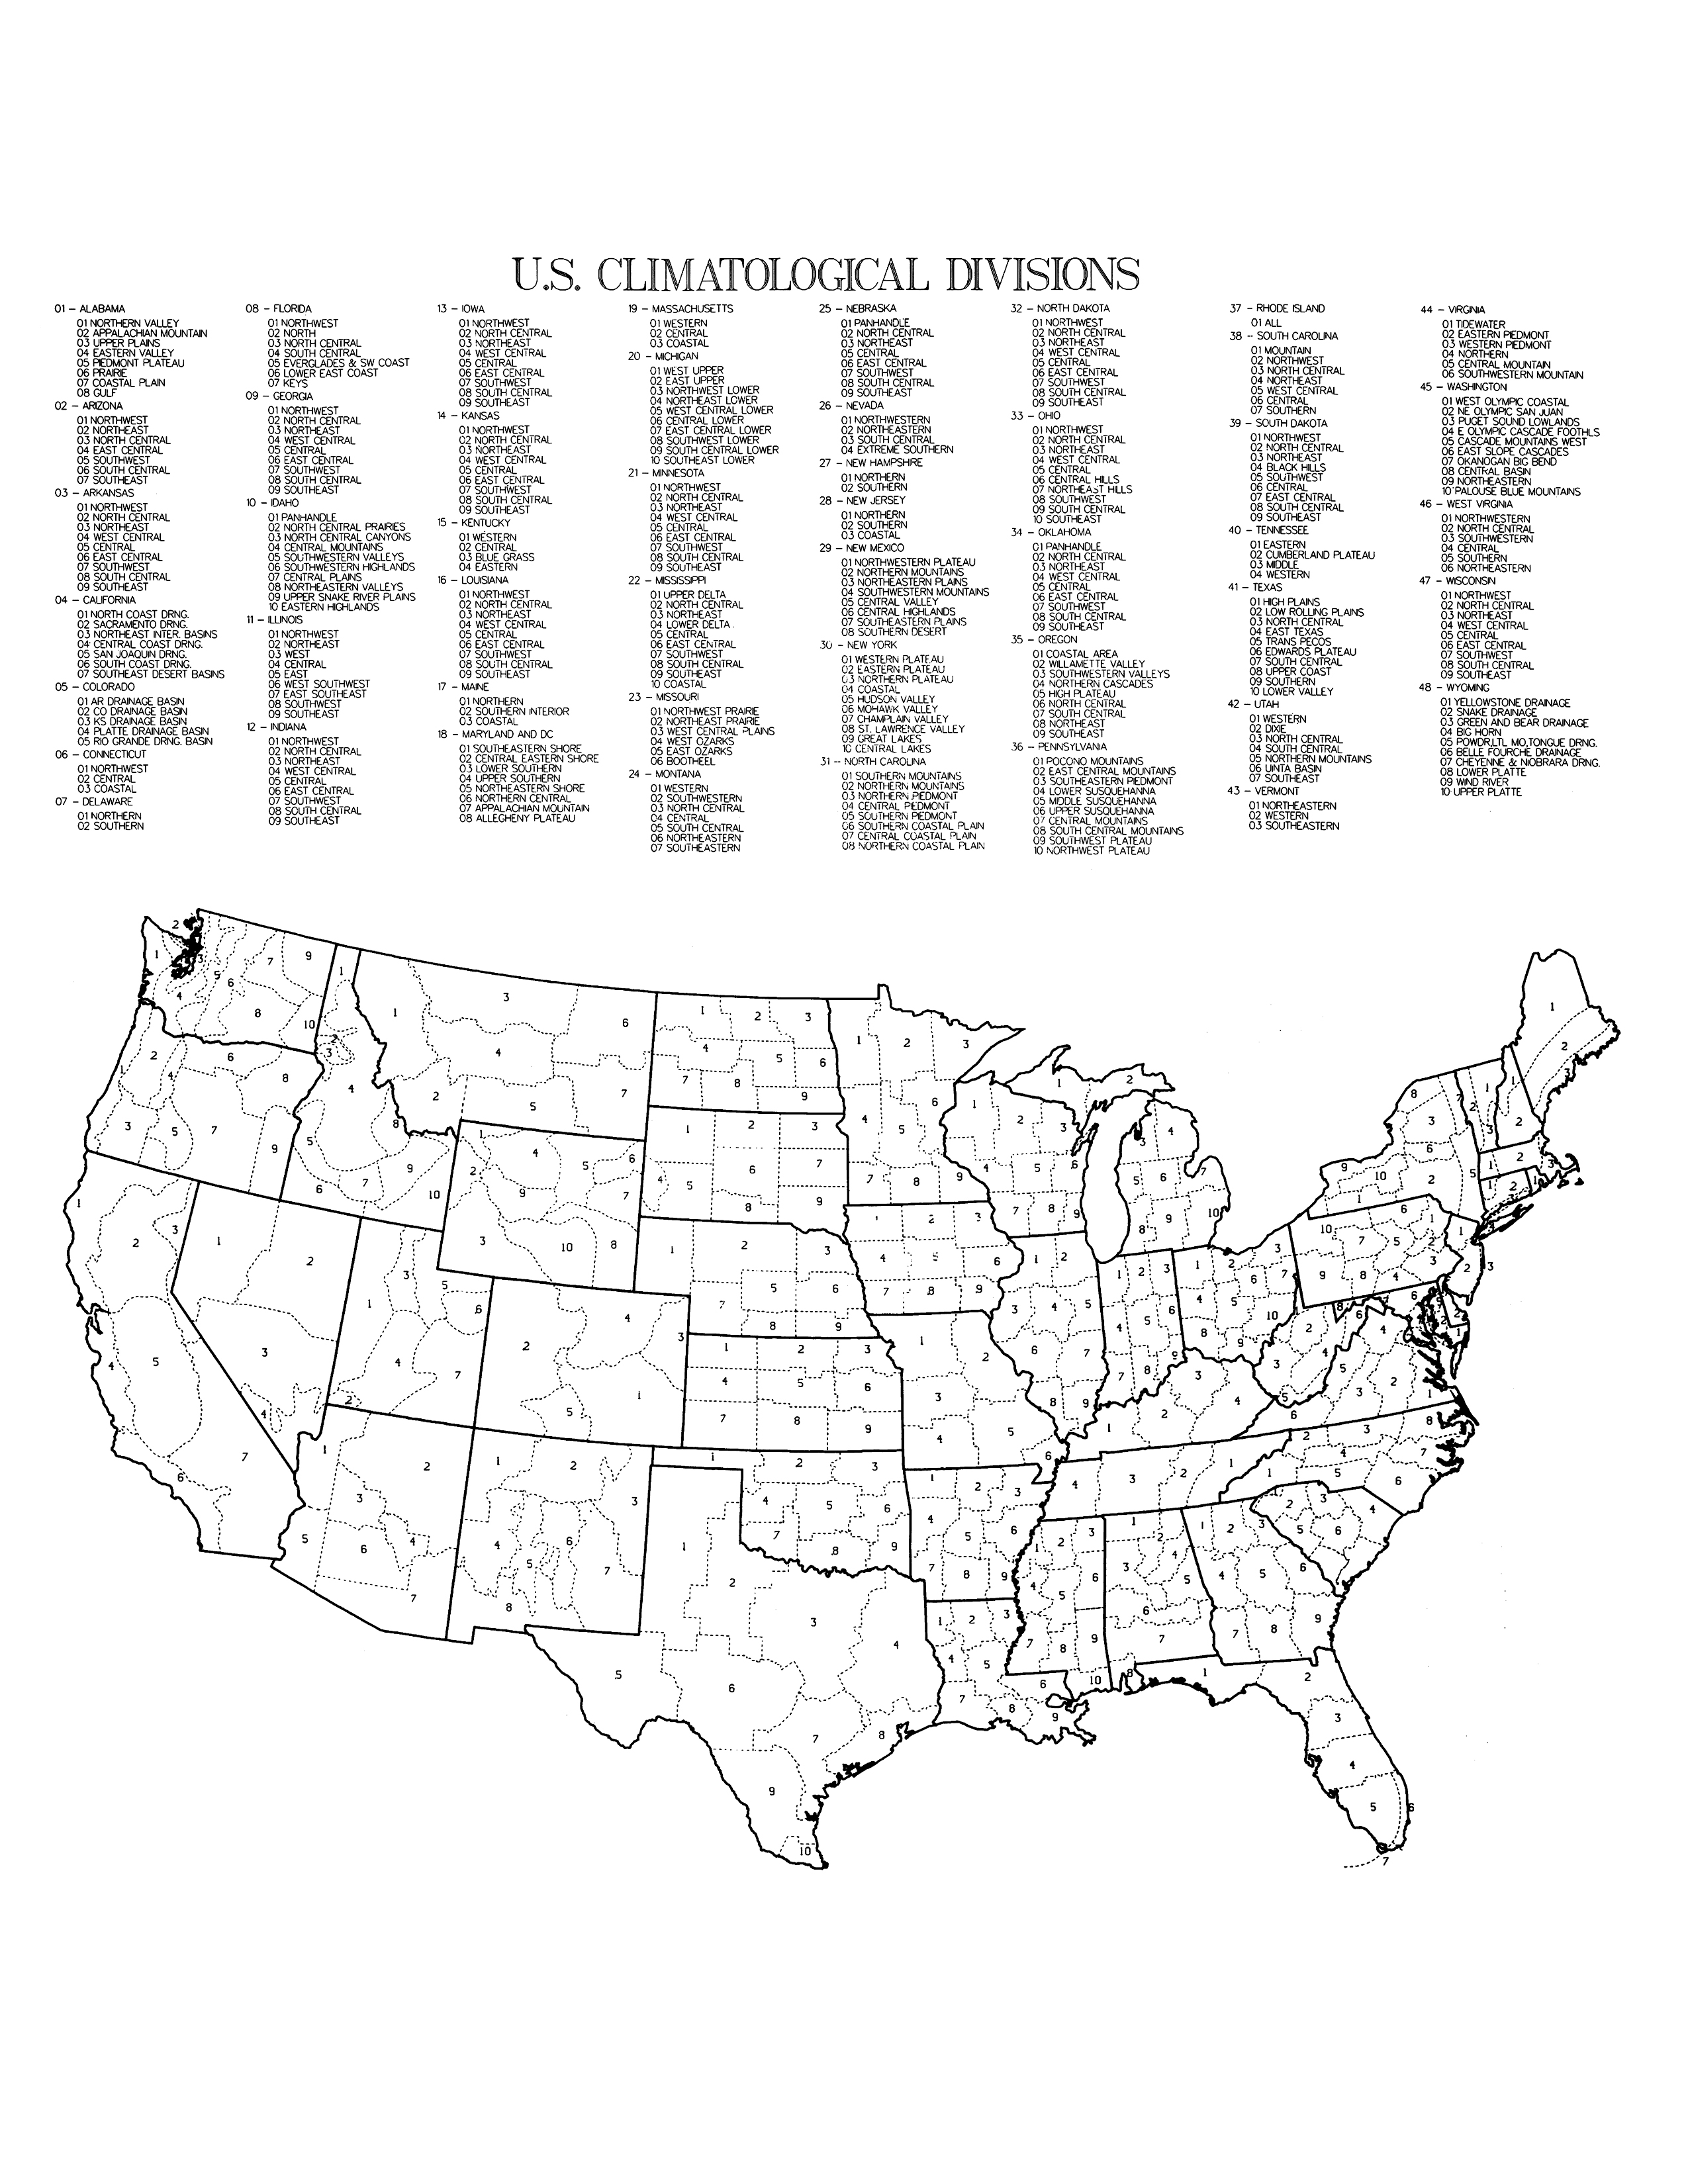
Map of U.S. Climate Regions | Map of U.S. Climate Divisions
Regional Highlights
2017 National Events Map
Click for more information
Issued January 12 2018: Unless otherwise noted, temperature and precipitation rankings refer to a 123-year period of record (1895-2017), and long-term average refers to the 20th century (1901-2000) value. Data for 2017 should be considered preliminary. The most up-to-date temperature and precipitation data is available through Climate at a Glance.
Supplemental 2017 Information
National Temperature and Precipitation Analysis

Based on preliminary analysis, the average annual temperature for the contiguous U.S. was 54.6°F, 2.6°F above the 20th century average. This was the third warmest year since record keeping began in 1895, behind 2012 (55.3°F) and 2016 (54.9°F), and the 21st consecutive warmer-than-average year for the U.S. (1997 through 2017). The five warmest years on record for the contiguous U.S. have all occurred since 2006. Since 1895, the CONUS has observed an average temperature increase of 1.5°F per century. Nationally, the average minimum (low) temperature was 42.8°F, the fourth warmest on record, while the average maximum (high) temperature was 66.4°F, the fifth warmest on record.
For the third consecutive year, every state across the contiguous U.S. and Alaska had an above-average annual temperature. Despite cold seasons in various regions throughout the year, above-average temperatures, often record breaking, during other parts of the year more than offset any seasonal cool conditions. Five states – Arizona, Georgia, New Mexico, North Carolina and South Carolina – had their warmest year on record. Thirty-two additional states, including Alaska, had annual temperatures that ranked among the 10 warmest on record.
The contiguous U.S. average annual precipitation was 32.21 inches, which is 2.27 inches above the long-term average. This made 2017 the 20th wettest year on record for the nation, and the fifth consecutive year with above-average precipitation. Since 1895, precipitation across the CONUS has increased at an average rate of 1.67 inches per century.
Above-average precipitation was observed across the nation with much-wetter-than-average conditions across parts of the West and the Great Lakes region. Michigan had its wettest year on record with 39.23 inches of precipitation, 8.10 inches above average. Below-average precipitation was observed in parts of the Southwest, Northern Rockies and Northern Plains.
Several large-scale flooding events impacted the nation during 2017 including the record-shattering rainfall across Texas and Louisiana associated with Category 4 Hurricane Harvey – the first major hurricane to make landfall in the U.S. since in 2005. Rainfall totals exceeded 60 inches in parts of Texas with devastating floods across the Houston metro area. Another heavy rain event impacted the Mid-Mississippi Valley in April and May. Numerous tributaries of the Mississippi River had record high crests, breaching levees with widespread damage to homes, businesses, infrastructure and agriculture.
Drought conditions changed dramatically throughout 2017. According to the U.S. Drought Monitor, the year began and ended with about one-quarter of the contiguous U.S. in drought. The drought footprint reached a low of 4.5 percent in late May, the smallest drought footprint in the 18-year period of record for the U.S. Drought Monitor.
- Heavy precipitation during the winter season caused significant flooding and record high snowpack across the West and helped to end a multiyear drought impacting California and Nevada. However, the wet winter allowed vegetation to flourish creating an abundance of fuels for wildfires during the subsequent dry season.
- A dry spring and summer set the stage for a rapidly expanding and intensifying drought in the Northern Plains, causing widespread agricultural impacts with total losses exceeding $1 billion.
- Lingering drought from 2016 in the Southeast persisted into early 2017, but beneficial precipitation helped eliminate drought conditions by summer. Dryness returned to the South in late 2017 with drought developing and expanding – especially in the Southwest, Southern Plains, Lower Mississippi Valley and Southeast.
- The average winter temperature for the Lower 48 was 35.9°F, 3.7°F above the 20th century average. This was the seventh warmest winter on record for the CONUS. Thirty-five states across the contiguous U.S. had a winter temperature that was much above average. Texas and Louisiana had their warmest winter on record.
- The December-February average temperature is rising at a rate of 2.2°F per century since records began in 1895.
- It was the ninth wettest winter for the CONUS and the wettest since 1997/98. Twelve states across the West, Northern Plains and Midwest had winter precipitation totals that were much above average. Nevada and Wyoming were record wet. California had its second wettest winter helping alleviate a multi-year drought.
- Alaska had a near-average December-February temperature and was slightly drier than average.
- Hawaii had a dry winter with nearly all locations across the islands observing below-average precipitation. Parts of the Big Island received above-average precipitation. By the end of February about seven percent of the state was in moderate drought.
- There were three weather and climate disaster during winter that had losses exceeding $1 billion — a January severe weather outbreak in the South, a severe weather outbreak in the central U.S. and Southeast and a flooding event in California.
- The average spring temperature for the Lower 48 was 53.5°F, 2.6°F above the 20th century average. This was the eighth warmest spring on record for the CONUS. Above-average temperatures spanned most of the nation with 20 states much warmer than average. No state was record warm or record cold.
- The March-May average temperature is rising at a rate of 1.5°F per century since records began in 1895.
- It was the 10th wettest spring for the CONUS and the wettest since 2011. Three states in the Northwest and twelve states across the Central Plains, Midwest and along the East Coast were much wetter than average. Parts of the Northern Plains, Southwest and Southeast were drier than average. Alaska had its 10th driest March-May on record.
- By the end of May, drought had started to develop in the Northern Plains. Extreme drought was also observed in Florida, where numerous wildfires burned.
- There were six weather and climate disaster during spring that caused losses exceeding $1 billion — three individual severe weather outbreaks, a freeze events in the Southeast, significant flooding in Missouri and Arkansas and the start of a significant drought in the Northern Plains.
- The average summer temperature for the CONUS was 72.7°F, 1.3°F above the 20th century average. This was the 15th warmest summer on record for the CONUS, but the coolest since 2014. Much of the West was warmer than average with California and Nevada each having their warmest summer on record. Parts of the East Coast were also warmer than average.
- Near- to below-average temperatures were observed across large parts of the central U.S. to Gulf Coast.
- The June-August average temperature is rising at a rate of 1.5°F per century since records began in 1895.
- It was the 13th wettest summer for the CONUS. Above-average precipitation accumulated along the Gulf Coast, Midwest, and Northeast. Louisiana and Mississippi were record wet. Below-average precipitation fell in the Northwest, Northern Rockies, and parts of the Northern Plains and Midwest.
- Hurricane Harvey made landfall in Texas in late August causing record breaking flooding and over $100 billion in damages. Harvey was the second costliest weather and climate disaster on record to impact the United States.
- There were five weather and climate disaster during summer that caused losses exceeding $1 billion — three individual severe weather outbreaks, the start of the wildfire season in the West and Hurricane Harvey.
- The average autumn temperature for the CONUS was 55.7°F, 2.1°F above the 20th century average. This was the 10th warmest autumn on record for the CONUS, but the coolest since 2014. It was also the 11th consecutive autumn with temperatures above average for the CONUS.
- The majority of the nation was warmer than average with near-average conditions in the Northern Rockies and Plains. In the Southwest, Arizona and New Mexico were record warm while in the Northeast, Connecticut, Massachusetts, Maine and New Hampshire were record warm.
- The September-November average temperature is rising at a rate of 1.2°F per century since records began in 1895.
- It was a drier than average autumn for the CONUS. Above-average precipitation was observed in parts of the Northwest, Great Plains, Midwest and in Florida and Maine. Below-average precipitation was observed in the Southwest, Southern Plains, Lower Mississippi Valley and Mid-Atlantic. Arkansas had it driest autumn on record. Drought conditions developed rapidly across a large portion of the southern U.S..
- Hurricane Irma made landfall in Florida in September bringing heavy rain to Florida and storm surge to both the Gulf Coast and Atlantic Coast of the state northward into the Carolinas.
- There were two weather and climate disaster during autumn that caused losses exceeding $1 billion — Hurricanes Irma and Maria.
Seasonal Summaries
Winter (December 2016 through February 2017)

In brief:
Discussion:
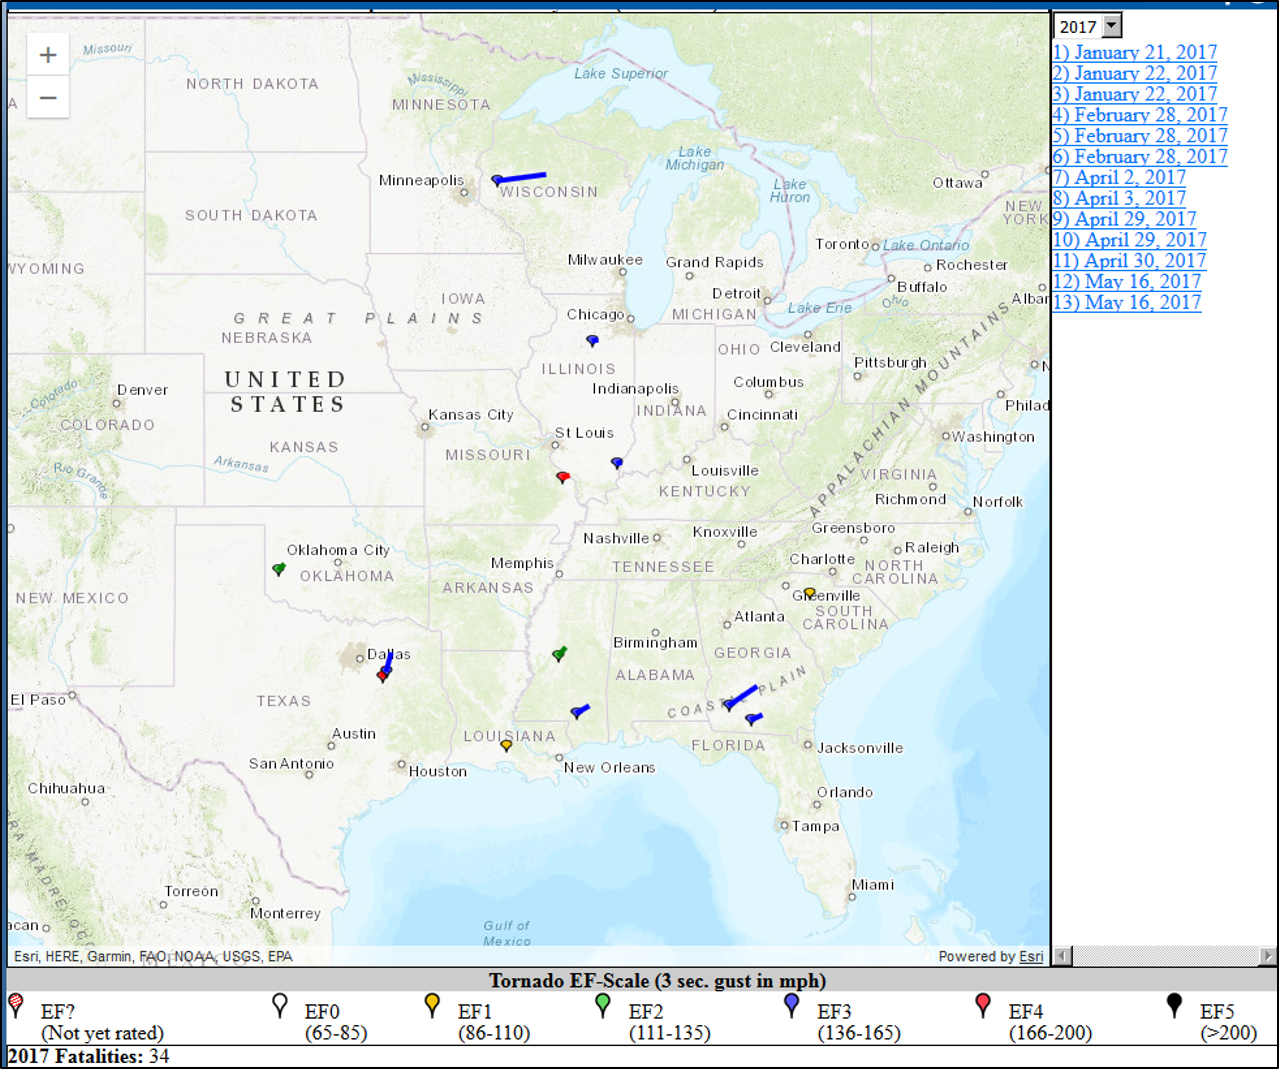
The January temperature was 33.6°F, 3.5°F above average. This marked the 18th warmest January on record and the warmest since 2012. Above-average temperatures were observed for most locations from the Great Plains to East Coast with much-above-average conditions in the South, Midwest and Northeast. Below-average temperatures persisted in the Northwest and Northern Rockies that began in late 2016. January was much wetter than average with a precipitation total of 3.22 inches, 0.91 inch above-average. This was the seventh wettest January on record and wettest since 1998. Above-average precipitation was widespread with 12 states across the West, Rockies, Central Plains, Southeast and Midwest being much wetter than average. Below-average precipitation accumulated in the Northwest and Northern Rockies. During January, drought improved by several categories across California and Nevada where a series of Pacific storms dumped significant amounts rain and snow. According to the USDA, as of February 1, mountain locations across California, Nevada, Oregon, Utah, Arizona and Colorado had snowpack totals more than 180 percent of normal. Despite the heavy precipitation, multi-year precipitation deficits persisted. Drought also improved across parts of the Southern Plains, Southeast and Northeast. For the first time since March 2011, no location in the country was experiencing Exceptional Drought (D4), the worst category. On the other side of the country, a strong storm system swept through the Southeast during January 20-22, spawning tornadoes from Texas to South Carolina. There were over 80 preliminary tornado reports. Southern Georgia and Mississippi were the hardest hit areas with over 20 tornado-related fatalities. The deadliest single tornado from the event (and for the entire year) was an EF-3 that tracked 24 miles across southern Georgia, killing 11 people. Most locations across Hawaii were drier than average in January with abnormally dry conditions expanding to 55 percent of the state. Lihue, on Kauai, had its driest January on record with 0.20 inch of rain, only 5 percent of average. Reliable records in Lihue date back to 1905.
February was exceptionally warm for the contiguous United States. The national temperature value was 41.2°F, 7.3°F above the 20th century average. This was the second warmest February on record, only slightly cooler than February 1954. A notable number of station-level temperature records were broken during February, including numerous cities setting warm daily and monthly temperature records. There were 11,743 daily warm temperature records broken or tied (6,309 warm maximum temperatures and 5,434 warm minimum temperatures), compared to 418 daily cold records (290 cold maximum temperatures and 128 cold minimum temperatures). Of those, 1,151 daily records (709 warm maximum temperatures and 442 warm minimum temperatures) also broke the warmest temperature record ever observed during February, compared to just 2 cold records (one cold maximum temperature and one cold minimum temperature). Forty one-states had much-above-average temperatures, seventeen of which were record warm. Only parts of the Pacific Northwest was not warmer than average. The February contiguous U.S. precipitation total was 2.24”, 0.11 inch above average, ranking near the median value. Above-average precipitation across the West offset below-average precipitation in the Midwest and along the East Coast. Most of the western United States was wetter than average, with heavy precipitation causing widespread flooding and mudslides in California and Nevada forcing area residents to evacuate impacted areas. Above-average snowpack was observed for most mountain locations in the West at the end of the month, with record snowpack in parts of the Central Rockies and Sierra Nevada Mountains. Below-average precipitation was observed in the Midwest stretching into the Southeast and coastal Northeast, where 10 states were much drier than average. The above-average temperatures and below-average precipitation were accompanied by a marked lack of snow for many locations in the East.
Spring


In brief:
Discussion
The March contiguous U.S. average temperature was 46.1°F, 4.6°F above the 20th century average and the ninth warmest on record. Much-warmer-than-average conditions stretched across the Southwest into the Central Rockies and Great Plains. Colorado and New Mexico were record warm. Below-average temperatures were observed in the Northeast. The cool March following the record breaking warm February in the East caused several impacts including contributing to a devastating freeze in the Southeast, after many crops bloomed early due to the February warmth. In the Northeast, some locations had a March temperature cooler than the February temperature — an unusual, but not unprecedented occurrence. The Alaska statewide average temperature was 4.1°F, 6.7°F below average. This was the 12th coldest March in the 93-year record for the state and coldest since 2007. This ended Alaska's stretch of 17 consecutive months, beginning in October 2015, of an above-average statewide temperature. The March precipitation total was 2.58 inches, 0.07 inch above the 20th century average, and ranked near the middle of the 123-year period of record. The Northwest, Northern Rockies, and parts of the Plains and Midwest were wetter than average while parts of the Northern and Southern Plains and Southeast were drier than average. In the South, warm, windy and relatively dry conditions increased wildfire danger, with 2 million acres burning during the month. This was nearly seven times the 2000-2010 average and more than 600,000 acres above the previous record set in 2006. Alaska had its fifth driest March on record. The above-average precipitation in the Plains and Midwest was accompanied by severe weather outbreaks including damaging tornadoes. Abundant snowfall earlier in the season from California to the Central Rockies, combined with above-average March precipitation across the Northwest and Northern Rockies, resulted in above-average snowpack at most mountain locations on April 1st.
The average temperature for the contiguous U.S. was 53.8°F, 2.7°F above the 20th century average during the month of April. This was the 11th warmest April on record for the Lower 48 and warmest April since 2012. Record and near-record warmth was observed along the East Coast and into the Midwest with near-average conditions in the Northwest. Alaska had its sixth warmest April on record. The April precipitation total was 3.49 inches, 0.97 inch above the 20th century average, making it the second wettest April in the 123-year period of record. Much-above-average precipitation was observed in the Northwest, Central Plains, Midwest, and along parts of the East Coast. A significant flooding event impacted Missouri and Arkansas in late April extending into early May. Missouri had its wettest April on record. During April there were over 200 preliminary tornado reports. Large tornado outbreaks impacted the central and southern U.S. in early and late April resulting in eight tornado-related fatalities in Louisiana, South Carolina and Texas. Alaska had its second driest ton April. April is climatologically the driest month of the year for Alaska.
The May average temperature was 60.6°F, 0.4°F above average, ranking near the median value. Above-average temperatures were observed along the West Coast and into the Great Basin and Northern Rockies as well as along the coastal Southeast. Below-average temperatures were observed in parts of the Great Plains, Upper Midwest, and Lower-Mississippi Valley. No state had a record warm or record cold May temperature. The May precipitation total for the Lower 48 was 3.36 inches, 0.45 inch above average and the 20th wettest May on record. Above-average precipitation fell across most of the East and parts of the Rockies and Great Plains. Areas along the East and Gulf Coasts were particularly wet, with 14 states much wetter than average. Below-average precipitation was observed in the West, Northern Plains and Rockies, southern Florida and the Southern Plains.
Summer
In brief:
Discussion
The June nationally-averaged temperature was 70.3°F, 1.9°F above average and tied 1977 as the 20th warmest on record. Above-average temperatures were present for locations from the West Coast through the Great Plains and along parts of the East Coast. Five states in the Southwest were much warmer than average, in addition to Delaware on the East Coast. Maximum temperatures along the Gulf Coast were particularly cool where Alabama, Georgia, Louisiana and Mississippi had monthly maximum temperatures that ranked among the 10 lowest on record. Conversely, Arizona observed record warm maximum temperatures. The June precipitation total was slightly above average, and ranked near the median value. Many locations across the East, particularly the Gulf Coast, Midwest, and Northeast observed wetter than average conditions. Parts of the Great Plains and Mid-Atlantic were drier than average. The above-average precipitation along the Gulf Coast helped to suppress daytime temperatures. Three severe weather outbreaks impacted the central U.S. during June causing damages exceeding $1 billion each.
The July nationally-averaged temperature was 2.1°F above average and was the 10th warmest on record. Much-above average temperatures were observed across the West and along parts of the East Coast. Parts of the central U.S. and Northeast had near to below- average temperatures, with maximum temperatures being particularly cool across the Great Lakes and Northeast. Alaska was particularly warm in July with a statewide average temperature of 56.2°F, 3.5°F above average and the third warmest July on record. The July CONUS precipitation total was near average, masking some regional extremes. The Northwest and Northern Rockies to Plains were much drier than average with much-above-average precipitation in the Southwest, Midwest and Mid-Atlantic.
The August CONUS temperature was slightly below average, once again masking regional extremes. The below-average temperature in August ended a record-long streak of above-average temperatures for the nation that began in March 2015. Record warmth was observed along the West Coast with California, Oregon, and Washington being record warm. Much-below-average temperatures were observed in the Central U.S. with six states in the Plains and Midwest having a top 10 cold August. Daytime maximum temperatures were much below average for a large portion of the central U.S. with eight states having a top 10 cold August maximum temperature. Louisiana had its second coolest August maximum temperature on record. The nationally-average precipitation total was 3.41 inches, 0.79 inches above average, the fifth wettest August on record. Texas was record wet, mostly due to powerful and slow-moving Hurricane Harvey and its remnants. Precipitation across the state averaged 7.01inches, 4.70 inches above average. Louisiana averaged 12.94 inches, 8.30 inches above average, tying its record wettest August on record that occurred in 2016, which also saw widespread very heavy rainfall and flooding. Locally in areas of Texas and Louisiana, precipitation amounts were historic due to Hurricane Harvey. At least 22 stations reported more than 500 percent of normal, or five times their normal rainfall for August. Monthly totals in excess of 60 inches were recorded by local observers in far southeastern Texas. Above-average precipitation was also observed in parts of the Central Plains and Upper Midwest with continued below-average precipitation in the Northwest.
Autumn

In brief:
Discussion
The September average temperature for the CONUS was 66.3°F, 1.4°F above average and ranked in the warmest third of the historical record. Much-above-average temperatures were observed in the Northeast and Great Lakes with the rest of the country experiencing near to slightly above average monthly temperatures. The temperature pattern across the contiguous U.S. shifted dramatically in mid-September. Early in the month, record and near-record warmth spanned the West with below-average conditions across the East. For the last two weeks of September, record or near-record warmth was observed in the East with below-average temperatures in the West. During September, the Alaska statewide average temperature was 42.8°F, 2.2°F above average. North-central and southeastern Alaska were much warmer than average. The temperature in McGrath did not drop below the freezing mark until September 29, the latest such occurrence on record. The precipitation total for the CONUS was 0.22 inch below average, ranking in the driest third of the historical record. Above-average precipitation fell across the Rockies, Great Plains, and Southeast. Below-average precipitation fell across the Midwest, Northeast and the Lower to Mid-Mississippi Valley where five states were much drier than average. Louisiana had its driest September on record, on the heels of the state’s wettest August on record. Drought conditions began developing across the Lower Mississippi Valley and Southern Plains late in the month, especially in the locations that missed out on the heavy rains from Harvey. September was an extremely active hurricane month for the North Atlantic Basin with five hurricanes — four of which were major hurricanes. One measure of tropical cyclone activity—the Accumulated Cyclone Energy (ACE) index, which takes into account the combined strength and duration of tropical cyclones — was record high in the North Atlantic during September. Hurricane Irma devastated parts of Puerto Rico, the U.S. Virgin Islands and Florida. Then Hurricane Maria delivered a second punch, causing unprecedented impacts on Puerto Rico and the U.S. Virgin Islands.
The nationally-averaged October temperature was 55.7°F, 1.6°F above average and the 21st warmest on record. Much-above-average temperatures were observed in parts of the Southwest and were widespread in the Midwest and Northeast. The six New England states each had their warmest October on record. Below-average temperatures were observed in the Northwest. The October precipitation total as 2.60 inches, 0.44 inch above average and ranked in the wettest third of the record. Above-average precipitation fell for most locations East of the Mississippi River and in the Northwest and Central Plains. Michigan had its wettest October on record with 246 percent of average precipitation. Below-average precipitation fell in the Southwest and parts of the Northern and Southern Plains. Drought conditions expanded and intensified in parts of the Southwest, Southern Plains, Lower Mississippi Valley and Southeast. Outside of the contiguous U.S., drought conditions improved across parts of Hawaii.
November was the eighth warmest for the CONUS with an average temperature of 45.0°F, 3.3°F above average. Much of the warmth during the month was across the West and Southern Plains. Arizona, Colorado, New Mexico and Utah were each record warm. Arizona surpassed its previous record by more 2.0°F. Near-average temperatures were observed across much of the northern U.S. and along much of the East Coast. Much-above-average temperatures were observed along the western and northern coasts of Alaska where Arctic sea ice extent offshore was record and near-record low for the month. Barrow had its warmest November on record with a temperature of 17.2°F, 16.4°F above the 1981-2010 normal, and 1.9°F warmer than the previous record in 1950. The monthly precipitation total was 1.62 inches, 0.61 inch below average and ranked as the 21st driest on record. Below-average precipitation accumulated for most locations from the Southwest into the Great Plains, Southeast and along the East Coast. Record low precipitation totals were reported in parts of the Southwest and Deep South, with five states having the tenth driest, or drier, November on record. Mississippi ranked third driest, Alabama and Arkansas fourth driest, Oklahoma fifth driest, and Louisiana tenth driest. Little Rock, Arkansas, had its driest November on record with only 0.41 inch of rainfall. Above-average precipitation was observed in the Northwest, Northern Rockies and parts of the Midwest. Ohio had its ninth wettest November on record.
For information on December, please see our December 2017 report.
Alaska Annual Summary

The average statewide temperature for Alaska during 2017 was 29.4°F, 3.4°F above average, and the seventh warmest year of an Alaska statewide record that dates to 1925. This was also the coolest year for the state since 2013 and the fifth consecutive warmer than average year. Most locations across western and northern Alaska had annual temperatures that were much-above-average with isolated locations experiencing record warmth for the year. Near- to above-average temperatures were observed across southern Alaska. The Alaska annual temperature is increasing at an average rate of 2.8°F per century.
At the seasonal level, the average winter (December 2016-February 2017) temperature was 5.8°F, which was 2.2°F above average and ranked near the median value. Locations in northern Alaska were much above average with near-average conditions for the rest of the state. Springtime temperatures also ranked near the median value as the statewide average of 25.0°F was 1.0°F above average. March was cooler than average for Alaska and marked the first month since September 2015 that the statewide average temperature was below average. Northern and western Alaska were warmer with average with central Alaska cooler than average. Summer ranked as the 10th warmest on record for the state with an average temperature of 52.7°F, 2.2°F above average. Above-average temperatures spanned much of the state with near and below-average conditions in the panhandle. The autumn statewide temperature was 29.5°F, 3.6°F average and the 12th warmest on record. Again, much of western and northern Alaska were warmer than average. A late arrival of sea ice to the northern coasts contributed to the above-average temperatures. The panhandle was cooler than average during autumn. Alaska had its warmest December on record with a statewide average temperature of 19.4°F, 15.7°F above the 20th century average and 2.1°F warmer than the previous record set in 1985. Numerous locations across northern and western Alaska including Barrow, McGrath, and Bettles were all record warm.
Winter was drier than average for Alaska with 90 percent of average seasonal precipitation. Central and southern parts of Alaska were drier than average with above-average precipitation in locations near the Canadian border. At the end of winter, southern areas of Alaska had near- to below-average snowpack with higher totals across interior parts of the state. The spring precipitation total ranked as the tenth lowest value on record at 77 percent of average. Individually, March was the fifth driest and April was the second driest. Precipitation returned in May, which was the ninth wettest. Much of southern Alaska was drier than average. The summer precipitation total ranked as the 20th highest with 115 percent of average precipitation. Most of Alaska had near- to above-average precipitation with record precipitation across parts of the panhandle. The autumn precipitation total was near average. Much of northern and western Alaska was much wetter than average, while the Alaskan panhandle was much drier than average. December was slightly wetter than average for Alaska.
Very Warm/Cold and Wet/Dry Percentages
One way to assess the magnitude of warm/cold and wet/dry episodes is to compute the percent area of the contiguous United States that was "very warm/very cold" and that was "very wet/very dry". The figures above depict these values for each month in the past 30 years. These percentages are computed based on the climate division data set. Those climate divisions having a monthly average temperature/precipitation in the top ten percent (> 90th percentile) of their historical distribution are considered "very warm/very wet" and those in the bottom ten percent (< 10th percentile) are "very cold/very dry". The "very warm" categories translate to the "much above average" while the "very cold" categories translate to the "much below average" in terms of the NCDC ranking methods. This is similar for the "very wet" and "very dry" categories and the NCDC ranking methods of precipitation totals.
The table below shows the percent area of the nation "very warm" and "very cold" for each month of 2017.
| Month | Percent area of CONUS "very warm" | Percent area of CONUS "very cold" |
|---|---|---|
| January | 31.0 | 0.0 |
| February | 67.7 | 0.0 |
| March | 51.7 | 0.0 |
| April | 31.8 | 0.0 |
| May | 2.7 | 0.0 |
| June | 21.2 | 0.0 |
| July | 38.8 | 0.0 |
| August | 19.8 | 17.4 |
| September | 14.2 | 0.0 |
| October | 16.7 | 0.3 |
| November | 36.9 | 0.0 |
| December | 15.3 | 0.0 |
The table below shows the percent area of the nation "very wet" and "very dry" for each month of 2017.
| Month | Percent area of CONUS "very wet" | Percent area of CONUS "very dry" |
|---|---|---|
| January | 35.9 | 0.1 |
| February | 14.3 | 11.8 |
| March | 10.9 | 6.8 |
| April | 26.1 | 1.2 |
| May | 11.4 | 1.8 |
| June | 8.9 | 16.3 |
| July | 10.3 | 12.9 |
| August | 19.4 | 5.6 |
| September | 9.6 | 11.4 |
| October | 15.9 | 11.0 |
| November | 2.3 | 25.8 |
| December | 1.3 | 30.1 |
Climate Extremes Index

The U.S. Climate Extremes Index (USCEI) for 2017, when taking into account land-falling tropical cyclones was more than double the average, and ranked as the second highest annual USCEI in the 108-year record. Only the USCEI in 2012 was higher. When excluding the tropical cyclone component, the USCEI was slightly lower and ranked as the fifth highest on record. On the national scale, extremes in warm maximum (fifth highest) and minimum temperatures (third highest), one-day precipitation totals (second highest), days with precipitation (25th highest) and landfalling tropical cyclones (seventh highest) contributed to the elevated USCEI. Note, each of these components only look at the contiguous United States. Regionally, the USCEI was the fifth highest for the Ohio Valley, Southeast and West regions; sixth highest for the Southwest, seventh highest for the South, 10th highest for the Northeast and 14th highest for the Upper Midwest.

Regional CEI values for winter 2016/17
The winter (Dec-Feb) USCEI was 74 percent above average, ranking as the seventh highest winter value on record. Elements which contributed to this elevated USCEI value were extremes in warm maximum and minimum temperatures, one-day precipitation totals and days with precipitation. Extremes in warm minimum temperatures were record high. On the regional scale, the CEI was above much above average for the Northeast, Upper Midwest, Ohio Valley and Southeast. In each of these regions extremes in warm maximum and minimum temperatures were much above average. In the Northeast, the number of days with precipitation was the third highest on record. In the Upper Midwest, the spatial extent of wetness was the fourth highest. In the South, extremes in one-day precipitation totals were the sixth highest. In the Southeast, the spatial extent of drought was much above average.

Regional CEI values for spring 2017
The spring (Mar-May) USCEI was 30 percent above average and ranked as the 19th highest value on record. Elements which contributed to this include extremes in warm maximum and minimum temperatures, one-day precipitation totals, and days with precipitatione. On the regional scale, the CEI in the Southeast ranked as the ninth highest spring value on record due to extremes in warm maximum and minimum temperatures, the spatial extent of drought, and one-day precipitation totals.

Regional CEI values for summer 2017
The summer (Jun-Aug) USCEI ranked was 25 percent above average and the 16th highest value on record. On the national scale, extremes in warm maximum and minimum temperatures were much above average. The CEI was much above-average in the West and Northwest, where extremes in warm maximum and minimum temperatures were record and near-record high.

Regional CEI values for autumn 2017
The autumn (Sep-Nov) USCEI ranked was 25 percent above average and the 18th highest value on record. The elements that track one-day precipitation totals and land-falling tropical cyclones were much above average.

Regional TMIN Extremes Map

Regional TMAX Extremes Map
Looking at maps of the extent of annual extremes in both maximum and minimum temperatures from 1910 - 2017, we can visualize the spatial characteristics and placement of extreme warm and cold periods at various times throughout the years. Cooler periods are noted in the 1910s, specific years during the middle portion of the 20th century and a handful of years during the 1980s and 1990s. Warmer periods are evident during the dust bowls of the 1930s for both maximum and minimum temperatures and 1950s for maximum temperature. Warm extremes appear with greater regularity from the late 1980s to the present. 2012 holds the record for the greatest footprint in warm maximum temperature extremes (88 percent of the CONUS) whereas 2016 holds the record for the maximum extent in warm minimum temperature extremes (93 percent of the CONUS). The record footprint for cold maximum temperatures across the CONUS occurred in 1912 (58 percent) and in 1917 (74 percent) for extreme cold minimum temperatures.
Monthly National Snow and Ice Report
The 2016/17 winter season (December 2016-February 2017) was marked by much-warmer-than-average conditions across much of the East with record warmth in the Southern Plains and Lower Mississippi Valley. Below-average temperatures were observed in the Northwest. January and particularly February were very warm in the East with 17 states from Texas to New York having a record warm February. Below-average temperatures were present for the Northwest during much of the winter. The winter season was wetter than average for much of the nation, particularly the West, Northern Plains and Midwest. Nevada and Wyoming were record wet and California had its second wettest winter helping to end a multi-year drought in the region. The above-average precipitation in the West boosted snowpack totals to record and near-record levels in parts of the Sierra Nevada Mountains. The contiguous U.S. had an above-average snow cover extent in December and January with a below-average snow cover extent for February and into early spring. For the December-February three-month winter period. many locations in the eastern U.S. had near-record low snow totals, however, early spring snow helped to boost annual snow totals across the region.

According to NOAA data analyzed by the Rutgers Global Snow Lab, for the winter season, the contiguous U.S. snow cover extent was 50,000 square miles above the 1981-2010 average and ranked near the middle of the 51-year period of record. The 2016/17 winter snow cover extent was slightly smaller than the snow cover extent of the previous winter season in 2015/16. Much of the snow that fell across the U.S. during the December-February period occurred across the western U.S. with much of the snow in the east falling in December. Record warmth across the East helped to melt the snow that accumulated earlier in the season. A mid-March winter storm impacted the Northeast, bringing blizzard conditions to parts of New England and New York. Snowfall totals exceeding 20 inches were widespread with localized totals in the higher elevations exceeding 30 inches. According to the Northeast Snowfall Impact Scale (NESIS), the storm was rated a Category '3', or major winter storm for the region.
Winter and spring mountain snowpack provide a crucial water source across much of the western United States. The total annual water budget for agriculture and human use in the mountainous West is highly dependent on the amount of snow melt that will occur in spring and is proportional to the amount of snow on the ground. The annual snow pack typically peaks in early April. As of April 1st, as a result of late-winter storms in the Northwest and Northern Rockies and earlier-season snowfall to south, most mountain locations in the West had near- to above-average snowpack. Much-average-average snowpack was observed for the Sierra Nevada Mountains, the central and southern Cascades, and much of the Great Basin to Central Rockies. Parts of the Central Rockies and Sierra Nevada Mountains had a snowpack that was more than 180 percent of average, with several observing stations setting new records. According to the Western Regional Climate Center, the California statewide snowpack was 166 percent of average, the sixth highest since 1950 and highest since 1998. Locations from the northern Cascades to Northern Rockies had near-average snowpack. In Alaska, a dry March resulted in most locations across southern parts of the state to have below-average snowpack. Most of central Alaska had near- to above-average snowpack totals.
Monthly Tropical Cyclones Report
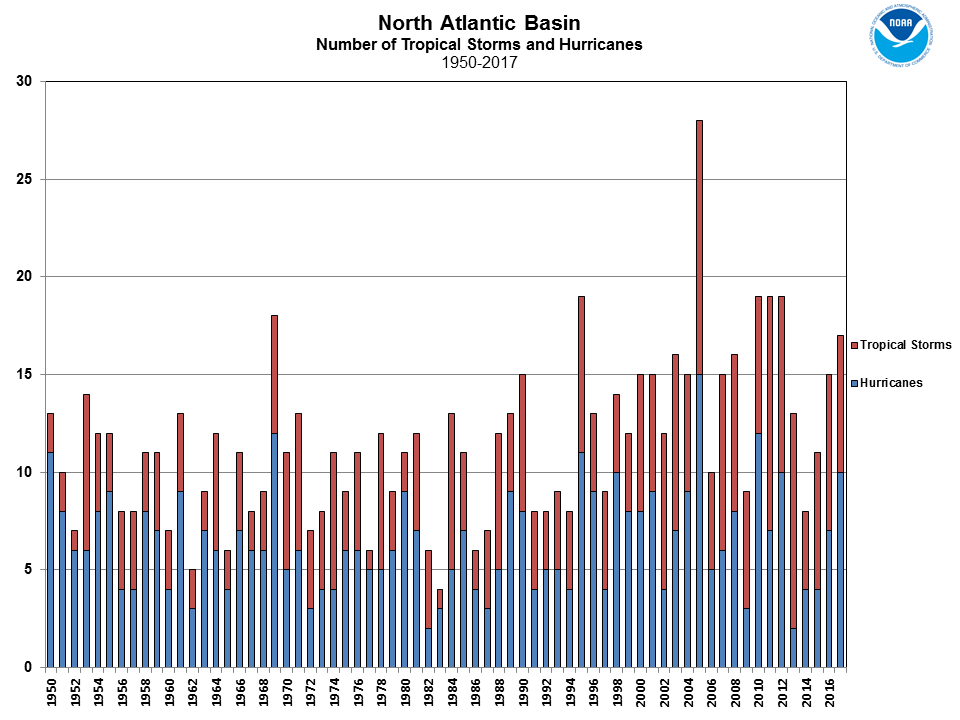
The 2017 North Atlantic hurricane season had 17 named storms, 10 hurricanes, and six major hurricanes. This is well above the 1981-2010 average of 12.1 named storms, 6.4 hurricanes, and 2.7 major hurricanes. The number of named storms ranked as the ninth most on record, the number of hurricanes ranked as the eighth most, and the number of major hurricanes ranked as the third most. The lack of El Nino conditions in the equatorial Pacific, with La Nina conditions developing near the end of the season, likely helped to boost the seasonal numbers. When ENSO neutral and La Nina conditions are present, wind shear in the Atlantic Basin is typically less, creating favorable conditions for tropical cyclone development. Three of the major hurricanes — Harvey, Irma, and Maria — impacted the U.S. mainland and territories causing approximately $265 Billion in damages, contributing to the costliest year in terms of weather and climate disasters for the nation. September was an extremely active hurricane month for the North Atlantic Basin with five hurricanes — four of which were major hurricanes active in the basin. One measure of tropical cyclone activity, the Accumulated Cyclone Energy (ACE) index, which takes into account the combined strength and duration of tropical cyclones — was record high in the North Atlantic during September.
During the 2017 North Atlantic hurricane season, three tropical storms and four hurricanes, made landfall in the U.S. (including Puerto Rico). This is the most hurricane landfalls since 2005 in the U.S. and the landfall of Hurricane Harvey marked the end of a record-long streak of over 4,300 days with no major Hurricanes making landfall in the United States. Prior to Harvey, the last major hurricane to make landfall in the U.S. was Hurricane Wilma in November 2005.
Harvey was also noteworthy for the amount of precipitation it dropped on parts of coastal Texas and Louisiana with reports of over 60 inches of rainfall over five days inundating parts of the Houston metro area. Damages from Harvey exceeded $125 billion, only exceeded by Hurricane Katrina. Hurricane Irma reached maximum strength with maximum sustained winds of 185 mph, tying as the second most intense hurricane on record for the basin. Irma maintained that strength for at least 37 hours, marking the longest that a tropical cyclone has remained that strong anywhere on the globe. Irma made landfall in the Florida Keys at a Category 4 storm, marking the first time that two Category 4 hurricanes have made landfall in the contiguous U.S. in the same year. Irma caused $50 billion in damages. Hurricane Maria made landfall in southeastern Puerto Rico has a Category 4 hurricane, the strongest tropical cyclone to impact the island since 1928. Maria's high winds caused widespread devastation to Puerto Rico's transportation, agriculture, communication and energy infrastructure. Damages from Maria are estimated at $90 billion.
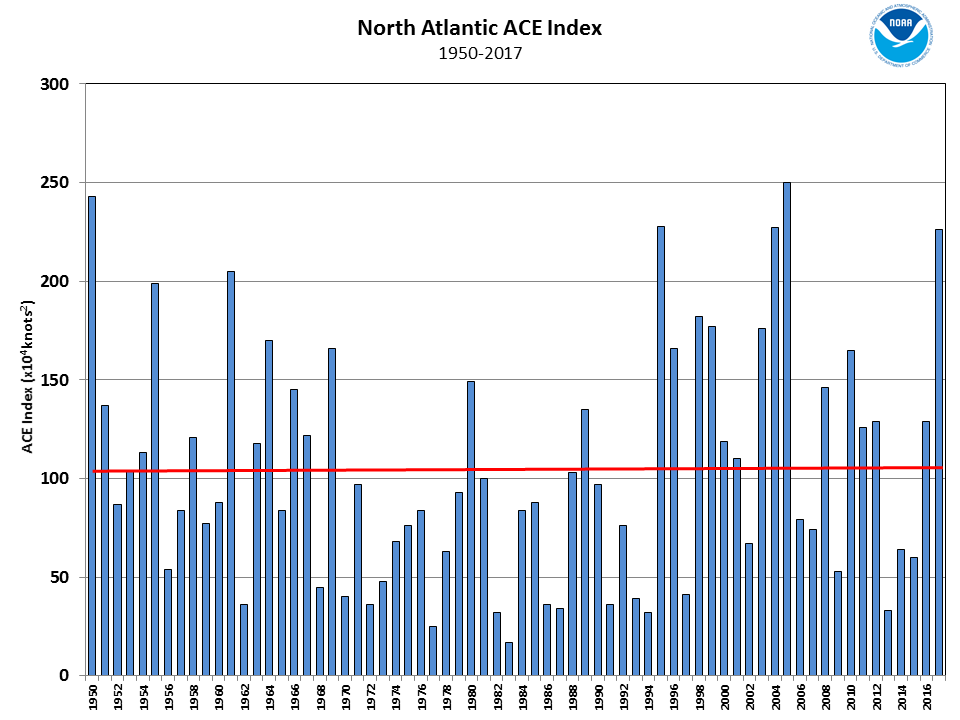
The Accumulated Cyclone Energy (ACE) index of tropical cyclone activity also indicated an above-average season in the North Atlantic. The ACE index is used to calculate the intensity of the hurricane season and is a function of the wind speed and duration of each tropical cyclone. The 2017 Atlantic hurricane season had an approximate ACE of about 226 (x104 knots2) which was more than double the 1981-2010 average value of 104 (x104 knots2) and ranked as the seventh highest value since reliable records began in the 1800s. Almost half of the ACE during the 2017 was attributable to just two hurricanes — Irma and Maria due to their intensity and longevity.
East Pacific Basin
2017 Season Summary:
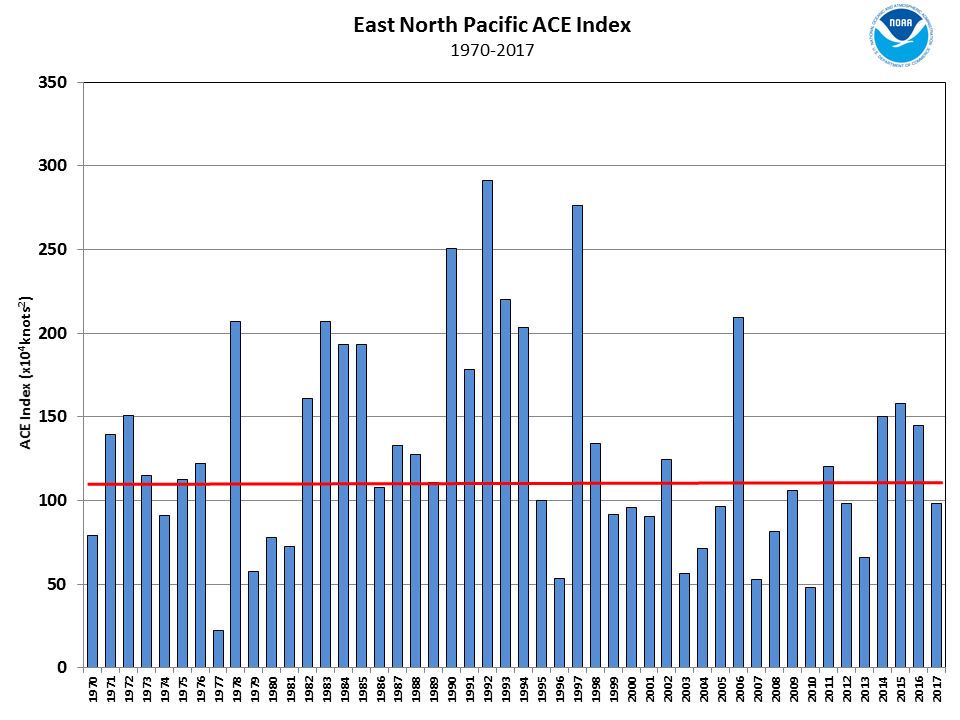
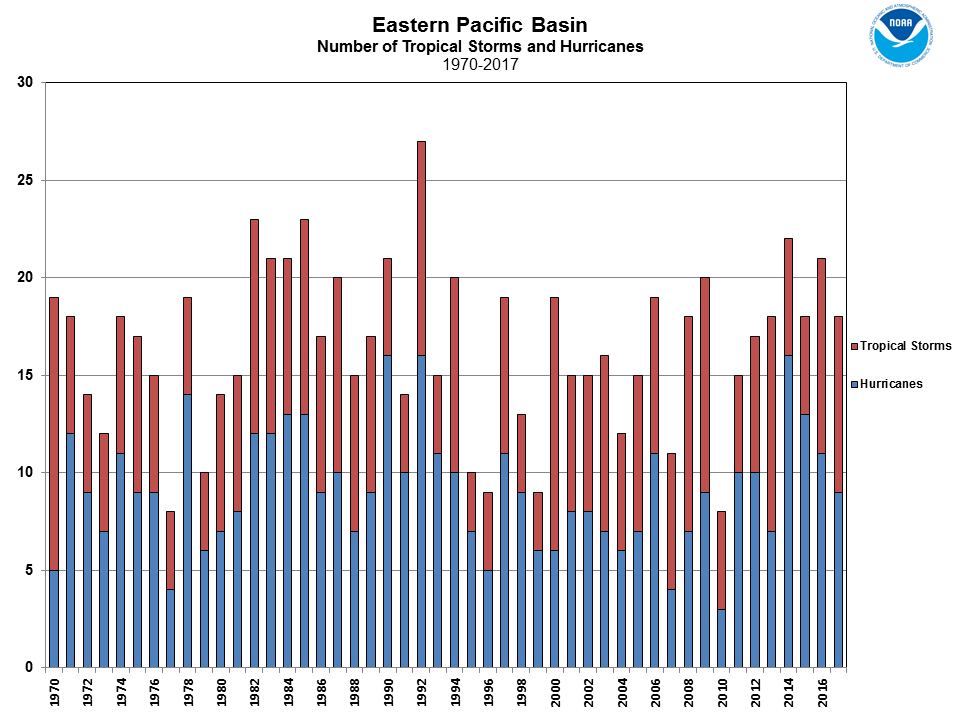
The 2017 East Pacific hurricane season had 18 named storms, including nine hurricanes, four of which became major. The 1981-2010 average number of named storms in the East Pacific is 16.5, with 8.9 hurricanes, and 4.3 major hurricanes. Five Eastern Pacific tropical cyclones made landfall in 2017. Tropical Storm Selma made landfall in El Salvador and tropical storms Beatrix, Calvin, Lidia and Hurricane Max made landfall in Mexico. Tropical Storm Selma was the first named tropical cyclone on record to make landfall in El Salvador. Tropical Storm Adrian formed on May 9th, marking the earliest occurrence of a named storm in the East Pacific basin. The previous earliest occurrence was Tropical Storm Alma forming on May 12, 1990. For the first year since 2012 no tropical cyclones passed near the Hawaiian Islands. The ACE index for the East Pacific basin during 2016 was 98 (x104 knots2), which is below the 1981-2010 average of 132 (x104 knots2 ) and the lowest since 2013.
Monthly Tornadoes Report

2017 Tornado Occurrences
Source: SPC
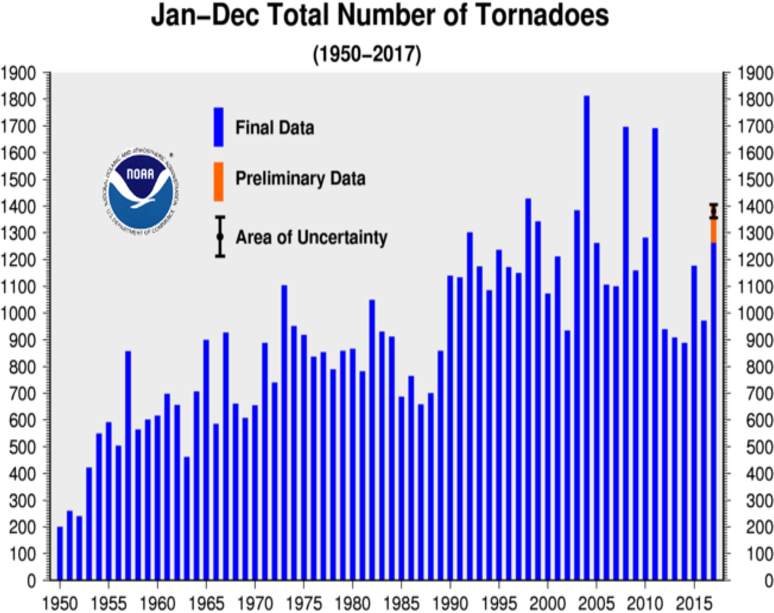
In contrast to the previous four years, tornado activity across the U.S. during 2017 was above average. During January-September there were 1,262 confirmed tornadoes with 144 preliminary tornado reports still pending confirmation for October-December. This brings the preliminary tornado count to 1,406 with the final count expected to be slightly lower. The 1991-2010 annual average number of tornadoes for the U.S. is 1,253. According to the preliminary numbers, 2017 ranks as the fifth highest annual tornado count on record and the most since 2011. As with most years, there were several large and destructive tornado and severe weather outbreaks during 2017. The deadliest tornado outbreak occurred in January with the most destructive in terms of property losses occurring in spring. In total, there were 34 tornado-realted fatalities in 2017,
The deadliest outbreaks of the year occurred early in 2017 with 20 fatalities reported during a late-January tornado outbreak across the South. The deadliest tornado of the year was during this outbreak and impacted Brooks, Cook, and Berrien counties in southern Georgia and killed 11 people. In total there were 34 tornado-related fatalities reported during 2017 — 20 in January, four in February, eight in April and two in May. During the year there were three tornado outbreaks that had costs exceeding $1 billion in damages — the January 20-22 outbreak in the South, the February 28-March 1 outbreak in the Midwest and Southeast, and the March 6-8 outbreak in the Midwest. Five other billion dollar disasters had some damages that were associated with severe weather, hail, and tornadoes. There were also tornadoes reported with the landfalls of Hurricanes Harvey and Irma.
Regional Highlights
These regional summaries were provided by the six Regional Climate Centers and reflect conditions in their respective regions. These six regions differ spatially from the nine climatic regions of the National Climatic Data Center.
- Northeast Region: (Information provided by the Northeast Regional Climate Center)
- The Northeast had its seventh warmest year on record. The region's average temperature of 48.8 degrees F (9.3 degrees C) was 1.6 degrees F (0.9 degrees C) above normal. All twelve states ranked 2017 among their eleven warmest years on record: Delaware, second warmest; Maryland, third warmest; West Virginia, fifth warmest; New Jersey, sixth warmest; Pennsylvania, seventh warmest; Connecticut and Rhode Island, eighth warmest; Maine and Massachusetts, 10th warmest; and New Hampshire, New York, and Vermont, 11th warmest. Departures ranged from 1.2 degrees F (0.7 degrees C) above normal in Maine to 2.4 degrees F (1.3 degrees C) above normal in Delaware. It was the warmest January on record for Bridgeport, Connecticut. The Northeast had its warmest February since 1895 with an average temperature of 32.8 degrees F (0.4 degrees C), 6.6 degrees F (3.7 degrees C) above normal. Delaware, Maryland, New Jersey, New York, Pennsylvania, and West Virginia had a record warm February. Nineteen of the Northeast's 35 major climate sites also had their warmest February on record. In addition, seven major climate sites had their warmest February day or winter day on record on February 24 or 25. February's above-normal temperatures contributed to Baltimore, Maryland, and Huntington, West Virginia, receiving only a trace (less than 0.1 inches [0.3 cm]) of snow during the month, with both sites tying their records for least snowy February. Dulles Airport, Virginia, had its warmest winter on record. With an average temperature of 50.6 degrees F (10.3 degrees C), 4.6 degrees F (2.6 degrees C) above normal, April 2017 tied April 2010 as the warmest on record for the Northeast. April 2017 was the warmest on record for Delaware, Maryland, New Jersey, Pennsylvania, and West Virginia. Fourteen of the region's 35 major climate sites also had a record warm April. On May 18, LaGuardia Airport, New York, and Burlington, Vermont, tied their warmest spring temperatures on record. On June 13, LaGuardia Airport, New York, tied its all-time warmest June day on record. The following week, on June 19, Caribou, Maine, tied its all-time warmest June low temperature on record. In September, nine major climate sites experienced a heat wave (three or more consecutive days of at least 90 degrees F [32 degrees C]) sometime between the 23rd and 27th. For some sites, such as Burlington, Vermont, and Albany, New York, it was the latest heat wave in a calendar year. In fact, it was Albany's first recorded heat wave in astronomical autumn. The Northeast had its second warmest October since recordkeeping began with an average temperature of 55.7 degrees F (13.2 degrees C), 6.3 degrees F (3.5 degrees C) above normal. The record warmest October was 55.8 degrees F (13.2 degrees C) in 2007, only 0.1 degrees F (0.1 degrees C) warmer than October 2017. It was the warmest October on record for the six New England states. In addition, eleven of the region's 35 major climate sites had a record warm October. On October 8 or 9, ten major climate sites had their warmest minimum temperature for October. Later in the month, on the 25th, Caribou, Maine, broke their record for warmest October minimum temperature that was set earlier in the month. In fact, Caribou's top three warmest minimum temperatures for October were all set or tied in 2017. Connecticut, Maine, Massachusetts, and New Hampshire had their warmest autumn since recordkeeping began. Four major climate sites also had their warmest autumn on record: Burlington, Vermont; Concord, New Hampshire; Islip, New York; and Providence, Rhode Island. On November 7, Rochester, New York, had its first 32 degrees F (0 degrees C) freeze, making it the site's second longest frost free season (time between last spring freeze and first fall freeze) since 1872. With its first freeze on November 10, Dulles Airport, Virginia, was one day short of tying its record for latest first freeze (November 11, 2005). It was the first time since 1963 that both Dulles Airport and Washington National, D.C., had their first freeze on the same date.
- 2017 averaged out to be slightly wetter than normal for the Northeast. The region received 46.30 inches (117.6 cm) of precipitation, 104 percent of normal. Seven states were wetter than normal, with precipitation for all twelve states ranging from 88 percent of normal in Connecticut to 111 percent of normal in New York, its 11th wettest. Also, Pennsylvania had its 20th wettest year. On April 20, Buffalo, New York, had its wettest April day on record, which contributed to the site having its wettest April on record. Buffalo and Rochester, New York, received an entire May's worth of rain in just the first week, which contributed to the sites having their second wettest spring on record. Maryland had its third wettest July since recordkeeping began. On July 29, Atlantic City, New Jersey, had its second wettest July day on record. On November 5, Erie, Pennsylvania, had its largest one-day precipitation total for November since records began. Erie also had its wettest December on record.
- A storm brought up to 24 inches (61 cm) of snow and wind gusts of up to 70 mph (31 m/s) to the region from February 9 to 10. Blizzard conditions occurred for up to seven hours at 38 sites in New Jersey, New York, and New England. The intense system produced snowfall rates of 2 to 3 inches (5 to 8 cm) per hour, as well as thundersnow in several locations. Travel was severely impacted, with hundreds of vehicle crashes and thousands of flight cancellations. A few days later, from February 12 to 13, another storm dropped more than 12 inches (30 cm) of snow on much of northern New England, with the greatest totals of up to 40 inches (102 cm) in Maine. Wind gusts of up to 72 mph (32 m/s) contributed to power outages and led to whiteout conditions in the region. A third storm, from February 15 to 16, dropped up to 21 inches (53 cm) of snow on northern New England. In the 10-day span from February 7 to 16, up to 60 inches (152 cm), or 5 feet (1.5 m), of snow fell in portions of Maine. According to the National Weather Service office in Gray, the second greatest one-day snow depth on record for Maine occurred on February 16 in Andover, which had 79 inches (201 cm), or 6.6 feet (2 m), of snow on the ground.
- From March 14 to 15, a powerful nor'easter impacted the Northeast. Snow totals in the hardest hit areas ranged from 24 to 48 inches (61 to 122 cm). Binghamton, New York set a new all-time 24-hour snowfall record, picking up 31.3 inches (79.5 cm) from 3 am on March 14 to 1 am on March 15. The old record of 23 inches (58 cm) was set in February 1961. By the end of the storm, the site already had its snowiest season (October through May) on record, and by May 31, the site's season snow total sat at a record 135.2 inches (343.41 cm). The previous year, in 2015-16, Binghamton had its least snowy season on record with 32.0 inches (81.3 cm) of snow. Scranton, Pennsylvania, had its all-time snowiest day on record with 22.1 inches (56.1 cm) on March 14, beating its old record of 18.7 inches (47.5 cm) set on March 13, 1993. In addition, the 14th was the snowiest March day on record for four major climate sites. Atlantic City, New Jersey received 3.02 inches (76.71 mm) of precipitation (almost all of which fell as rain) on March 14, making it the site's wettest March day on record. Strong winds, hurricane-force in some areas, accompanied the storm. For instance, preliminary data indicated a gust of 79 mph (35 m/s) in Wellfleet, Massachusetts and blizzard conditions occurred for four hours in Lawrence, Massachusetts. The winds downed trees and power lines, contributed to thousands of power outages, and caused rough seas that led to some erosion and coastal flooding. Travel was hampered by the storm, with several travel bans enacted in the region and thousands of flights cancelled nationwide. In northeastern Pennsylvania, at least two small avalanches blocked roads.
- Preliminary data from the U.S. Army Corps of Engineers indicated that the Lake Ontario basin had its wettest May since 1900 and the lake had its all-time highest monthly mean water level since 1918. Above-normal precipitation during spring contributed to record-high water levels on Lake Ontario and the St. Lawrence River, which resulted in flooding and significant erosion along those waterways in New York. Homes and buildings were flooded, roads were closed, and boat launches, docks, and beaches were submerged. The high water washed away land, trees, and breakwalls, and left a few homes and cottages on the verge of falling into the lake. High water levels continued to cause flooding and erosion along the Lake Ontario and St. Lawrence River shorelines during summer. In Sodus Point, New York, boats could not access the lake because docks and ramps were under water, leading to reduced tourism revenue. Flooding damage was estimated to be up to $2 million in Ogdensburg, New York.
- During July, there were multiple extreme rainfall events in the region that exceeded the 100-year return period, meaning rainfall of that magnitude has a 1 percent chance of occurring in a given year. A particularly notable event occurred on July 23 when 4.27 inches (108.46 mm) of rain fell in one hour at the Harrisburg International Airport in Pennsylvania. Downpours and wet conditions led to flash flooding in many parts of the region, with impacts such as numerous washed out or impassable roads, hundreds of flooded basements and damaged buildings, stranded vehicles, water rescues, evacuations, and several mudslides. Agriculture was also affected. USDA crop reports from July indicated the wet conditions led to flooded and muddy fields, delayed harvest and reduced quality of hay, and stunted corn growth in wet fields. Runoff from the heavy rains contributed to high levels of bacteria along the southern New Jersey coastline, causing 15 beaches to close, as well as harmful algal blooms on several waterways including Lake Erie and Cayuga Lake, one of New York's Finger Lakes.
- A powerful storm brought heavy rain, high winds, and some snow to the Northeast from October 28 to 30, with the most significant impacts in New England. The highest rainfall total was 6.38 inches (162.05 mm) in southern Vermont. The heavy rain caused flooding but also helped ease drought conditions in the region. Snow totals of up to 8.4 inches (21.3 cm) were reported in higher elevations of northern West Virginia and western Maryland. Wind gusts of up to 93 mph (42 m/s) downed trees and wires. More than 1,400 poles were snapped in Maine. News reports indicated nearly 1.5 million customers lost power in the Northeast, some for almost a week. More than 400,000 Central Maine Power customers lost power, making it the 'largest number of outages in the company's history.' In New Hampshire, more than 350 roads were closed due to flooding and high winds. In addition, hundreds of schools were closed, with some having to extend the school year farther into summer.
- There were several notable tornado events in the Northeast during the year. On February 25, an EF-1 touched down in western Massachusetts. According to the Taunton National Weather Service office, 'there has never been a tornado during the month of February since official tornado statistics have been kept, dating back to 1950' in Massachusetts. On May 1, Pennsylvania had eight tornadoes, which is more than double the state's average for May (based on data from the NOAA's Storm Prediction Center from 1989-2013). In Maine, a state that averages only two tornadoes a year, the Gray National Weather Service office issued seven tornado warnings on July 1, their greatest number in recorded history. Five weak (EF-0 or EF-1) tornadoes touched down, the most Maine has had in a single day. Clarion County, Pennsylvania, had six tornadoes from May through July; however, between 1950 and 2016 the county only had eight tornadoes, according to the National Weather Service in Pittsburgh. Two tornadoes touched down in western Pennsylvania in November, one in Erie County and one in Allegheny and Westmoreland counties. Data from the National Centers for Environmental Information's Storm Events Database (records to 1950) indicated that it was the first tornado in November and the latest in a calendar year for Allegheny County and only the second November tornado and the second latest in a calendar year for Erie and Westmoreland counties.
- Erie, Pennsylvania, experienced a historic snow event from December 24 to 26 that shattered numerous records. On the 25th, the site had its all-time snowiest day on record with 34.0 inches (86.4 cm) of snow. The previous record was 20.0 inches (50.8 cm) on November 22, 1956. The following day, on the 26th, the site received 26.5 inches (67.3 cm) of snow, which made it the second all-time snowiest day on record. Preliminary data indicates that the two-day snow total of 60.5 inches (153.7 cm) is the all-time greatest 2-day snowfall for Pennsylvania. The previous record was 46.0 inches (116.8 cm) in Seven Springs from March 13 to 14 in 1993. Erie wrapped up December with 121.3 inches (308.1 cm) of snow, making it the site's all-time snowiest month on record. The previous record was 66.9 inches (169.9 cm) in December 1989. Erie's 121.3 inches (308.1 cm) of snow in December 2017 is the all-time greatest monthly snowfall for Pennsylvania. The previous record was 117.8 inches (299.2 cm) in Laurel Summit in February 2010.
- For more information, please go to the Northeast Regional Climate Center Home Page.
- Midwest Region: (Information provided by the Midwest Regional Climate Center)
- Annual averaged temperatures in the Midwest were well above normal. The region as a whole averaged 1.8 degrees F (1.0 C) above normal ranking it as the 8th warmest year (records began in 1895). All nine Midwest states ranked among the warmest 10 percent (top-12) of their records with each ranking between 5th and 12th. January (9th), February (2nd), and April (12th) ranked among the warmest 10 percent for the region as a whole, with six, nine, and eight states likewise ranked among the warmest 10 percent in those respective months. New record high average temperatures in April were set at some stations with very long histories in Kentucky (Louisville and Lexington, both with records back to 1872) and Ohio (Akron 1887, Cleveland 1871, and Columbus 1878). The old April records at Columbus, Louisville, and Lexington were from 1896, more than 120 years ago. August was notably cool with three states ranking among the coolest 10 percent of their records — Illinois 10th, Iowa 8th, and Missouri 7th. Warmth in September had Michigan and Wisconsin ranked among the warmest 10 percent. Following a hot and humid spell in mid July, there was a cool 6-week period that extended into early September. Temperatures in the latter half of September were, for many Midwest locations, the hottest of the year. Chicago had a string of seven consecutive record high days, September 20th-26th, each with maximum temperatures above 90 degrees F (32 C). December was generally warm for the first three weeks but then around Christmas temperatures fell to much below normal. The last seven days of the year were the coldest of the season, and for most locations the coldest of 2017. Temperatures dropped to -40 degrees F (-40 C) in northern Minnesota and to zero degrees F (-18 C) as far south as Missouri and Kentucky. The 7-day period had average minimum temperatures below zero degrees F (-18 C) for most of the northern half of the region.
- Precipitation was generally on the wet side (ranked 27th wettest since 1895) in 2017 for the Midwest but there was a lot of variability. Michigan had its wettest year, and Ohio (7th) and Wisconsin (8th) also ranked among the wettest years while Illinois, Iowa, and Missouri were below normal. In February, Illinois and Missouri ranked among the driest 10 percent. From April through November, each month except September had at least one state ranked among the wettest 10 percent in their history. There were a total of 15 cases of a state with a monthly value among the wettest 10 percent during these months with all nine states having at least one. Missouri in April and Michigan in October set records for the wettest month. Tecumseh, MO (period of record, 1942-present) received 17.48 inches (444 mm) of precipitation in April, breaking the previous monthly precipitation record of 14.43 inches (367 mm) set in 1957. In September, the remnants of Hurricane Harvey brought heavy rains to Kentucky in the first few days of the month while three states (Illinois, Michigan, and Missouri) ranked among the driest 10 percent. More dry months were recorded in November (Missouri ranked 11th driest) and December (Iowa 5th and Illinois 7th). Spring ranked as the 6th wettest for the Midwest while the fall saw numerous extremes of both wet and dry.
- Drought in the Midwest during 2017 was limited in areal coverage but still intense in a few locations. The year began with moderate drought mostly in Missouri. Drought expanded to a peak at 13 percent of the Midwest in March before spring rains wiped out all Midwest drought. In early May, there was no drought and no abnormally dry areas in the region for the first time since May of 2002. Late summer and fall saw new drought development around the region with southern Iowa having extreme drought from mid-August to early October. Areal coverage peaked at about 12 percent of the region in early October when scattered areas of drought touched every Midwest state except Kentucky. In the last three months of 2017, drought expanded in Missouri and neighboring parts of Iowa and Illinois while ending in other parts of the Midwest except in north central Minnesota.
- Seasonal snowfall for the winter of 2016-17 was well below normal for much of the region. The only above-normal areas were in northwestern Minnesota and a swath from north central Iowa to northeastern Wisconsin. The southern half of the Midwest had seasonal totals ranging from 10 to 50 percent of normal.
- It was a slow start to the 2017-18 snow season overall. The first significant snow of the season fell in late October in northern Minnesota and the Upper Peninsula of Michigan with totals up to a foot (30 cm). There was little snowfall in November. Lake-effect snows began in earnest in early December as the nearly ice-free and relatively warm Great Lakes provided ideal conditions. Heavy snow fell down wind of the lakes through mid-December and then again in the last week of the year. Away from the Great Lakes, in southern Minnesota through southern Wisconsin, seasonal snowfall deficits topped 10 inches (25 cm).
- A number of lakes in southern and central Minnesota froze in November but then melted again. Most Minnesota lakes were frozen over by mid-December.
- There was a late freeze in northern and eastern parts of the Midwest in May. Freezing temperatures touched all Midwest states except Missouri. Temperatures fell below 25 degrees F (-4 C) in Minnesota, Wisconsin, and Michigan with reports of damage to fruit trees in Michigan. An early freeze on August 25th in the Arrowhead of Minnesota and the Upper Peninsula of Michigan, brought the growing season to an early end.
- The total solar eclipse on August 21st was the first to pass across the Midwest since 1925. The path of totality crossed Missouri, southern Illinois, and western Kentucky and the remainder of the region had a partial eclipse. Viewing in the Midwest was generally good but a frontal boundary limited viewing for parts of Iowa, Minnesota, Wisconsin, and northern Illinois.
- Heavy rains in the southern Midwest in late April, brought widespread flooding. Southern Missouri was very hard hit with locations picking up more than 10 inches (254 mm) of rain in just two days. Interstate 44 was closed after parts of the roadway were washed away by floodwaters. Four deaths and more than 100 rescues were related to flooding in southern Missouri. Many Midwest corn and soybean fields had ponding or saturated soils that caused many acres to be replanted.
- There were four deadly tornadoes in 2017 with five deaths. Two tornadoes in Illinois killed three on February 28th, another in Missouri the same day killed one, and a Wisconsin tornado on May 16th was responsible for 1 death and 25 injuries. Iowa had a busy day early in the year, with 18 tornadoes on March 6th. On November 5th, 21 Midwest tornadoes included 17 in Ohio alone. The Ohio tornado count for the day was nearly equal to the average annual total of 20 tornadoes.
- Non-thunderstorm winds were deadly in three other cases in 2017. On March 8th, two deaths were caused when high winds blew down a tree onto a vehicle. On May 17th, strong winds in Missouri felled a rotten tree killing one person and in central Illinois died in a multiple vehicle accident caused by low visibility in a dust storm.
- For further details on the weather and climate events in the Midwest, see the weekly and monthly reports at the Midwest Climate Watch page.
- Southeast Region: (Information provided by the Southeast Regional Climate Center)
- The top 10 weather and climate extremes that occurred across the region during the year are designated with 'Extreme' in parentheses. The numbers associated with each extreme are used as identifiers rather than rankings.
- Temperatures were exceptionally warm across much of the Southeast region during the year, with annual departures ranging from 1 to 4 degrees F (0.6 to 2.2 degrees C) above average (Extreme #1). Annual mean temperatures were at least 2 degrees F (1.1 degrees C) above average for approximately 40 percent of the 169 long-term (i.e., period of record equaling or exceeding 50 years) stations across the region. Over 40 percent (72 of 169) of the long-term stations observed annual mean temperatures that were within their five warmest values on record. At least 6 of these stations were located in every state, including most of the major cities within the region. Twenty-three of the long-term stations observed or tied their warmest annual mean temperature on record, including Tampa, FL (1891-2017), Pensacola, FL (1880-2017), Augusta, GA (1875-2017), Columbia, SC (1888-2017), Asheville, NC (1890-2017), and Norfolk, VA (1874-2017). Collectively, the Southeast region observed its warmest year since records began in 1895, with an annual mean temperature of 65 degrees F (18.3 degrees C). South Carolina (65.1 degrees F, 18.4 degrees C) observed its warmest year on record, while Georgia (65.8 degrees F, 18.8 degrees C) and North Carolina (61.1 degrees F, 16.2 degrees C) tied their warmest year on record. Temperatures were especially warm during January, February, and April, with monthly departures ranging from 3 to as much as 10 degrees F (1.7 to as much as 5.6 degrees C) above average across the region (Extreme #2). Thirty-five, or roughly 15 percent, of the long-term stations within the region observed their warmest February and April mean temperatures on record. It is especially outstanding that multiple stations in every state recorded February mean temperatures that were well above their 30-year (1981-2010) mean temperature for March, including Montgomery, AL (1.9 degrees F above its March mean temperature, 1.1 degrees C above its March mean temperature), Pensacola, FL (+3.2 degrees F, +1.8 degrees C), Atlanta, GA (+1.8 degrees F, +1.0 degrees C), Charlotte, NC (+2.3 degrees F, +1.3 degrees C), and Norfolk, VA (+2.1 degrees F, +1.2 degrees C). While 38 long-term stations observed average daily maximum temperatures that were ranked within their five warmest values on record, more than double the number of stations (78) observed average daily minimum temperatures that were ranked within their five warmest values on record. However, the persistence of daytime warmth was exceptional for many locations across the region, particularly during winter and spring. At least 17 long-term stations observed or tied their highest annual count of days with a maximum temperature at or above 70 degrees F (21.1 degrees C), including Jacksonville, FL (1872-2017; 324 days, 89 percent of the year), Mobile, AL (1873-2017; 305 days, 84 percent of the year), Atlanta, GA (1879-2017; 248 days, 68 percent of the year), Charlotte, NC (1879-2017; 236 days, 65 percent of the year), and Raleigh, NC (1887-2017; 231 days, 63 percent of the year). In addition, several stations observed or tied their highest annual count of days with a maximum temperature at or above 80 degrees F (26.7 degrees C), including Miami, FL (1896-2017; 323 days, 88 percent of the year), Augusta, GA (214 days, 59 percent of the year), Montgomery, AL (1873-2017; 209 days, 57 percent of the year), Charleston, SC (1939-2017; 199 days, 55 percent of the year), and Columbia, SC (1888-2017; 198 days, 54 percent of the year). Average daily minimum temperatures were extremely warm along the coastlines of Florida and Puerto Rico during the year. Tampa (1891-2017), Melbourne (1941-2017), and Pensacola observed their highest annual count of 138, 130, and 102 days with a minimum temperature at or above 75 degrees F (23.9 degrees C), which surpasses their previous records by 22, 33, and 15 days, respectively. Miami observed its highest annual count of 72 days with a minimum temperature of at least 80 degrees F, surpassing the previous record (45 days in 2010) by 27 days. The coldest temperature observed during the year was -11 degrees F (-23.9 degrees C), which was recorded on a fresh snowpack at Waynesville 1 E, NC on January 8th and 9th. The warmest temperature observed during the year was 102 degrees F (38.9 degrees C), which was recorded at Raleigh-Durham International Airport, NC, Fayetteville Regional Airport, NC, and John H. Kerr Dam, VA on July 23rd.
- Annual precipitation totals were near-average to above-average across much of the Southeast region, with pockets of unusual dryness occurring in several areas. The driest locations were found across relatively small portions of central Virginia, central and far western North Carolina, north-central South Carolina, west-central and northwestern Alabama, and southwestern Georgia. Annual precipitation totals were 6 to more than 12 inches (152 to more than 305 mm) below average in these areas. The lowest annual precipitation total for any station (excluding CoCoRaHS) across the region was recorded in Louisa, VA (1917-2017), which observed its fifth driest year on record with only 30.27 inches (769 mm) of precipitation. In contrast, the wettest locations were found across much of Alabama, the Florida Peninsula, the western half of the Florida Panhandle, Puerto Rico, and the U.S. Virgin Islands, as well as portions of northern Georgia, coastal South Carolina, and western North Carolina. Annual precipitation totals ranged from 12 to more than 20 inches (305 to more than 508 mm) above average in these areas. Numerous long-term stations in Alabama and Florida observed annual precipitation totals that were ranked within their five highest values on record, including Naples, FL (1943-2017; 93.44 inches, 2,373 mm), Pensacola, FL (1880-2017; 91.91 inches, 2,335 mm), Atmore, AL (1941-2017; 90.15 inches, 2,290 mm), Miami, FL (1912-2017; 83.12 inches, 2,111 mm), Federal Point, FL (1893-2017; 78.78 inches, 2,001 mm), and Sylacauga 4 NE, AL (1955-2017, 75.58 inches, 1,920 mm). The highest annual precipitation total for any station (excluding CoCoRaHS) across the mainland portion of the region was recorded in Naples, which surpassed its previous wettest year on record (2003) by 18.81 inches (478 mm). An extraordinary number of heavy rainfall events were observed across the region throughout the year, with over 550 reports of flooding during summer (Extreme #3). From May 20th through the 21st, a slow-moving system of thunderstorms produced widespread heavy rainfall across Alabama, with flash flooding occurring in the three major cities of Birmingham, Montgomery, and Mobile. Multiple water rescues were performed in the Birmingham metropolitan area, and several submerged vehicles were reported in Montgomery. On the 20th, Montgomery observed its wettest May day and fourth wettest day for any month on record, with 8.15 inches (207 mm) of precipitation. Of this daily total, 7.31 inches (186 mm) was recorded in only 6 hours, which would be expected to occur about once every 200 years on average at this location. On June 10th, a nearly stationary thunderstorm caused flash flooding in Ocala, FL, with a National Weather Service spotter measuring 4.62 inches (117 mm) of rainfall in less than 30 minutes. About 15 vehicles were submerged in several feet of floodwater, and one vehicle was swallowed by a 25-foot-deep sinkhole. Sarasota-Bradenton, FL (1911-2017) observed its highest 1-day and 2-day precipitation totals for August and its third highest 1-day and 2-day precipitation totals for any month on record, with 8.12 inches (206 mm) on August 26th and 12.44 inches (316 mm) from August 26th through the 27th. On the 27th, a resident of Sarasota was killed after driving his vehicle into deep floodwater, while over 60 homes were flooded in a Bradenton neighborhood, requiring at least 26 people to be evacuated. On October 23rd, a slow-moving complex of thunderstorms produced heavy rainfall and flash flooding across Upstate South Carolina, western North Carolina, and southwestern Virginia. Brevard, NC (1902-2017) observed its wettest October day and fourth wettest day for any month on record, with 7.20 inches (183 mm) of precipitation. Boone, NC (1929-2017) observed its wettest October day and third wettest day for any month on record, with 5.95 inches (151 mm) of precipitation. Over 50 apartments in Boone sustained floodwater damage, while more than a dozen people were rescued from partially submerged vehicles. Annual snowfall accumulations were below average across northern Alabama, northern and western Virginia, and Washington, D.C., while above-average snowfall occurred in much of central and southern Alabama, northern and west-central Georgia, Upstate South Carolina, North Carolina, and southeastern Virginia. Charlottesville 2 W, VA (1913-2017), Washington, D.C. (1885-2017), and Washington Dulles International Airport, VA (1963-2017) recorded only 5.1, 5.3, and 11.9 inches (130, 135, and 302 mm) of snowfall during the year, which is 15.6, 13.0, and 10.9 inches (396, 330, and 277 mm) below their long-term averages, respectively. In contrast, Highlands, NC (1893-2017), Caesars Head, SC (1890-2017), and Clayton 1 SSW, GA (1895-2017) recorded 28.6, 18.8, and 13.4 inches (726, 478, and 340 mm) of snowfall during the year, which is 15.4, 8.8, and 8.0 inches (391, 224, and 203 mm) above their long-term averages, respectively. A large proportion of the annual snowfall across the region was recorded on December 8th and 9th, as an early-season winter storm produced 3 to more than 12 inches (76.2 to more than 305 mm) of snowfall in a continuous swath extending from southwestern Alabama to east-central Virginia (Extreme #4). Measurable snowfall was recorded in every state across the region, but the greatest storm total accumulations occurred in portions of east-central Alabama, northern Georgia, Upstate South Carolina, and western North Carolina. With 1 inch (25.4 mm) of snow recorded on the 8th, Mobile, AL (1895-2017) observed its earliest measurable snowfall on record, surpassing the previous record (1 inch on December 18, 1996) by 10 days. Snowfall totals were exceptionally high in areas located north and west of Atlanta, GA, with seven long-term stations observing their greatest 1-day snowfall on record for December. Three of these stations observed their second greatest 1-day snowfall for any month on record, including Dallas 7 NE (1948-2017; 12.3 inches, 312 mm), Taylorsville (1939-2017; 8.8 inches, 224 mm), and Carrollton (1942-2017; 8.0 inches, 203 mm). Over 325,000 customers lost power in northern Georgia, and more than 800 flights were cancelled at Hartsfield-Jackson International Airport in Atlanta. On the 9th, Mt. Mitchell, NC (1980-2017) observed its highest 1-day snowfall for December and its fourth highest 1-day snowfall for any month on record, with an accumulation of 25.0 inches (635 mm). Highlands, NC (1893-2017) observed its highest 2-day snowfall for December and its second highest 2-day snowfall for any month on record, with an accumulation of 15.3 inches (389 mm).
- Seven tropical cyclones (Tropical Storm Cindy, Tropical Storm Emily, Hurricane Harvey, Hurricane Irma, Hurricane Maria, Hurricane Nate, and Tropical Storm Philippe) brought high winds, inland flooding, storm surge, and tornadoes to portions of the Southeast region, including Puerto Rico and the U.S. Virgin Islands. These landfalling tropical cyclones contributed at least 10 percent of the annual precipitation observed in portions of every state within the region, including 20 to 35 percent of annual precipitation totals across much of Florida. After making landfall twice in southern Florida (Cudjoe Key and Marco Island) on September 10th, Hurricane Irma became the first major hurricane to make landfall in Florida since Hurricane Wilma in October 2005 (Extreme #5). Irma produced 5 to more than 15 inches (127 to more than 381 mm) of rainfall across nearly all of the Florida Peninsula, as well as broad portions of southeastern Georgia and the southern half of South Carolina. In Florida, the Fort Pierce COOP station (1901-2017), the Sanford COOP station (1948-2017), and Melbourne (1937-2017) observed their wettest day for any month on record, with 13.85, 11.50, and 10.23 inches (352, 292, and 260 mm) of precipitation, respectively. A combination of torrential rainfall and storm surge caused exceptional flooding in Miami, FL, Jacksonville, FL, and Charleston, SC, with more than 350 water rescues performed in Jacksonville. Some of the highest recorded wind gusts from Irma included 142 mph at Naples Municipal Airport, FL, 137 mph on Buck Island in the U.S. Virgin Islands, 130 mph on Marco Island, FL, 120 mph on Big Pine Key, FL, 101 mph on Virginia Key near Miami, FL, 86 mph at Jacksonville International Airport, FL, and 64 mph at Hartsfield-Jackson International Airport in Atlanta, GA. Approximately 17 million people across the Southeast (including an estimated 15 million residents in Florida) lost power for less than a day to more than one week, which is the greatest number of power outages in the United States caused by any hurricane on record. About one-quarter of over 50,000 homes in the Florida Keys were destroyed, while 65 percent sustained major damage. Catastrophic damage also occurred on St. Thomas and St. John in the U.S. Virgin Islands, where collapsed homes and buildings as well as downed trees and power lines produced uninhabitable conditions across much of these islands. At least 92 fatalities (77 in Florida alone) were attributed to Hurricane Irma, including 14 nursing home residents in Hollywood, FL who died from heat exhaustion due to a lack of air conditioning after the storm. On September 20th, Hurricane Maria made landfall near Yabucoa, Puerto Rico as a Category 4 hurricane with maximum sustained winds of 155 mph (Extreme #6). Maria was the strongest hurricane to strike Puerto Rico since the Category 5 landfall of the San Felipe Segundo hurricane in September 1928, and it was also the tenth most intense hurricane on record in the Atlantic basin, with a minimum central pressure of 908 mb. Several wind gusts exceeding 100 mph were recorded as Maria tracked near St. Croix and over Puerto Rico, including 137 mph at Sandy Point National Wildlife Refuge on St. Croix, 120 mph in Gurabo, PR, 116 mph at Yabucoa Harbor, PR, 113 mph in San Juan, PR, and 112 mph in Arecibo, PR. Ten to more than 25 inches (254 to more than 635 mm) of rainfall was observed across much of the island, with the highest precipitation total of 37.90 inches (963 mm) recorded near G. L. Garcia. Broad portions of eastern and northwestern Puerto Rico observed maximum 12-hour rainfall totals that would be expected to occur once every 1,000 years on average. Widespread river flooding was observed, as 30 of the 65 USGS streamflow gages on the island exceeded major flood stage and 13 reached or exceeded their highest crest on record. Puerto Rico sustained catastrophic infrastructural damage, including a total loss of electricity, drinking water shortages, and damage to countless homes and buildings. The National Weather Service Doppler radar located in southeastern Puerto Rico was destroyed by Maria's strong winds. Over 50 percent of the island was without power for at least 2 months. While the preliminary death toll was 64, Hurricane Maria likely caused hundreds of additional fatalities across the island.
- There were 4,059 severe weather reports across the Southeast during the year, which is about 120 percent of the median annual frequency of 3,340 reports during 2000-2016. Over half (2,161 of 4,059) of these reports were observed during April, May, and July. The fewest number of reports occurred in Florida (437; 11 percent of total), while the greatest number was recorded in Georgia (951; 23 percent of total). Strong thunderstorm winds accounted for nearly 80 percent (3,189 of 4,059) of the severe weather reports and caused at least 10 fatalities and 49 injuries across the region. On May 30th, thunderstorm wind gusts estimated at 80 to 90 mph caused trees to fall onto several homes and vehicles across Sampson County, NC, resulting in at least 12 injuries. Approximately 16,000 turkeys were killed, as the strong winds destroyed numerous poultry houses. The highest thunderstorm wind gust recorded during the year was 87 mph, which was measured near Destin, FL as a powerful squall line moved through the Florida Panhandle on February 7th. The highest non-convective wind gust recorded during the year was 101 mph, which was measured on Grandfather Mountain, NC (5,280 feet above sea level) following the passage of a strong extratropical cyclone on April 6th. The largest hailstones observed during the year were grapefruit-sized (i.e., 4-inch diameter), which was reported in Talladega County, AL on April 5th. On September 1st, severe thunderstorms produced hail up to 2.75 inches in diameter (i.e., baseball-sized) across southern Wake and northern Harnett Counties in North Carolina, with dozens of homes in the town of Fuquay-Varina sustaining broken windows and damaged siding. In addition, dozens of vehicles experienced major hail damage, including shattered windshields and large exterior dents. A total of 312 tornadoes (10 unrated, 122 EF-0s, 143 EF-1s, 35 EF-2s, 2 EF-3s) were confirmed across the Southeast during the year, which is the fifth highest annual tornado count for the region since modern records began in 1950 (Extreme #7). About 65 percent (202 of 312) of the tornadoes occurred during January (77), April (70), and May (55). The 77 tornadoes observed during January was more than double the previous monthly record of 29 tornadoes recorded in January 2006. Over one-third of the 312 tornadoes across the region occurred in Georgia, with an annual statewide count of 113 tornadoes surpassing the previous record (63 in 2008) by 50. In January, Georgia also set new state records for the most tornadoes recorded in a single day (27) and a two-day period (41). Of the 17 fatalities and at least 91 injuries caused by tornadoes across the region, sixteen of the fatalities and 62 of the injuries occurred in Georgia. On January 22nd, an EF-3 tornado, with a maximum width of 1.25 miles, tracked over 70 miles across four counties in southwestern Georgia. Dozens of homes and other structures were damaged or destroyed, and 90 to 100 percent of trees were snapped or uprooted in many locations along its path. Five fatalities were reported in the city of Albany, and at least 40 people were injured. On October 8th, an EF-1 tornado spawned by Hurricane Nate crossed the Blue Ridge Parkway at an elevation exceeding 3,000 feet and became the first observed tornado in Ashe County, NC since records began in 1950. Eleven fatalities and at least 51 injuries were caused by lightning strikes across the Southeast. On September 5th, a lightning strike killed a 63-year-old fisherman and injured three others in Juana Diaz, PR, as they were anchoring their boat prior to the arrival of Hurricane Irma. This was the first reported lightning fatality in Puerto Rico since June 2009.
- After peaking in intensity during autumn 2016, moderate-to-extreme (D1-D3) drought conditions gradually improved across interior portions of the Southeast region during winter and spring. Well-above-normal precipitation in January ended the drought across the Florida Panhandle and the southern half of Alabama and Georgia. With unseasonable warmth and below-average precipitation observed during February, drought conditions briefly intensified in northern Georgia and the western Carolinas, while a narrow corridor of moderate-to-severe (D1-D2) drought emerged east of the Shenandoah Valley in northern Virginia and the Washington, D.C. area. In addition, unusual dryness led to the development of moderate drought in parts of central and southern Florida. Well-above-normal precipitation during the spring terminated nearly all of the drought across interior portions of Alabama, Georgia, the Carolinas, and Virginia. Conversely, a persistent lack of spring rainfall produced moderate-to-extreme drought across much of Florida and southern Georgia, covering nearly 72 percent of Florida for the first time since February 2013. Indeed, only 0.10 inches (2.5 mm) of rainfall was observed in Orlando, FL (1892-2017) during March and April, which is its second lowest precipitation total for any two-month period on record. Moultrie 2 ESE, GA (1928-2017) and Tampa, FL (1891-2017) tied their second and fifth highest count of spring days with no measurable precipitation, at 79 and 83 days, respectively. This drought sparked the most active wildfire season since 2011 in Florida, with nearly 1,800 fires observed and over 120,000 acres burned during spring (Extreme #8). A few of the largest wildfires in Florida included a 7,500-acre fire in southwestern Florida, which destroyed 4 rural homes near Naples in early March, and the Cowbell Fire, which burned nearly 22,000 acres of the Big Cypress National Preserve in southern Florida. The West Mims Fire was the largest and most destructive inferno, consuming over 150,000 acres of the Okefenokee National Wildlife Refuge in southeastern Georgia and a small portion of northeastern Florida. Burning for roughly two months (April-May), it caused a significant reduction in tourism in the Okefenokee Swamp and nearby beaches along the Atlantic coast. Beginning on May 6th, southern portions of Charlton County, GA, including about 2,000 residents in the community of St. George, were placed under a week-long mandatory evacuation order due to a rapid spreading of the West Mims Fire. On the same day, heavy smoke and falling ash were reported in downtown Jacksonville, FL, located about 30 miles from the fire perimeter. Following a mostly drought-free summer and early autumn, an area of moderate drought developed in portions of central North Carolina and south-central Virginia during early October. By the end of December, moderate drought covered at least 15 percent of every state in the region, including central Virginia, central North Carolina, north-central South Carolina, southern Georgia, west-central and southeastern Alabama, and the Florida Panhandle. While agricultural and livestock production was satisfactory across much of the Southeast during the year, major devastation from a spring freeze and landfalling hurricanes occurred in southern portions of the region. A hard freeze during mid-March caused over $1 billion in fruit crop losses across the region, including about 90 percent of South Carolina peaches and 80 percent of Georgia peaches and blueberries (Extreme #9). Daily minimum temperatures from March 14th through the 17th fell below 32 degrees F (0 degrees C) as far south as northern Florida, and hard freeze conditions (i.e., air temperature at or below 28 degrees F [-2.2 degrees C] for at least 4 consecutive hours) were observed across much of the region, primarily from central Georgia to northern Virginia. During this four-day period, some of the stations that recorded the most consecutive hours at or below 28 degrees F were Asheville, NC (19 hours), Roanoke, VA (18 hours), Valdosta, GA (7 hours), Huntsville, AL (6 hours), Charleston, SC (6 hours), and Crestview, FL (5 hours). While the freeze did not occur unusually late in the season, many fruit crops had budded or bloomed prematurely due to an exceptional lack of winter chill hours, which increases their vulnerability to spring freezes. Other fruit crops that were damaged included strawberries and blueberries in South Carolina, peaches and blueberries in North Carolina, and peaches and cherries in Virginia. In September, over $2.5 billion in agricultural losses was caused by Hurricane Irma in Florida, while Hurricane Maria destroyed about 80 percent of the crop production in Puerto Rico, resulting in at least $780 million in agricultural losses (Extreme #10). Following Hurricane Irma, citrus fruit losses ranged from less than 30 percent to nearly 100 percent in groves across central and southern Florida, with the extent of damage varying by the quantity of fruit that dropped from the trees due to high winds. Many citrus trees were uprooted, and some growers were temporarily unable to pump floodwater out of their groves due to a lack of electricity, which could produce long-term tree damage. Dairy farms in Florida were forced to dump milk at a significant cost per day, as power outages prevented consumers from storing it. About 30 percent of the pecan crop in Georgia was lost, as wind gusts from Irma exceeding 50 mph stripped off immature nuts and blew down thousands of pecan trees. Hurricane Maria destroyed dairy barns and plantain, banana, and coffee plantations in Puerto Rico. In addition, about 90 percent of the poultry production on the island was lost, including 2 million of the 2.6 million fowls.
- For more information, please go to the Southeast Regional Climate Center Home Page.
- High Plains Region: (Information provided by the High Plains Regional Climate Center )
- It was another warm year throughout the High Plains, as 2017 was among the top 10 of warmest years for several locations across the region. Colorado experienced the greatest departures, and Alamosa and Akron had their warmest years on record. The transition seasons were most responsible for this record-breaking warmth, as spring and fall temperatures were approximately 2.0-4.0 degrees F (1.1-2.2 degrees C) above normal. As for precipitation, wet and dry conditions were both present throughout the region. Much of the High Plains experienced a wet winter, and the southern portion of the region had a wet spring as well. Meanwhile, the summer was dry for most, and the fall brought both wet and dry conditions. The major precipitation stories of the year included the high snowpack in the Rockies and the Northern Plains drought. Mountain snowpack was plentiful throughout Wyoming and Colorado, and spring runoff caused streams to flood. However, the Dakotas and Montana experienced drought, which developed during the late spring and peaked during the summer, impacting crops and livestock.
- While corn and soybeans did well nationally in 2017, it was a rough year for crops and livestock in the High Plains. In Kansas and Nebraska, winter wheat suffered due to the wet spring, and diseases such as wheat stripe rust, leaf rust, and Wheat Streak Mosaic Virus were reported by producers. In particular, a late-season winter storm dropped a heavy band of snow across the two states that knocked down wheat stands, and it killed thousands of cattle in Colorado. In June, cold temperatures caused frozen corn in South Dakota. In the Northern Plains, spring wheat did not fare well due to summer drought conditions. The drought dried up pastureland and created a hay shortage, forcing ranchers to find alternative feed or sell off livestock. In Nebraska, thousands of acres of corn were damaged during the fall due to a combination of conditions. High temperatures during pollination, followed by cooler temperatures in August led to heavy ears on weakened shanks, which made it easy for high winds in October to snap stalks and knock corn to the ground.
- Overall, temperatures were above normal throughout the High Plains in 2017. Temperature departures ranged from approximately 1.0-3.0 degrees F (0.6-1.7 degrees C) above normal in most areas, with the highest departures occurring in Colorado, where several locations had impressive annual temperature records. For instance, Alamosa and Akron had their warmest year on record, while it was the 2nd warmest for Grand Junction and 3rd warmest for Colorado Springs. Breaking it down by month, the greatest above-normal temperature departures occurred in February, March, July, and November, with all four months yielding record-breaking warmth across parts of the region. As was the case in 2016, average temperatures were influenced more so by warmer minimum temperatures than maximum temperatures. On the other hand, much of the region experienced below-normal temperatures in August, with several locations experiencing a top 10 coolest August on record.
- The following locations had notable temperature records during 2017:
- Laramie, Wyoming: 5th lowest temperature on record at -40.0 degrees F (-40.0 degrees C), January 6 (period of record 1948-2018)
- Denver, Colorado: earliest and latest 80.0 degrees F (26.7 degrees C) temperature on record, February 10 and November 27, respectively (period of record 1872-2018)
- Liberal, Kansas: earliest 90.0 degrees F (32.2 degrees C) temperature on record, February 11 (period of record 1893-2018)
- Valentine, Nebraska: 3rd highest temperature on record at 112.0 degrees F (44.4 degrees C), July 19 (period of record 1889-2018)
- Chadron, Nebraska: earliest fall freeze on record, September 6 (period of record 1942-2018)
- Cheyenne, Wyoming: latest 70.0 degrees F+ (21.1 degrees C) temperature on record, November 26 (period of record 1872-2018)
- The High Plains had a mix of wet and dry conditions in 2017. Above-normal precipitation occurred throughout Wyoming, Nebraska, eastern Colorado, and western Kansas, while it was dry in the Dakotas and western Colorado. Precipitation records were set for both wetness and dryness. For instance, Alamosa, Colorado and Goodland, Kansas had their 6th wettest and 8th wettest years on record, respectively, while it was the 3rd driest year on record for Grand Junction, Colorado and Dickinson, North Dakota, and 8th driest for Rapid City, South Dakota.
- Several months were particularly notable in terms of extreme precipitation, or lack thereof. For instance, January was very wet, setting several top 10 records for wettest and snowiest January. September was also quite wet, with heavy precipitation providing drought relief to the Northern Plains. Meanwhile, June, November, and December brought below-normal precipitation to much of the region, causing drought development and expansion. In May and October, the region was starkly divided by extremely wet and extremely dry conditions, setting records on both ends of the precipitation spectrum.
- It was a good year for mountain snowpack in Colorado and Wyoming, as the season got off to a favorable start and timely, ample precipitation enabled the snowpack to build. According to the U.S. Army Corps of Engineers, the reach of the Missouri River above Fort Peck Reservoir peaked on April 29th at 99 percent of normal, while the reach between Fort Peck and Garrison Reservoirs peaked on May 2nd at 148 percent of normal. Both reaches peaked about two weeks later than normal. The high snowpack caused spring flooding from runoff in several places, including the Wind River Indian Reservation in Wyoming. As for the current season, mountain snowpack got off to a good start in the Upper Missouri Basin. In fact, an early October snowstorm in the northern and central Rockies set new snowfall records and caused the greatest impacts in Montana. Wyoming snowpack also started off strong and remained above normal in the northwestern part of the state through December. However, Colorado snowpack got off to a very slow start, as warm and dry fall and early winter conditions inhibited the snowpack from building.
- While mountain snowpack was abundant last year, Plains snowpack was scarce in the southern and western portions of the region. This was mostly due to above-normal temperatures causing precipitation to fall as rain instead of snow. The following locations had a top 5 least snowiest season on record (defined as the period of July 2016-June 2017): Denver, Colorado (2nd least snowiest), Lincoln, Nebraska (2nd least snowiest), Wichita, Kansas (3rd least snowiest), Concordia, Kansas (3rd least snowiest), Omaha, Nebraska (3rd least snowiest), and Goodland, Kansas (5th least snowiest). However, the Northern Plains snowpack was excessive, causing flooding in North Dakota. This season's Plains snowpack started out below normal for many locations, although there is still plenty of time to catch up.
- The following locations had notable precipitation records during 2017:
- Alliance 1WNW, Nebraska: Highest 1-day snowfall total of 17.3 inches (44 cm), February 24 and highest 2-day snowfall total of 22.1 inches (56 cm), February 23-24 (period of record 1894-2018)
- Lander, Wyoming: Highest March 1-day precipitation total of 2.71 inches (69 mm), March 31 and 6th highest 1-day precipitation total on record (period of record 1891-2018)
- Contrary to 2016, drought was an issue in the region in 2017, impacting several areas but particularly the Northern Plains. At the beginning of the year, abnormally dry or drought conditions (D0-D4 intensity categories on the U.S. Drought Monitor map) were impacting about half of the High Plains region, including eastern Wyoming, western South Dakota, eastern Colorado, southwestern and central Nebraska, and western Kansas. This depiction changed very little throughout the winter months, and then conditions began to gradually improve throughout the spring, thanks to heavy precipitation in drought-stricken areas. Then, extremely dry conditions caused drought to develop in May in the Dakotas and eastern Montana, expanding and intensifying rapidly in June and July. In August, cooler and wetter weather provided some relief, while heavy rains in September vastly improved conditions. However, dryness returned in October, and with frozen soils and the growing season over, conditions changed very little throughout the rest of the year. Impacts from the drought were mostly agricultural in nature. Read more about the Northern Plains drought in the Noteworthy Events section.
- In the southern part of the region, a warm and dry fall caused drought to develop in western Colorado and southern and central Kansas. It was a slow start to the mountain snowpack season in Colorado, as statewide Snow Water Equivalent was only about 50 percent of median at the end of December. By the end of the year, 80 percent of the High Plains region was experiencing abnormally dry or drought conditions.
- Ice Storm in Kansas and Nebraska: An ice storm wreaked havoc on southeastern Nebraska and a large part of Kansas from January 14th-16th. A warm and moist air mass settled over frozen ground, creating a widespread freezing rain event. Ice up to 1.0 inches (3 cm) thick accumulated onto trees and power lines, causing them to snap. While ice storms are not uncommon in the region, this event was rather unusual for January in southeastern Nebraska because snow is the predominant form of precipitation in winter.
- Early-Spring Wildfires: A warm, dry end to winter and beginning to spring sparked wildfires across the High Plains in March that spread rapidly due to high winds. The most notable was the Northwest Oklahoma Complex fires, which burned parts of Kansas in early March. Several people and thousands of cattle were killed, and thousands of miles of fencing had to be replaced. It became the largest wildfire in Kansas' history, a record that was just set in 2016 by the Anderson Creek Fire. Fires also occurred in Colorado, South Dakota, and Nebraska.
- Late-Season Winter Storm: A powerful storm system impacted Colorado, Wyoming, Kansas, Nebraska, and southeastern South Dakota from April 28th-May 1st. One to two feet (30-61 cm) of snow fell across central Nebraska and western Kansas and damaged crops, particularly winter wheat, corn, and alfalfa. In Colorado, the heavy snow and cold temperatures killed cattle and put calves at risk.
- Denver Area Hail Storm: On May 8th, severe thunderstorms produced damaging hail in Denver, Colorado and the surrounding area. Hail of at least 2.0 inches (5 cm) in diameter was reported, damaging homes, businesses, and over 100,000 vehicles. While this event was localized in nature, insured losses exceeded $1.5 billion, and it was officially declared a Billion-Dollar Weather Disaster. It also became the most expensive hail storm in Colorado's history.
- Northern Plains Drought: Drought developed across North Dakota, South Dakota, and Montana during the late spring and rapidly intensified throughout the summer. Impacts were primarily agricultural in nature, as field crops were damaged and the lack of feed forced ranchers to sell off their livestock. The drought also contributed to an active wildfire season, particularly in Montana where over 1 million acres were burned.
- Legion Lake Fire in South Dakota: Warm, dry, and windy conditions contributed to the spread of the Legion Lake Fire, which ignited in December and burned more than 54,000 acres in the Black Hills, becoming the third largest fire in South Dakota's history. The fire burned in Custer State Park, which was forced to close temporarily due to damaged trails, roads, and fences. Wildlife was also impacted, as deer, elk, and buffalo perished in the fire.
- For more information, please go to the High Plains Regional Climate Center Home Page.
- Southern Region: (Information provided by the Southern Regional Climate Center)
- The year 2017 proved to be an extremely warm year for the Southern Region. Five of the six states in the Southern Region ranked in their top ten warmest years on record. The region as a whole had an average annual temperature of 65.55 degrees F (18.64 degrees C), making it the third warmest year on record. Temperatures were generally consistently above normal throughout the year. There were seven months where all six states averaged above normal temperatures. These months included February, March, April, July, October, November, and December. For the year there were areas in Texas, Louisiana, Oklahoma, Arkansas, and Mississippi that averaged between 3 to 4 degrees F (1.11 to 1.67 degrees C) above normal, and the majority of stations averaged at least 1 to 3 degrees F (0.56 to 1.67 degrees C) above normal. A few areas in Texas reported slightly below normal temperatures for the 2017 year. The state-wide average annual temperatures are as follows: Arkansas averaged 62.54 degrees F (16.97 degrees C), Louisiana averaged 68.77 degrees F (20.43 degrees C), Mississippi averaged 65.83 degrees F (18.79 degrees C), Oklahoma averaged 61.79 degrees F (16.55 degrees C), Tennessee averaged 60.05 degrees F (15.58 degrees C), and Texas averaged 67.38 degrees F (19.66 degrees C). The statewide temperature rankings for 2017 were as follows: Arkansas (seventh warmest), Louisiana (third warmest), Mississippi (seventh warmest), Oklahoma (eleventh warmest), Tennessee (fifth warmest), and Texas (second warmest). All state rankings are based on the period spanning 1895-2017.
- The 2017 annual precipitation totals indicate that precipitation for the year varied spatially over the Southern Region, but the values do not provide a clear picture of how precipitation varied temporally over the year. This is mostly because many areas within the region experienced periods of wet conditions, which were interrupted with dry spells and in the case of the fall, wide-spread drought. The year started drier than normal for the northern part of the region. March was a dry month for most of the region and abnormally dry conditions expanded into the Southern part of the region. In April, much needed rain came into the region and caused most of the region to return back to normal conditions. This was also the case in May; however, only Texas and Oklahoma experienced a drier than normal month. Conditions in June were slightly wetter than normal with Mississippi recording its fifth wettest June on record (1895-2017). July brought slightly drier conditions for the southern states (Texas, Louisiana, and Mississippi). In August, Hurricane Harvey made landfall and stalled over Texas, causing historic rainfall amounts throughout the region. All states, except Tennessee, recorded one of their top ten wettest Augusts on record. Texas had its wettest August on record while Louisiana had its second wettest. In fall, drought conditions developed across much of the northern and central part of the Southern Region, and by the end of November, extreme drought conditions were present in Arkansas. Welcomed rainfall in December helped alleviate some of the extreme drought conditions. By the end of the year, the amount of drought increased from approximately 49.54 percent areal coverage in the region to just under 74 percent. The state-wide average annual precipitation totals are as follows: Arkansas received 49.94 inches (1268.48 mm), Louisiana received 63.80 inches (1620.52 mm), Mississippi received 59.19 inches (1503.43 mm), Oklahoma received 38.55 inches (979.17 mm), Tennessee received 55.80 inches (1417.32 mm), and Texas received 30.31 inches (769.87 mm). The state-wide precipitation rankings for the year are as follows: Arkansas (fifty-second wettest), Louisiana (thirtieth wettest), Mississippi (forty-second wettest), Oklahoma (twenty-ninth wettest), Tennessee (thirty-fifth wettest), and Texas (thirty-fifth wettest). All state rankings are based on the period spanning 1895-2017.
- The Southern Region had its warmest winter on record in 2016-17. The temperature regime throughout the region in December was variable, with the northern part of the region reporting near normal or slightly below normal temperatures. The southern part of the region reported, on average, 2-4 �F above average for the month of December. In January most of the region reported above normal temperatures, with portions of Louisiana, Mississippi, and Tennessee experiencing 6-10 �F above normal temperatures. The panhandles of Texas and Oklahoma exhibited near normal temperatures. In February, there were no areas in the Southern Region that were below or near normal. The whole region averaged 2 �F above normal, with portions of each state reporting 9-12 �F above normal. Louisiana did not have any areas where there were below or near normal temperatures for either winter month. In the entirety of Winter 2016-17, Louisiana and Texas reported their warmest winter, Arkansas and Tennessee reported their second warmest winter, Mississippi reported its third warmest winter and Oklahoma reported its fifth warmest winter. Farmers are concerned about the crops throughout the region, with growing degree days and growing cycles being effected by the warm temperatures. For some farmers in southern Texas, the unseasonable warmth has them anxious to start farming their spring crops earlier than usual according to the Southwest FarmPress in February 2017. Some farmers already have their tractors out in hopes to get an early start on the planting year, which is many farmers optimal outcome.
- The western states in the southern region, Texas and Oklahoma, had wildfires burn through their area during March. The combination of dry air, drought, strong winds, and warm temperatures contributed to the wildfires. The March 14, 2017 drought outlook showed the panhandle of Oklahoma in extreme drought conditions along with most of Oklahoma in moderate and severe drought. The surrounding states were also in drought or abnormally dry conditions which did not help the situation. The wildfires burned more than 2 million acres during their duration. Much of the area burned impacted the large cattle industry in Texas and Oklahoma. The panhandles of Texas and Oklahoma were impacted the most by the wildfires. By late March, at least 7 people and over thousands of livestock died according to Reuters (2017). Damage estimates are over 6 million dollars for acreage that was burned in Texas alone. Kansas, Oklahoma, and Texas declared state of emergencies due to the wildfires. By late March and early April, most of the fires had been distinguished. Throughout the month of April and into May the drought conditions improved over Oklahoma and Texas. Oklahoma went from extreme drought in March to near normal conditions in May. Much needed rain over April and May improved drought conditions and decreased the fires as well as decreased the potential for more wildfires to form.
- On August 25th, Hurricane Harvey made landfall near Rockport, TX, as a category 4 hurricane with maximum sustained winds of 130 mph. Harvey became the first category 4 hurricane to make landfall in Texas since Carla in 1961. Port Aransas reported sustained winds of 110 mph with a gust to 132 mph. After landfall, Harvey virtually stalled before re-emerging into the Gulf of Mexico on August 28th. Harvey then made its final landfall in the early morning hours of August 30th, near Cameron, Louisiana. The intensity and slow movement of Harvey created a catastrophic combination of flooding, wind damage, and storm surge. Devastating flooding occurred in Houston and the Beaumont/Port Arthur area. Widespread storm totals of 40"+ inundated the Houston area. The highest reported total was 51.88" at Cedar Bayou near Highlands, TX. That total stands as the highest single storm total on record in the US, outside of Hawaii. On August 29th, the Port Arthur SE TX Regional Airport recorded 26.03" of rain. Heavy rainfall then spread into Louisiana with areas receiving over 20", including Bayou Conway, which received 22.25", and Bayou Toro, which received 20.62". Dr. John Nielsen-Gammon, Texas State Climatologist, summed up Harvey: 'Harvey is head and shoulders above all previous multi-day storms ever recorded in the United States. I examined 18 different combinations of storm lengths and area sizes . . . Harvey was the worst in all but one.' According to Dr. Nielsen-Gammon, the most impressive record was the five-day total over 10,000 square miles. 'For Harvey to average 34.72' over five days across that large an area is ridiculous. The previous all-time US record, set in Texas back in 1899, was estimated at 21.39. 'Harvey exceeded that record by 62%.'
- The Southern Region experienced a drier than normal autumn during September through November 2017. Autumn 2017 in the Southern Region ranked as the 12th driest, with a regional total of 5.58 inches of precipitation. Arkansas had its driest autumn on record (since 1895) and Louisiana had its fifth driest autumn on record. Three other states had drier than normal autumns as well, Texas (16th driest), Oklahoma (35th driest), and Mississippi (23rd driest). Tennessee was the only state in the Southern Region to report a wetter than normal autumn. Tennessee reported its 38th wettest autumn. Precipitation values for the month of September varied spatially throughout the Southern Region. The central part of the region received below normal precipitation whereas parts of the western and eastern part of the region received above normal precipitation. Central Louisiana, western Arkansas, southern Mississippi, eastern Oklahoma, and northeastern and southeastern Texas received less than 25 percent of normal precipitation. Most of Louisiana and Arkansas received 25 - 50 percent of normal precipitation. Louisiana had its driest September on record and Arkansas had its eighth driest September on record. Precipitation values for the month of October varied spatially throughout the Southern Region. Parts of western Tennessee, northern and central Mississippi, northeastern, central and southern Arkansas, northern, central, and southwestern Louisiana, south central Oklahoma, and central, southern, and western Texas received 50 percent or less of normal precipitation. There were a few areas of 5 percent or less of normal precipitation in central and western Texas and the panhandle of Oklahoma. Precipitation values for the month of November were below normal for most of the Southern Region. All of Arkansas and Oklahoma, most of Louisiana and Mississippi, and parts of Tennessee and Texas received 50 percent or less of normal precipitation. There were a few areas of 5 percent or less of normal precipitation in northern, western, and southern Texas, southeastern Louisiana, and northern and southeastern Oklahoma. In November, four states had one of their top ten driest Novembers ever recorded: Arkansas (fourth), Louisiana (tenth), Mississippi (third), and Oklahoma (fifth).
- On December 8th, 2017 snow fell throughout most of the region. Many areas in the southern part of the region accumulated over two inches of snow.
- For more information, please go to the Southern Regional Climate Center Home Page.
- Western Region: (Information provided by the Western Region Climate Center)
- The West experienced extreme weather and climate events in 2017. The exceptionally wet winter of 2016/2017 alleviated some of the impacts of one of the worst droughts on record in California and Nevada while producing widespread flooding and landslides. A record hot summer produced hazardous fire conditions and the heat, combined with dry conditions, caused severe drought to develop in Montana. Heat extremes and many large and destructive fires impacted the West throughout summer and well into autumn.
- At the start of the year, drought conditions persisted into a sixth year across the southern two-thirds of California and western Nevada. Approximately 63% of California and 34% of Nevada were experiencing moderate to exceptional drought conditions. The first two months of 2017 were much wetter than normal owing to many atmospheric rivers making landfall on the West Coast. The Sierra Nevada region was particularly impacted; Tahoe City reported its second wettest year on record at 59.3 in (1506 mm), 173% of normal. Conditions were favorable in many of these storms for moisture to 'spill over' into the Great Basin. Reno, Nevada, observed its wettest January on record and also its wettest year on record at 13.74 in (349 mm), 186% of normal. Records for Reno began in 1937. Moisture also made it to the Inland Northwest, where Stanley, Idaho, reported its wettest year on record at 25.99 in (660 mm), 212% of normal.
- As soils became saturated through the season, mudslides, landslides and flooding began to occur in many areas of the West. These impacts began in January in northern California and the Sierra Nevada, damaging homes and causing prolonged closures of many major roads. Washington and Idaho started observing significant impacts in March; Minidoka and Twin Falls experienced landslides and flooding that damaged over 80 homes. The wet winter contributed to a massive landslide near Big Sur, California, that buried Highway 1 in an estimated 1 million tons of debris. A large snowpack and avalanches also caused many building collapses and road closures around the West, most notably for locations in the Inland Northwest and the Sierra Nevada; Pocatello, Idaho, had its 5th snowiest year since records began in 1939, logging 70.3 in (179 cm). Several storms had very high snow levels, producing rain-on-snow flooding. Such flooding occurred in northern Nevada on the Truckee River in January, and on the Humboldt River in February, causing damage to structures situated along these rivers. In spite of the negative impacts of this anomalously winter, by March, none of Nevada and only 8% of California were classified as having moderate or worse drought conditions. With an above normal snowpack, most of California's reservoirs filled above historical average by the end of the snow melt season.
- April 1 snowpack was more than 175% of normal in the Sierra Nevada, more than 125% of normal in the Cascades and central Rockies, and near normal in the northern Rockies. As temperatures and solar radiation increased into spring and soils remained saturated, snowmelt flooding became a significant hazard for many western locations. Sustained high and near-record flows occurred on many streams and rivers, and minor flooding was reported along the Big Wood River in Hailey, Idaho, on the Truckee River near Tahoe City in California, and in the Mason Valley of western Nevada on the Walker River. Areas of Montana east of the Rockies typically see their wettest months of the year during the spring and summer. However, this year, conditions were much drier than normal. Glasgow reported its driest year in a 70-year record at 6.64 in (169 mm), 57% of normal. A lack of precipitation combined with above normal temperatures produced severe drought conditions. In June, the Montana governor declared a drought emergency in 19 counties in eastern Montana and on two Native American reservations. Range and pasture conditions were poor, and various crops such as oats, spring wheat, and sugar beets were suffering. By mid-August, 90% of the state was categorized as moderate to extreme drought in the US Drought Monitor. The autumn season brought above normal precipitation to the region, providing some relief. At the end of the year, 52% of the state was categorized as moderate or worse drought conditions.
- Summer temperatures were well above normal across much of the West. California and Nevada reported their warmest June-August on record, Oregon its second warmest, and Washington, Utah, and Arizona their third warmest such period on record. Death Valley, California, reported its hottest month on record in July at an average of 107.4 F (41.9 C), 5.2 F (2.8 C) above normal. This also sets the record for hottest month anywhere in the United States. Las Vegas, Nevada (72.4 F/22.4 C; 3.1 F/1.7 C above normal), Phoenix, Arizona (77.3 F/25.2 C; 2.3 F/1.3 C above normal) and Albuquerque, New Mexico (60.1 F/15.6 C, 3 F/1.7 C above normal) all reported their warmest years on record. Records for Las Vegas began in 1948, Phoenix in 1933, and Albuquerque in 1891. A late June heat wave caused grounding of regional aircraft in Phoenix, Arizona, and several hundred cattle perished in central California, overwhelming processing facilities.
- In many areas of the West, abundant fine fuels (grasses) that grew in response to the wet winter cured rapidly during the hot summer, creating hazardous fire conditions. What ensued was one of the most destructive and costly fire seasons on record. Over 12,000 structures were destroyed in U.S. wildfires this year, primarily in the West. The previous record in a calendar year is approximately 5,000. Over 10 million acres (4 million hectares) burned across the U.S. this year, compared to the 10-year average of 6.5 million (2.6 million hectares). The US Forest Service spent over $2 billion in fire suppression this year, the highest amount on record. Smoke from fires around the West impacted air quality in major metropolitan areas such as Seattle, Portland, and San Francisco as well as more remote locations. Large wildfires over the summer in Montana strained resources and produced persistent poor air quality. In October, northern California saw some of the state's most destructive fires on record occur during a strong, dry wind event known as a -Diablo wind. Collectively, the fires destroyed 5,643 structures and caused 30 deaths. The fire season continued into December for southern California, with persistent Santa Ana wind conditions and the ignition of several fires in southern California. The largest of these conflagrations, the Thomas Fire, grew to be California's largest fire in modern history by late December, burning over 280,000 acres (113,000 hectares) and destroying over 1,000 structures.
- The onset of autumn precipitation favored the Northwest and northern California, leaving the Southwest drier than normal. Additionally, the southern tier of the West did not experience the plentiful precipitation of the preceding wet season, and monsoon rains were lackluster for many locations. Arizona and New Mexico observed their warmest September-November on record, and Arizona reported its third driest such period. Several heat waves impacted the Southwest as well. San Francisco, California, recorded its all-time highest temperature in a 144-year record on September 1, when the temperature reached 106 F (41 C). Several Bay Area cities opened cooling centers for residents during this heat wave. In southern California, Los Angeles Department of Water and Power reported record high electricity demand on August 31. Subsequent significant heat waves impacted southern California and parts of the Southwest in October and November. The hot and dry conditions allowed for moderate to severe drought conditions to persist or expanded across Arizona, southern Utah, the Four Corners Region, and coastal southern California during autumn.
- Across the northern half of the West, an active storm track in November produced near to well above normal precipitation. However, for the Sierra Nevada and southern Cascades, the snow level was generally fairly high, so accumulations were confined to higher elevations. During December, a stubborn area of high pressure settled over the West, keeping much of the region drier than normal. December is typically the wettest month of the year at Blue Canyon in California's Sierra Nevada, but this year it only received 0.88 in (22 mm), 8% of normal. This dry start to the wet season raises concerns about a return to drought conditions for California, Nevada, and persistence and expansion of existing drought conditions across the Southwest in 2018.
- Average temperatures across the northern half of Alaska were warmer than normal during 2017, while the southern half was generally near normal. Some of the greatest temperature departures were observed along the North Slope. Utqia'vik (Barrow) observed its second warmest year on record, second to 2016, at 18.5 F (-7.5 C), 6.8 F (3.8 C) above normal. This was also the 3rd wettest year on record at Utqia'vik, with 8.32 in (211 mm), 184% of normal. Kotzebue had its 3rd warmest year on record at 26.9 F (-2.8 C), 4.2 F (2.3 C) above normal. These above normal temperatures and precipitation are related to the lack of sea ice; exposed seas moderate land temperature and allow for greater evaporation. This year featured the 8th lowest Arctic sea ice extent since 1979 and was also one of the lowest on record for the Beaufort and Chukchi seas. Many Interior Alaska locations recorded above normal precipitation, Fairbanks had its 12th wettest year on record at 14.47 in (368 mm), 134% of normal. Precipitation was near to slightly below normal across the southern half of the state.
- Precipitation averaged to slightly below normal across the state of Hawaii in 2017. A dry start to the year resulted in drought conditions developing by July. By October, 65% of the state was experiencing moderate or worse drought conditions, mostly on Big Island. A wetter period reduced this to 21% by the end of the year. On Kauai, Lihue observed 23.55 in (598 mm) for the year, 64% of normal and the 7th driest year on record. Temperatures across most of the state were slightly warmer (<1.2 F/0.7C) than normal. Sea levels were much higher than normal throughout much of the year for Hawaii. During king tide events, minor to moderate flooding occurred in low-lying coastal areas. Further west, 2017 precipitation was generally 80-110% of normal across the US-affiliated Pacific Islands. The northern Marshall Islands experienced very dry conditions to start the year; household rain tanks had gone dry by late April prompting the president of the Marshall Islands to declare a State of Emergency. Subsequent summer rainfall helped to alleviate these dry conditions. Temperatures were warmer than normal for many locations in Micronesia. Chuuk experienced its warmest year in a 104-year record at 83.4 F (28.6 C), 1.8 F (1 C) above normal. Kosrae and Pohnpei had their 3rd warmest years on record at 82.5 F/28 C (2.1 F/1.2 C above normal) and 82.1 F/27.8 C (1.2 F/0.7 C above normal), respectively. Records for Kosrae began in 1954 and Pohnpei in 1951.
- For more information, please go to the Western Regional Climate Center Home Page.