National Overview

November Highlights
November Temperature
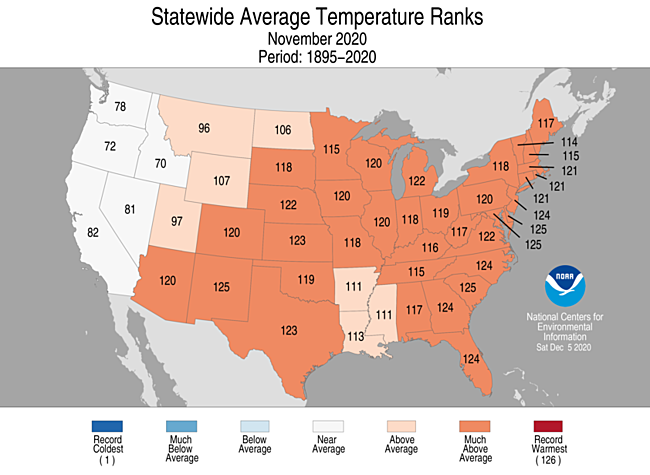
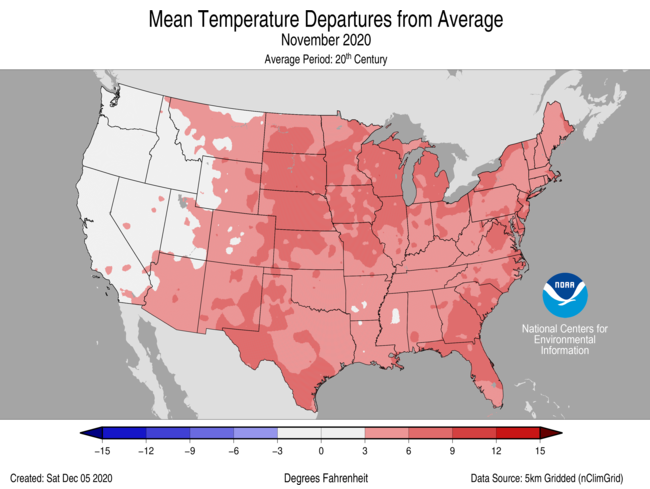
- The November contiguous U.S. average temperature was 46.4°F, 4.7°F above the 20th century average, ranking fourth warmest in the November record.
- Above-average November temperatures were observed across most of the Lower 48. New Mexico, South Carolina, Maryland and Delaware each had their second-warmest November on record with nine additional states from the South to the Northeast ranking among their warmest five Novembers.
- Near-average temperatures occurred across portions of the West and Northwest. No notable regions of below-average temperatures were present across the Lower 48 during November.
- The Alaska average November temperature was 14.3°F, 2.6°F above the long-term mean, ranking in the middle third of the 96-year period of record for the state. Above-average temperatures were present across portions of the North Slope and West Coast. Below-average temperatures were observed across the Southeast Interior, Northeast Gulf and the Panhandle. Utqiaġvik (Barrow) had its third-warmest while Nome experienced its fourth-warmest November on record.
- Sea ice extent across the Chukchi Sea for November was third lowest on record while the Bering Sea was second lowest.
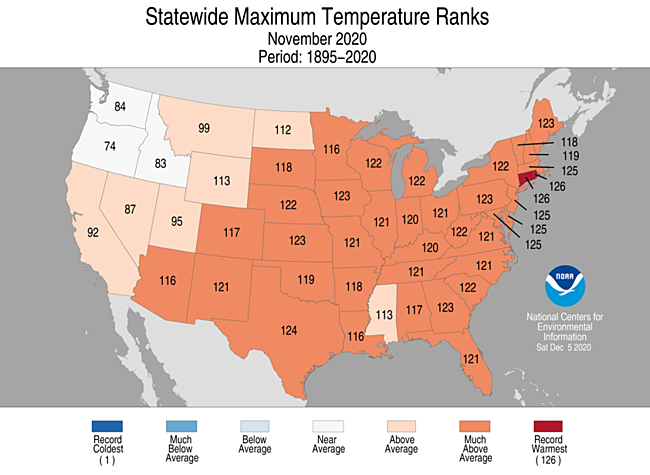
- The nationally averaged maximum temperature (daytime highs) was warmer than average during November at 58.4°F, 5.7°F above average, ranking fifth warmest in the 126-year record. Connecticut and Rhode Island ranked warmest for maximum temperatures in November with sixteen additional states from the Plains to the East Coast ranking among their warmest five Novembers for daytime high temperatures.
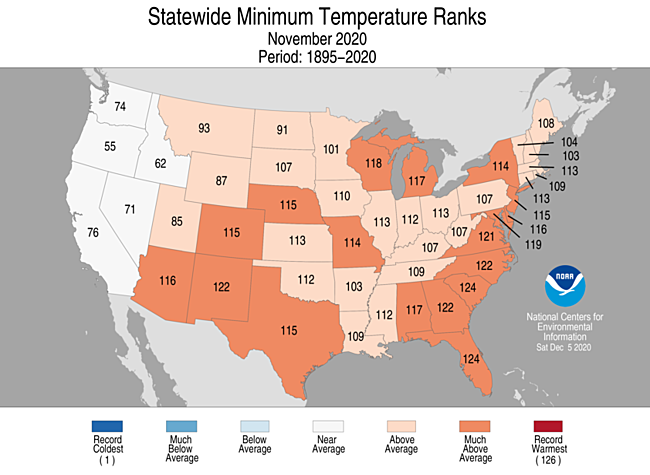
- The nationally averaged minimum temperature (overnight lows) during November was 34.3°F, 3.6°F above average, ranking sixth warmest in the 126-year record. Five States in the Southwest and Southeast ranked among their warmest five for November. Near-average overnight low temperatures were observed along the West Coast.
- As of December 10, there were 10,860 warm daily high (6,173) and low (4,687) temperature records tied or broken during November. This is approximately six-times the number of cold records reported during the month. Approximately 1,791 daily cold high (1,035) and low (756) temperature records were set during the month.
- Based on NOAA's Residential Energy Demand Temperature Index (REDTI), the contiguous U.S. temperature-related energy demand during November was 20 percent of average and ranked 4th lowest in the 126-year period of record.
November Precipitation
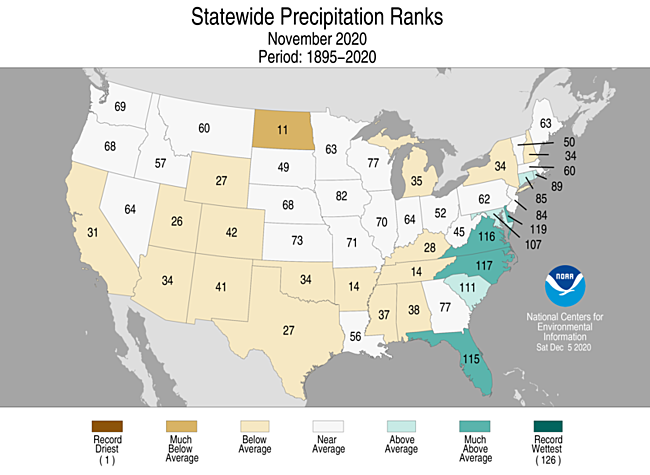
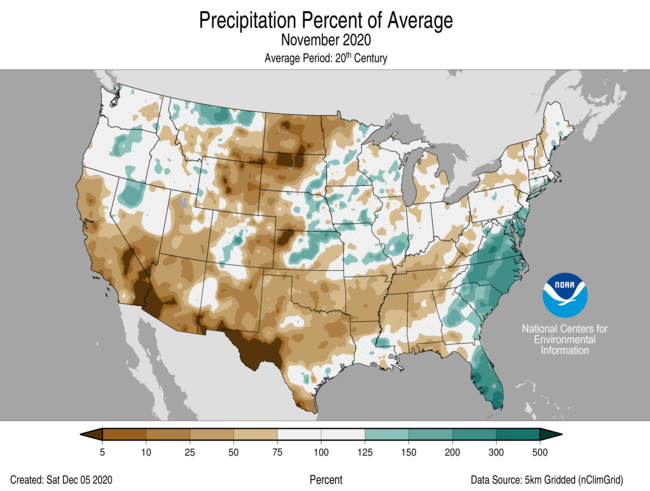
- The November precipitation total for the contiguous U.S. was 1.90 inches, 0.33 inch below average, ranking in the driest third of the 126-year period of record.
- A trough of low pressure in the middle of November contributed to above-average precipitation across portions of the Northwest, central Plains, western Great Lakes, Southeast and mid-Atlantic states. Precipitation received from Tropical Storm Eta helped North Carolina rank 10th wettest for November.
- Below-average precipitation occurred across parts of the West, northern Rockies, much of the northern Plains and from portions of the South to the Northeast. North Dakota ranked 11th driest for the month.
- In Alaska, statewide precipitation ranked in the wettest third of the historical record. Above-average precipitation occurred across portions of the North Slope, West Coast, Bristol Bay, Northeast Interior and South Panhandle regions. Ketchikan received more than 30 inches of rain for the month — their fifth highest November total on record. Precipitation across the rest of the state was near average for the month.
- According to the December 1 U.S. Drought Monitor, approximately 48 percent of the contiguous U.S. was in drought, up nearly 3 percent from the beginning of November. Drought conditions expanded or intensified across portions of the northern and central Plains, Deep South and much of the West. Drought severity and/or extent lessened across much of New England and Hawaii and parts of the Pacific Northwest.
Tropical Cyclones and Hurricanes
- Through November 30, and the official end of the Atlantic hurricane season, several records were tied or broken.
- Thirty named storms formed in the Atlantic, which breaks the previous record of 27 set in 2005. The 13 hurricanes and 6 major hurricanes in 2020 are both the second most on record behind 2005 (15 and 7, respectively).
- Twelve named U.S. storm continental landfalls occurred during 2020. This tops the 11 landfalls set through October 31 and breaks the previous annual record of nine landfalls set in 1916.
- Six hurricanes made U.S. landfall, tying 1886 and 1985 for the most U.S. hurricane landfalls in a single season.
- Category 4 Hurricane Eta made landfall near Puerto Cabezas, Nicaragua, on November 3 with winds of 140 mph. Eta weakened over land and eventually re-emerged into the Caribbean, making landfall in Cuba and eventually on the Lower Matecumbe Key in Florida as a tropical storm.
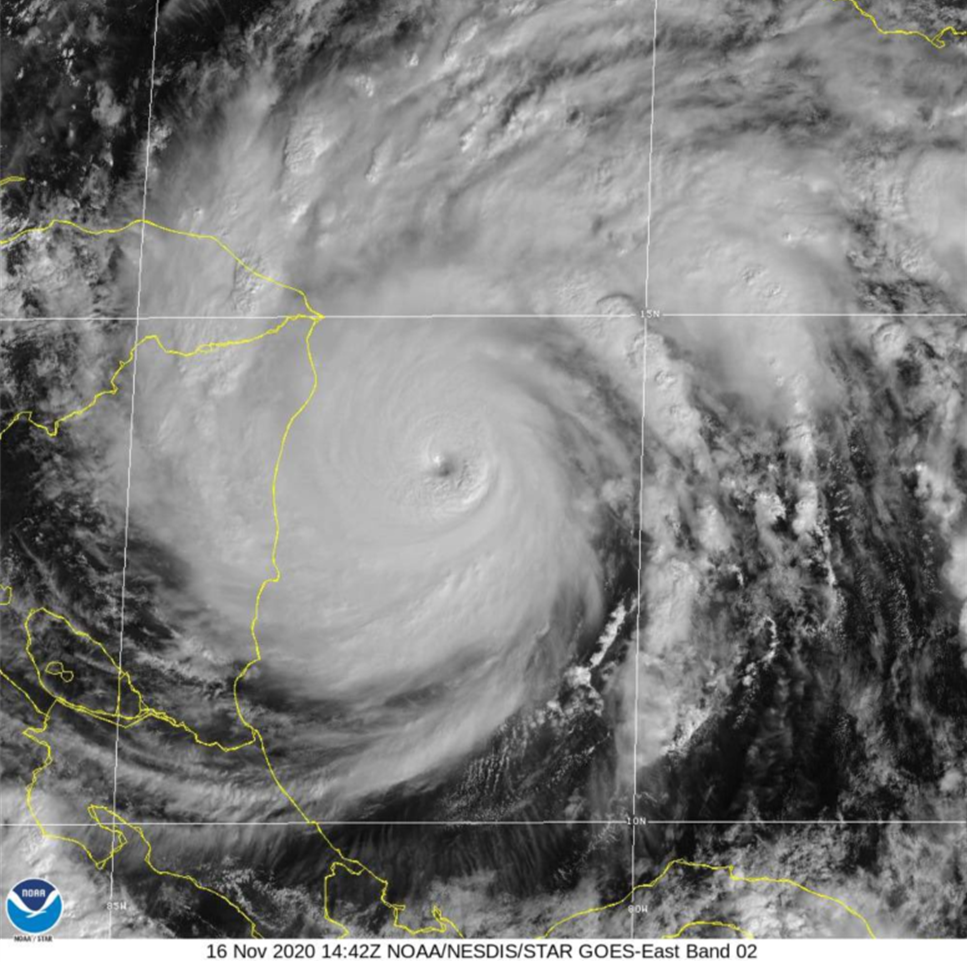
- Only two weeks after Eta’s landfall, category 5 Hurricane Iota reached peak intensity of 160 mph before weakening and making landfall along the northeast coast of Nicaragua as a Category 4 hurricane on November 16 and only 15 miles south of the location of Eta’s landfall. This was the first November on record to have two major Atlantic hurricanes.
- Iota was the only Category 5 storm during 2020, the strongest hurricane of the season and only the second Category 5 storm on record to form during November. The Cuba Hurricane of 1932 made landfall on November 8 and had 175 mph peak winds.
- Hurricane Iota was the second-strongest November hurricane on record for the Atlantic and was the strongest Atlantic hurricane on record to occur so late in the calendar year.
- This was a record fifth consecutive year with at least one Category 5 storm in the Atlantic.
- Five Category 4 and 5 storms formed in the Atlantic during 2020, tying with 1933, 1961, 1999 and 2005 for the record.
Fall Highlights
September-November Temperature
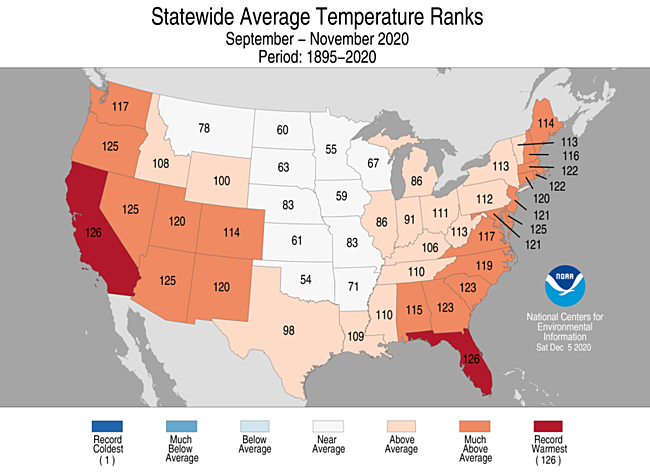
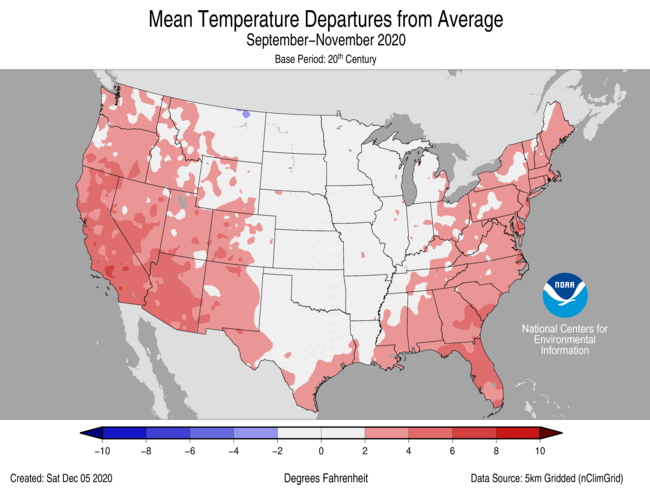
- During meteorological autumn (September-November), the average temperature for the Lower 48 was 55.5°F, 2.0°F above average, ranking 11th warmest in the historical record.
- Above-average autumn temperatures spanned much of the West and from the Deep South to New England. California and Florida ranked warmest on record.
- Near-average temperatures for autumn were observed across much of the northern and central Plains as well as the western Great Lakes.
- The Alaska statewide average temperature for autumn was 28.4°F, 2.5°F above average, ranking in the warmest third of the historical record. Northern and western portions of the state had above-average temperatures while portions of the Panhandle had temperatures that were below average for the season. In large part due to the loss and thinning of sea ice along Alaska’s northern coast, Utqiaġvik had its fourth-warmest autumn on record.
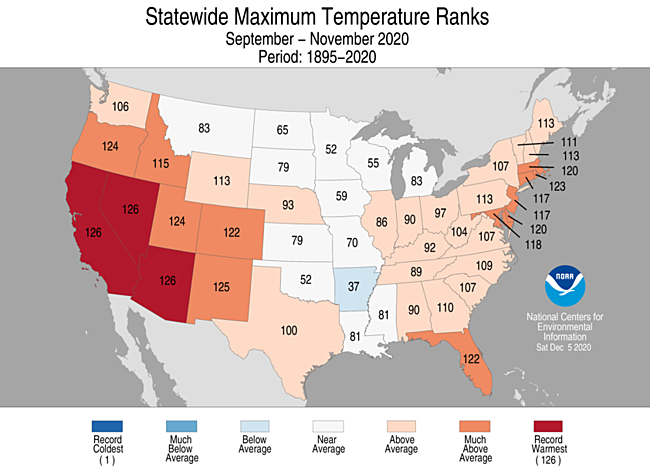
- The contiguous U.S. average maximum (daytime) temperature during September-November was 68.1°F, 2.3°F above average, ranking 11th warmest on record. Above-average maximum temperatures were observed across much of the West and from the Mississippi Valley to the East Coast. Daytime high temperatures across California, Nevada and Arizona ranked warmest for the autumn period. Below-average maximum temperatures were observed across portions of the northern and southern Plains.
- The contiguous U.S. September-November minimum (nighttime) temperature was 43.0°F, 1.6°F above average, and ranked 12th warmest on record. Above-average minimum temperatures were observed across much of the West and from south Texas to the Northeast. Florida ranked warmest for overnight temperatures during autumn.
- Based on NOAA's Residential Energy Demand Temperature Index (REDTI), the contiguous U.S. temperature-related energy demand during September-November was 38 percent of average and ranked as the seventh lowest value in the 126-year period of record.
September-November Precipitation
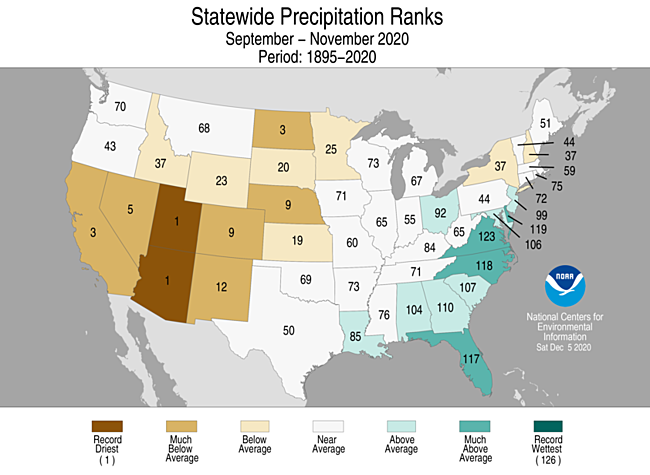
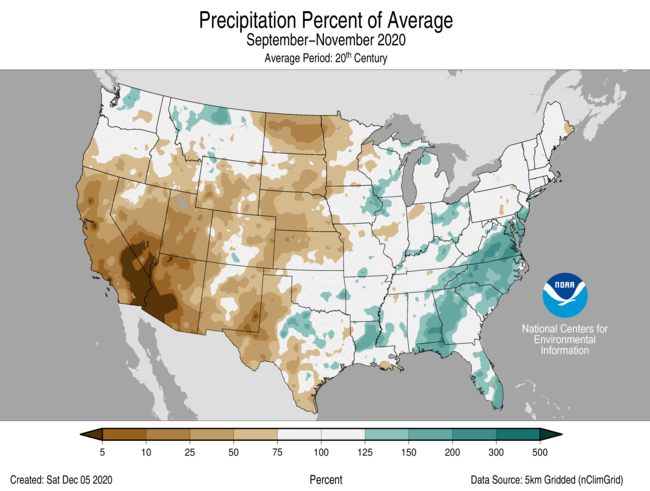
- The autumn precipitation total was 6.52 inches, 0.36 inch below average, ranking in the middle third of the historical record.
- Above-average precipitation was observed across the Southeast and mid-Atlantic as well as portions of the Northwest, South, Ohio Valley and Great Lakes. Virginia ranked fourth wettest on record.
- Below-average precipitation was observed across much of the West, the northern and central Plains and across parts of the Northeast. Utah and Arizona ranked driest on record for autumn with three additional states in the West and northern Plains ranking among their driest five autumns on record.
- Precipitation across Alaska during autumn ranked in the driest third of the historical record. Above-average precipitation occurred across portions of the North Slope, Northeast Interior and Bristol Bay regions while the Northeast Gulf and Panhandle regions had below-average precipitation for the season.
September-November Extremes
-
The U.S. Climate Extremes Index (USCEI) for autumn was 30 percent above the long-term average and ranked in the upper third of the 111-year period of record. On a national scale, elevated extremes in warm maximum and minimum temperatures as well as dry PDSI were widespread and contributed to this above-average value. The USCEI is an index that tracks extremes (falling in the upper or lower 10 percent of the record) in temperature, precipitation and drought across the contiguous United States.
- On the regional scale, the Southeast saw record extremes during autumn. Contributions were primarily due to warm maximum and minimum temperatures as well as wet PDSI, extremes in 1-day precipitation and the number of days with precipitation. The Southwest and West also saw above-average extent in extremes during this season. The Northern Rockies and Plains experienced below-average extremes during autumn.
Year-to-Date Highlights
January-November Temperature
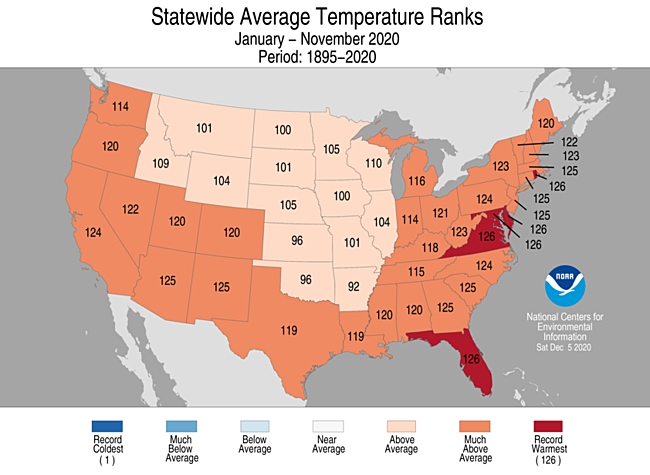
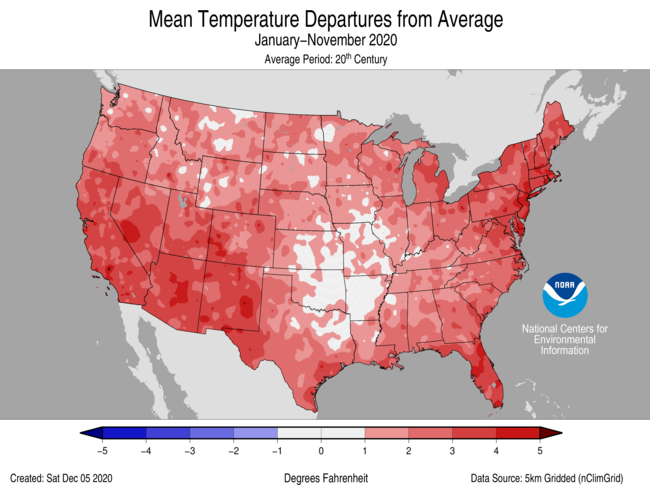
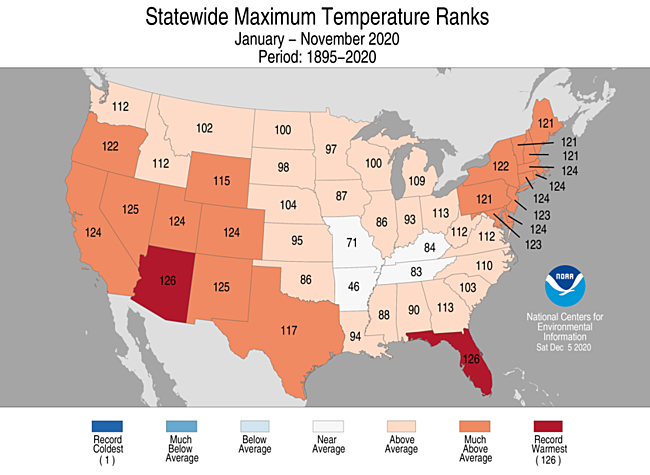
- For the year-to-date, the national temperature was 56.1°F, 2.3°F above average, ranking fourth warmest in the January-November record.
- Above-average year-to-date temperatures were observed across much of the Lower 48 with Florida, Virginia, Maryland, Delaware and Rhode Island ranking warmest on record.
- Near-average temperatures were observed in pockets across the northern Rockies, northern Plains as well as the southern Plains.
- It was the coolest January-November across Alaska since 2012. Year-to-date statewide temperatures ranked near average in Alaska with above-average temperatures observed across the northern and western portions of the state. Below-average temperatures were present across portions of the interior regions.
- The contiguous U.S. average maximum (daytime) temperature during January-November was 68.1°F, 2.2°F above the 20th century average, ranking sixth warmest in the 126-year record. Above-average maximum temperatures were observed across most of the Lower 48 with record warm maximum temperatures observed in Arizona and Florida. Near and below-average maximum temperatures were observed across portions of the Plains and Mississippi Valley.
- The contiguous U.S. January-November minimum (nighttime) temperature was 44.0°F, 2.4°F above average, and ranked fifth warmest on record. Above-average minimum temperatures were observed across most of the Lower 48 with pockets of below-average temperatures observed across the northern Rockies. Twelve states from the central Gulf coast to New England ranked warmest on record for this January-November period.
- Based on REDTI, the contiguous U.S. temperature-related energy demand during January-November was 42 percent of average and ranked seventh lowest in the 126-year period of record.
January-November Precipitation
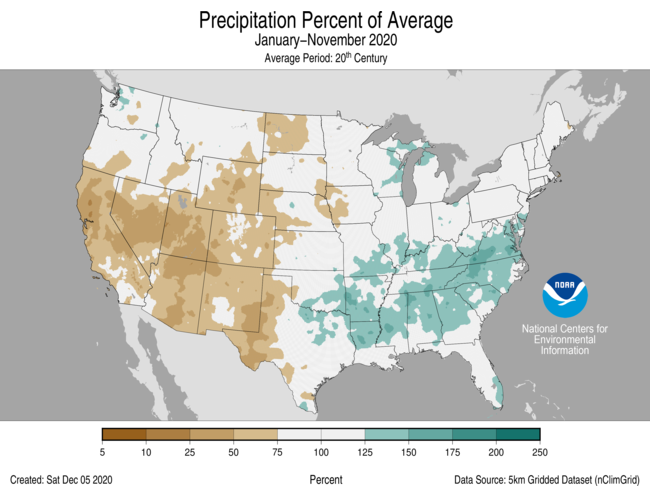
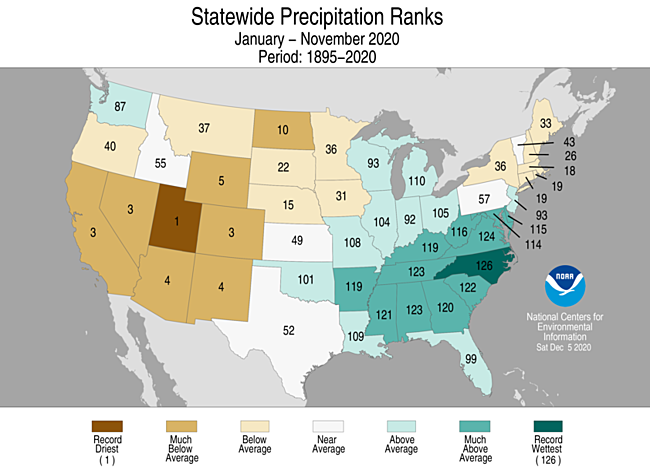
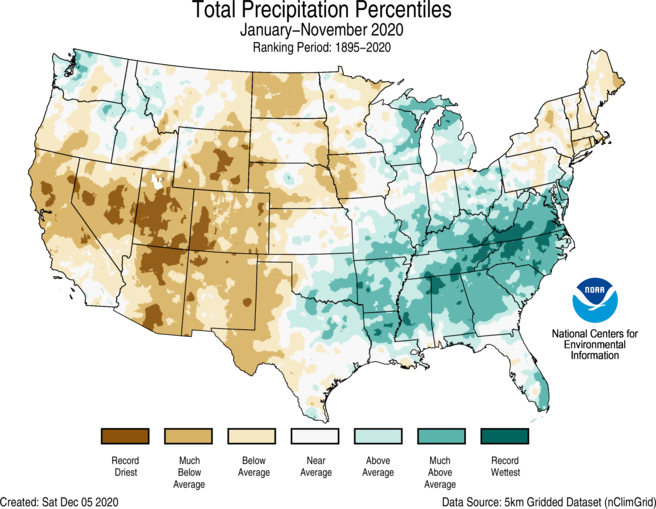
- The year-to-date precipitation total for the Lower 48 was 28.26 inches, 0.67 inch above average, ranking in the middle third of the record.
- Above-average January-November precipitation occurred in parts of the Northwest, Great Lakes and from the southern Plains to the mid-Atlantic. North Carolina ranked wettest on record while Virginia ranked third wettest for this 11-month period.
- Below-average precipitation occurred across much of the West, northern Plains and the Northeast. Utah ranked driest on record while six additional western states ranked among their driest five January-November periods.
- Portions of southern California, the Great Basin and the Desert Southwest have not received measurable precipitation (greater than a trace) since mid-April. Through November 30, the streak of dry days in Las Vegas reached 224. This breaks the record of 150 days set back in 1959. For Bishop, CA., it has been 227 days (previous record of 199 set in 2003) and in Needles, CA., 232 days have passed without measurable precipitation, breaking the previous record of 204 set in 2016.
- January-November precipitation in Alaska was above average across the interior regions, Bristol Bay and portions of the Panhandle. Drier-than-average conditions were present across the Aleutians as well as the central Gulf and northwest Panhandle.
Extremes
- The USCEI for the year-to-date was 77 percent above average and ranked in the upper third of the 111-year period of record. Extremes in warm maximum and minimum temperatures as well as both wet and dry PDSI contributed to this elevated value.
- On the regional scale, the Southeast experienced a record extent in extremes during this 11-month period. Extremes contributing to this record include record warm minimum temperatures, record high extremes in 1-day precipitation as well as extremes in warm maximum temperatures, wet PDSI and days with precipitation.
Regional Highlights
These regional summaries were provided by the six Regional Climate Centers and reflect conditions in their respective regions. These six regions differ spatially from the nine climatic regions of the National Centers for Environmental Information.
Northeast Region (Information provided by the Northeast Regional Climate Center)
- The Northeast had its ninth warmest November on record with an average temperature of 43.2 degrees F (6.2 degrees C), 3.7 degrees F (2.1 degrees C) above normal. All twelve Northeast states ranked this November among their 13 warmest on record: Delaware and Maryland, second warmest; New Jersey, fourth warmest; Connecticut, Pennsylvania, and Rhode Island, sixth warmest; Massachusetts, seventh warmest; New York and West Virginia, ninth warmest; Maine, 12th warmest; and New Hampshire and Vermont, 13th warmest. State average temperatures ranged from 3.0 degrees F (1.7 degrees C) above normal in New Hampshire to 4.5 degrees F (2.5 degrees C) above normal in Delaware and Maryland. LaGuardia Airport and Central Park, New York, recorded their warmest Novembers on record. Caribou and Portland, Maine, had/tied their hottest November day on record, while Burlington, Vermont, had its warmest November low temperature on record. Autumn 2020 ranked as the 11th warmest on record for the Northeast with an average temperature of 51.7 degrees F (10.9 degrees C), 1.9 degrees F (1.1 degrees C) above normal. All twelve states ranked this autumn among their 15 warmest on record: Delaware, second warmest; Massachusetts and Rhode Island, fifth warmest; Connecticut and Maryland, seventh warmest; New Jersey, eighth warmest; New Hampshire, 11th warmest; Maine, New York, Pennsylvania, and West Virginia, 14th warmest; and Vermont, 15th warmest. State average temperatures ranged from 1.4 degrees F (0.8 degrees C) above normal in Maine to 2.9 degrees F (1.6 degrees C) above normal in Delaware.
- November was drier than normal in the Northeast, with the region seeing 3.04 inches (77.22 mm) of precipitation, 79 percent of normal. Eight of the 12 Northeast states wrapped up November on the dry side of normal, with precipitation for all states ranging from 63 percent of normal in New Hampshire to 166 percent of normal in Delaware, its eighth wettest November on record. Autumn was also drier than normal in the Northeast, with the region seeing 9.88 inches (250.95 mm) of precipitation, 85 percent of normal. Nine states received below-normal precipitation, with amounts for precipitation for all states ranging from 77 percent of normal in New Hampshire to 140 percent of normal in Delaware, its eighth wettest autumn on record.
- The U.S. Drought Monitor released on November 5 showed 37 percent of the Northeast in an extreme, severe, or moderate drought and 24 percent as abnormally dry. Conditions generally improved in the region during the month. For instance, severe drought eased everywhere except southeastern New Hampshire and coastal Maine and moderate drought eased in a large portion of New England. However, extreme drought lingered in southeastern New Hampshire. The U.S. Drought Monitor released on December 3 showed 21 percent of the Northeast in an extreme, severe, or moderate drought and 33 percent as abnormally dry. Drought and abnormally dry conditions continued to have impacts. During November, streamflow and groundwater levels were below normal in some drought areas. Water restrictions remained in place for numerous locations in Massachusetts and several locations in Connecticut, Rhode Island, and Pennsylvania. As of December 2, 164 community water systems, eight municipalities, and some private well users in New Hampshire had restrictions in place. Since the start of dry conditions this spring, New Hampshire officials estimated at least 1,000 wells have gone dry, while Maine officials noted about 278 wells had gone dry. Drought conditions may have contributed to the collapse of an embankment and section of railroad track, which were located near a pond with unusually low water levels, in East Sandwich, Massachusetts. Reports of drought-related crop losses continued to come in. A farm on Martha’s Vineyard in Massachusetts lost around 60 percent of its pumpkin crop due in part to drought conditions and deer. Christmas trees in Rhode Island were impacted by the drought, with one farm losing 90 percent of its saplings and another farm noting some mature trees dropping more than 50 percent of their needles. At another Rhode Island Christmas tree farm, drought-stressed trees turned yellow and hundreds of saplings were a loss, causing the farm not to open for the upcoming holiday season. The hay crop has been reduced by up to 75 percent in New Hampshire. The potato crop in northern Maine is expected to be reduced by at least 20 percent.
- The Northeast experienced a period of unusual warmth from November 6 to 11. With high temperatures of up to 83 degrees F (28 degrees C), a few sites had/tied their hottest November day including Brockton, Massachusetts [80 degrees F (27 degrees C)]; Hemlock, New York [79 degrees F (26 degrees C)]; Caribou, Maine [75 degrees F (24 degrees C)]; and Portland, Maine [74 degrees F (23 degrees C)]. In fact, multiple days during the period ranked among the 10 warmest for November at several sites. For instance, Caribou not only had its hottest November day, it also recorded its second, fifth, and eighth hottest November days. Low temperatures ranging from 50 degrees F (10 degrees C) to 60 degrees F (16 degrees C) ranked among the 10 warmest for November at several sites, with Burlington, Vermont [60 degrees F (16 degrees C)], having its warmest November low temperature on record. From November 11 to 12, a frontal system fed by tropical moisture from the Atlantic Ocean and Tropical Storm Eta brought heavy rain to Maryland, Delaware, and southern New Jersey, with the greatest total of 7.50 inches (190.50 mm) in St. Mary's County, Maryland. The main impact was road closures due to flooding. A widespread wind event occurred on November 15. Wind gusts of 40 mph (18 m/s) to 80 mph (36 m/s) damaged buildings and downed trees and wires, leading to power outages. More than 185,000 customers lost power in Pennsylvania. The winds caused water levels to rise significantly along Lake Erie’s eastern shoreline, resulting in flooding near Erie, Pennsylvania, and Buffalo, New York. A complex storm system moved across the Northeast from November 30 to December 1. Up to 5 inches (127 mm) of rain fell, with the greatest amounts in northern and eastern Maine. Flooding in southeastern Pennsylvania, Delaware, and portions of New Jersey and Maryland led to road closures, stranded vehicles, and water rescues. Severe thunderstorms in these same areas downed trees and powerlines, as well as spawned three tornadoes: an EF-1 that snapped and uprooted trees in northern Maryland, an EF-0 that destroyed several barns in northern Maryland, and an EF-0 that damaged several buildings in southeastern Pennsylvania. Non-thunderstorm wind gusts of up to 70 mph (31 m/s) were recorded in New England and on New York’s Long Island, with reports of downed trees and wires. In addition, snow fell across portions of West Virginia, western Maryland, western Pennsylvania, and western New York. The greatest totals of over 12 inches (30 cm) were reported in northwestern Pennsylvania, with a location in Erie County picking up 22.5 inches (57.2 cm).
- For more information, please visit the Northeast Regional Climate Center Home Page.
Midwest Region (Information provided by the Midwest Regional Climate Center)
- November temperatures were warm across the Midwest. Average temperatures for the region were 43.5 degrees F (6.4 C) which was 5.0 degrees F (2.8 C) above normal. This ranked as the 7th warmest November on record (1895-2020) for the region. All nine Midwest states ranked among the warmest 10 percent of their respective November histories as well. Very warm conditions in the first third of the month led to more than 1,900 daily temperature records from the 3rd through the 11th. Fall temperatures were close to normal across the Midwest with all areas except the northernmost extents of the region falling within 2 degrees F (1 C) of normal. Cold temperatures in both September and October largely offset the warmer temperatures of November. The 3-month average temperature was 51.1 degrees F (10.6 C) which was 0.3 degrees F (0.2 C) below normal.
- November precipitation for the Midwest averaged 2.17 inches (55 mm) which was 0.60 inches (15 mm) below normal. The vast majority of the region had between 50 and 150 percent of normal precipitation for the month. Only a small area in northwestern Missouri topped 150 percent of normal. Only northwestern Minnesota and parts of southern Missouri and Kentucky had less than 50 percent of normal. Most of the region had alternating swaths of slightly above or below normal precipitation. Fall precipitation totals ranged from less than 50 percent of normal in northwestern Minnesota to just over 150 percent of normal along the Mississippi River on the Iowa-Wisconsin border. Precipitation totals averaged 8.30 inches (211 mm) for September through November which was 0.93 inches (24 mm) below normal.
- Snowfall in the Midwest was limited as warm temperatures and a lack of major storm systems decreased accumulation. Most of Wisconsin, Michigan and Iowa had less than half the normal amount of snowfall for November, while only a few areas in Minnesota were above normal. Lake-effect snowfall was limited in Upper Michigan as well, where less than half the normal amount fell. However, some moderate to heavy snow fell during a period from November 10th to 16th. Areas in northeastern Minnesota received more than 8 inches (20 cm) with Duluth, Minnesota receiving more than 16 inches (41 cm). This snowfall coincided with the only timeframe with significantly below-normal temperatures in the Upper Midwest.
- The decreased demand for water and well-placed precipitation led to slight decreases in drought coverage observed in the Midwest during November according to the U.S. Drought Monitor. The most prominent areas that improved were in southwestern Missouri, where drought and abnormal dryness was eliminated, and parts of western Iowa. However, extreme drought remained mostly unchanged in northwestern Iowa. Meanwhile, abnormally dry conditions and scattered moderate drought were introduced across most of Minnesota as drier conditions set in. In total, around one third of the region was either abnormally dry or in drought, with around 10 percent of the region in drought.
- innesota receiving more than 16 inches (41 cm). This snowfall coincided with the
- For further details on the weather and climate events in the Midwest, see the weekly and monthly reports at the Midwest Climate Watch page.
Southeast Region (Information provided by the Southeast Regional Climate Center)
- Temperatures were well above average across much of the Southeast region during November. Monthly mean temperatures were at least 3 degrees F (1.7 degrees C) above average for over 80 percent of the 185 long-term (i.e., period of record equaling or exceeding 50 years) stations across the region. In addition, about 25 percent (47 of 185) of the long-term stations observed monthly mean temperatures that were ranked within their three warmest values on record, including West Palm Beach, FL (1888–2020; second warmest), Augusta, GA (1874–2020; second warmest), Charleston, SC (1938–2020; second warmest), Elizabeth City, NC (1934–2020; second warmest), and Roanoke, VA (1912–2020; third warmest). Daily maximum and minimum temperatures were well above average across much of the region, as periodic influxes of tropical moisture enhanced daytime warming and suppressed nighttime cooling during the month. Pensacola, FL (1879–2020) observed its highest count of 13 days during November with a maximum temperature at or above 80 degrees F (26.7 degrees C), while Athens, GA (1902–2020) tied its highest count of 20 days during November with a maximum temperature at or above 70 degrees F (21.1 degrees C). Miami, FL (1895–2020) and Sarasota-Bradenton, FL (1911–2020) observed their second highest count of 25 and 11 days during November, respectively, with a minimum temperature at or above 70 degrees F. The warmest weather of the month occurred from the 8th through the 11th, as unusually warm, moist air surged westward off the Atlantic Ocean. Daily maximum temperatures exceeded 75 degrees F (23.9 degrees C) across much of the region, with several stations from Florida to Virginia reaching at least 85 degrees F (29.4 degrees C). On the 11th, Norfolk, VA (1874–2020) tied its second highest daily maximum temperature on record for November, at 85 degrees F. In addition, Greensboro, NC (1946–2020), Charlotte, NC (1941–2020), and Augusta, GA (1947–2020) recorded their highest hourly dew point temperature for November, at 73, 74, and 76 degrees F (22.8, 23.3, and 24.4 degrees C), respectively. Numerous long-term stations across the region observed their highest daily minimum temperature on record for November, including Tampa, FL (1890–2020; 78 degrees F, 25.6 degrees C), Savannah, GA (1874–2020; 76 degrees F), Charleston, SC (1938–2020; 74 degrees F), Charlotte, NC (1878–2020; 70 degrees F), and Charlottesville, VA (1893–2020; 66 degrees F, 18.9 degrees C). In contrast, the coldest weather of the month occurred on the 18th and 19th, as a continental high pressure system from the northwest settled over the region. Daily minimum temperatures fell below 40 degrees F (4.4 degrees C) across much of the region north of Florida, with numerous stations in North Carolina and Virginia reaching the 20s F (-6.7 to -1.7 degrees C).
- Precipitation was highly variable across the Southeast region during November, with numerous wet and dry extremes recorded. The driest locations were found across portions of Alabama, northwestern and southwestern Georgia, the Florida Panhandle, western North Carolina, southwestern Virginia, and north-central Puerto Rico. Monthly precipitation totals ranged from 50 to 25 percent of normal in these areas. Arecibo Observatory, PR (1980–2020) and Wise 1 SE, VA (1955–2020) observed their second and third driest November on record, with only 2.06 and 1.25 inches (52 and 32 mm) of precipitation, respectively. In contrast, the wettest locations were found across much of the Carolinas, Virginia, and the Florida Peninsula, as well as portions of central Georgia, Puerto Rico, and the U.S. Virgin Islands. Monthly precipitation totals ranged from 150 to more than 500 percent of normal in these areas. Numerous long-term stations observed November precipitation totals that were ranked within their three highest values on record, including Fort Lauderdale, FL (1912–2020; 17.39 inches, 442 mm), Sarasota-Bradenton, FL (1911–2020; 7.62 inches, 194 mm), Hickory, NC (1949–2020; 8.02 inches, 204 mm), and Lynchburg, VA (1893–2020; 8.51 inches, 216 mm). From the 8th through the 12th, Tropical Storm Eta produced 5 to more than 10 inches (127 to more than 254 mm) of rainfall across portions of west-central and southern Florida. On the 9th, Fort Lauderdale, FL (1912–2020) observed its third wettest November day on record, with 7.30 inches (185 mm) of precipitation. On the 11th, Sarasota-Bradenton, FL (1911–2020) observed its wettest November day on record, with 6.41 inches (163 mm) of rainfall. Numerous roads in the urbanized corridor of southeastern Florida became impassable due to flooding, with many reports of stalled or submerged vehicles. In Pinellas County, FL, sheriff deputies rescued 33 people from flooded homes and stalled vehicles. A man in Bradenton Beach, FL was electrocuted when he touched an appliance while standing in floodwater. On the 11th and 12th, the interaction of moisture surging northward from Tropical Storm Eta and an approaching cold front produced 3 to more than 8 inches (76 to more than 203 mm) of rainfall across much of the Carolinas and Virginia. A pocket of extreme rainfall occurred in the Rocky Mount-Wilson area of eastern North Carolina, with a 2-day total of 9.84 inches (250 mm) recorded at Rocky Mount-Wilson Regional Airport. On the 11th, Rocky Mount-Wilson Regional Airport, NC (2000–2020) observed its second wettest day for any month on record, with 6.02 inches (153 mm) of precipitation. On the 12th, Appomattox, VA (1937–2020) and Concord 4 SSW, VA (1950–2020) observed their second and third wettest day for any month on record, with 7.28 and 6.85 inches (185 and 174 mm) of precipitation, respectively. Hundreds of roads were flooded across these states, including the closure of I-95 near Wilson, NC. Dozens of swift water rescues were performed by emergency personnel, with five flood-related fatalities reported at a campground in Alexander County, NC. Several landslides occurred along the foothills of western North Carolina and southwestern Virginia. On the 30th, the first snowfall of the 2020–2021 winter season occurred across interior portions of the region, with a trace recorded as far south as Atlanta, GA and Birmingham, AL.
- There were only 25 severe weather reports across the Southeast during November, which is less than half of the median monthly frequency of 56 reports during 2000–2018. Over 90 percent (23 of 25) of the severe weather reports during the month were for strong thunderstorm winds. Only 2 tornadoes (1 EF-0 and 1 EF-1) were confirmed across the region during the month, which is much less than the median frequency of 11 tornadoes observed during November. Early on the 30th, an EF-1 tornado caused significant tree damage and minor structural damage to a home in Madison County, FL. On the 8th, Tropical Storm Eta made landfall on Lower Matecumbe Key, FL, with maximum sustained winds of 65 mph. Wind gusts exceeding 50 mph were observed across southern Florida, including 66 mph in Fort Lauderdale, 56 mph in Pompano Beach, and 53 mph in Marathon. Four days later, Tropical Storm Eta made a second landfall near Cedar Key, FL, with maximum sustained winds of 50 mph. Wind gusts exceeding 50 mph were observed in portions of west-central Florida, including 69 mph in Port Charlotte, 60 mph in Punta Gorda, and 55 mph in St. Petersburg.
- Drought conditions (D1 and greater) were not observed across the Southeast region during November. However, abnormally dry (D0) conditions expanded across portions of Georgia and southern Alabama during the month. In addition, two small pockets of abnormally dry conditions developed in central Puerto Rico by the end of the month. Periods of warm, dry weather during November allowed farmers in Alabama, Georgia, South Carolina, and the Florida Panhandle to harvest their cotton, peanut, and soybean crops. Some farmers in central Georgia continued to find boll rot on their cotton crop, which was caused by excessive rainfall during autumn. Row crop harvesting and cover crop planting were hindered in areas that received above-average precipitation, but the abundant rainfall was beneficial for the growth of winter grazing. Following the passage of Tropical Storm Eta, vegetable crops in southern Florida were severely damaged, with estimated costs ranging from $85 to as much as $320 million. The timing was particularly bad for farmers that were in the midst of harvesting a variety of vegetable crops bound for holiday tables, including sweet corn, green beans, lettuce, cabbage, and radishes. In parts of North Carolina, the soybean harvest was delayed due to heavy rainfall and flooding from Eta, while newly seeded livestock pastures sustained damage.
- For more information, please visit the Southeast Regional Climate Center Home Page.
High Plains Region (Information provided by the High Plains Regional Climate Center)
- November was warm and dry across much of the High Plains, resulting in below-normal snowfall and the expansion and intensification of drought conditions in many areas. The majority of the region entered the winter season with depleted soil moisture, with over 50 percent of topsoil and subsoil moisture rated as short to very short in all six High Plains states, according to the December 1st USDA Weekly Weather and Crop Bulletin. As soils freeze, what little moisture is available will be locked in place until spring, which is very concerning for spring planting. Drought impacts were evident throughout the region. Winter wheat was not faring well, with 38 percent of the crop in poor to very poor condition in Colorado, followed by 26 percent in Nebraska and 22 percent in Kansas. The continuation of drought conditions through the growing season resulted in poor pasture conditions in Colorado and Wyoming, which led producers to give supplemental feed to livestock this fall. Alfalfa and silage production were down in North Dakota as well. Given the lack of snow in November, the opening of the Aspen Highlands Ski Resort in Colorado was delayed, and competitive snowmobile events in North Dakota were cancelled.
- Despite warm and dry conditions, fire activity was lower in the region in November compared to October. The two largest fires burning in Colorado, the Cameron Peak Fire and the East Troublesome Fire, were both 100 percent contained by the beginning of December, thanks in part to a brief episode of cooler temperatures and snowfall in late October. Rocky Mountain National Park reopened many of its roads and trails, although the west side of the Park was still closed for public safety reasons. The two fires impacted approximately 30,000 acres, or 9 percent, of the Park. According to the Incident Information System (InciWeb), the Cameron Peak Fire and East Troublesome Fire collectively damaged or destroyed 590 residences and 451 outbuildings and commercial structures. The Mullen Fire, a large fire burning in the Medicine Bow National Forest on the Colorado/Wyoming state border, was 97 percent contained as of November 19th.
- November was warm throughout the High Plains, which was a dramatic change from the below-normal temperatures experienced in October. November temperature departures ranged from 2.0-8.0 degrees F (1.1-4.4 degrees C) above normal throughout most of the region, with the greatest departures occurring from central South Dakota southward through central Nebraska and northern Kansas. Numerous locations in the High Plains ranked among the top 10 of warmest Novembers (see the rankings table on page 6 for more details).
- It was especially warm during the first week of November. In many areas, daily temperature departures were 15.0-20.0 degrees F (8.3-11.1 degrees C) above normal, with highs exceeding 70.0 degrees F (21.1 degrees C). Locations experiencing their warmest first week of November on record included Casper, WY; Cheyenne, WY; Colorado Springs, CO; Denver, CO; Grand Island, NE; Rapid City, SD; Sioux Falls, SD; and Valentine, NE.
- Overall, fall temperatures were near normal throughout the High Plains, except for Colorado, where temperatures were well above normal. Temperatures were slightly above normal in southern Wyoming and central Nebraska, and slightly below normal in South Dakota, eastern North Dakota, and central Kansas. Colorado Springs, CO tied for its 6th warmest fall on record (period of record 1894-2020). However, fall temperatures were not generally record-breaking across the High Plains, as average temperatures masked the extremes that occurred. For instance, while September temperatures were within 2.0 degrees F (1.1 degrees C) of normal, October was quite cool and November was very warm.
- Persistent dryness throughout the region continued into November. For the majority of the High Plains, precipitation was less than 50 percent of normal. The only areas that received above-normal precipitation were pockets of western Wyoming and central Colorado, as well as eastern Nebraska and northeastern and central Kansas where precipitation exceeded 200 percent of normal. There were quite a few locations that ranked among the top 10 driest Novembers on record, including Casper, Wyoming and Laramie, Wyoming, which both tied for their driest (Casper period of record 1939-2020, Laramie period of record 1948-2020).
- Very few storm systems impacted the High Plains in November. However, portions of northeastern Nebraska and southeastern South Dakota were impacted by a winter storm on the 9th-10th. Following a warm week, a strong cold front came through and brought a variety of precipitation types, including freezing rain and snow. The freezing rain was most impactful, as it caused power outages, downed tree limbs, and slick roads. However, the liquid equivalent precipitation produced by the storm generally ranged from 0.50-1.50 inches (13-38 mm), which helped ease drought conditions in these areas.
- While northeastern Nebraska and southeastern South Dakota, as well as a few other localized areas, received a decent amount of snowfall in November, much of the region had very little snow. The following locations ranked among the top 10 least snowiest Novembers on record: Bismarck, ND (tied for least snowiest); Casper, WY (2nd least snowiest); Lander, WY (tied for 4th least snowiest); Lincoln, NE (tied for 6th least snowiest); and Pueblo, CO (tied for 6th least snowiest). It is interesting to note that every one of these locations received more snow in October than in November. For instance, Pueblo received 11.1 inches (28 cm) of snow in October but only a trace of snow in November.
- Fall precipitation was abysmal across the region, contributing to the expansion and intensification of drought conditions. Grand Forks, ND, Casper, WY, and Laramie, WY had their driest falls on record, with Laramie receiving a paltry 0.11 inch (3 mm) of precipitation, which was only 4 percent of normal. Other locations ranking among the top 10 driest falls included Rawlins, WY (5th driest); Goodland, KS (5th driest); Chadron, NE (7th driest); Colorado Springs, CO (7th driest); and Williston, ND (9th driest).
- Upper Missouri Basin mountain snowpack got off to a pretty good start this season. According to the U.S. Army Corps of Engineers, as of December 1st, Snow Water Equivalent (SWE) above Fort Peck Reservoir was 90 percent of average, while the reach between Fort Peck and Garrison Reservoirs was 99 percent of average. Mountainous areas of Colorado and Wyoming were not faring as well, with the exception of a few basins in northwestern Wyoming and south-central Colorado where SWE was near to above normal. However, it is still very early in the mountain snowpack season, and there is plenty of time for these areas to catch up. As for the Plains, this region was largely snow-free at the end of November. Warm and dry conditions throughout much of the month kept snow totals down across the region, and what little snow that did fall melted rather quickly.
- Both improvements and degradations in drought conditions occurred throughout the High Plains in November. According to the U.S. Drought Monitor, the area experiencing drought (D1-D4) increased from approximately 71 percent to 76 percent over the course of the month. However, the area experiencing abnormal dryness and drought (D0-D4) actually decreased from about 98 percent to 96 percent.
- Drought conditions worsened across northern and central Kansas, as well as southwestern Nebraska, due to persistent dryness in these areas. Extreme drought (D3) spread across northwestern portions of Kansas and southwestern Nebraska, while severe drought (D2) and moderate drought (D1) developed in northern and central Kansas and southeastern Nebraska. D2 also spread eastward into north-central North Dakota. Conditions worsened in western Colorado as well, with exceptional drought (D4) extending further into southwestern and northern areas of the state.
- Meanwhile, beneficial precipitation improved conditions in a few areas of the High Plains. Heavy rains, fueled in part by Gulf moisture in place from Hurricane Zeta, fell across southern Kansas at the end of October, leading to the removal of D1 and D0. Moderate to heavy precipitation eased drought conditions in eastern Nebraska, as areas of D2 were improved to D1. Beneficial precipitation also helped improve conditions in the western High Plains, including localized areas of western Wyoming and south-central Colorado.
- For more information, please visit the High Plains Regional Climate Center Home Page.
Southern Region (Information provided by the Southern Regional Climate Center)
- Temperatures for the month of November were above normal across the Southern Region. Parts of central and southern Arkansas, central Mississippi, and central Louisiana experienced temperatures 0 to 2 degrees F (0.00 to 1.11 degrees C) above normal. Parts of eastern, southern, and central Oklahoma, eastern and central Texas, and most of Arkansas, Louisiana, Mississippi, and Tennessee experienced temperatures 2 to 4 degrees F (1.11 to 2.22 degrees C) above normal. Parts of northern and eastern Arkansas, western and southern Mississippi, central and western Oklahoma, southeastern Louisiana, and northern, western, southern, southeastern, and eastern Texas experienced temperatures 4 to 6 degrees F (2.22 to 3.33 degrees C) above normal, while parts of central, southern, and western Texas experienced temperatures 6 to 8 degrees F (3.33 to 4.44 degrees C) above normal. The statewide monthly average temperatures were as follows: Arkansas – 54.10 degrees F (12.28 degrees C), Louisiana – 61.90 degrees F (16.61 degrees C), Mississippi – 58.20 degrees F (14.56 degrees C), Oklahoma – 53.60 degrees F (12.00 degrees C), Tennessee – 52.20 degrees F (11.22 degrees C), and Texas – 60.50 degrees F (15.83 degrees C). The statewide temperature rankings for November were as follows: Arkansas (sixteenth warmest), Louisiana (fifteenth warmest), Mississippi (sixteenth warmest), Oklahoma (eighth warmest), Tennessee (thirteenth warmest), and Texas (fourth warmest). The region as a whole experienced its ninth warmest November on record. All state rankings are based on the period spanning 1895-2020.
- Precipitation values for the month of November were primarily below normal across the Southern Region. Parts of eastern, central, and western Tennessee, northern Mississippi, northern Louisiana, eastern, southern, central, and western Oklahoma, northern, eastern, central, southern, and western Texas, and most of Arkansas received 50 percent or less of normal precipitation. Parts of western Tennessee, northern Mississippi, southwestern Arkansas, northwestern Louisiana, central and western Oklahoma, and northern, eastern, southern, and western Texas received 25 percent or less of normal precipitation, while parts of western and southern Texas received 5 percent or less of normal precipitation. In contrast, parts of southwestern Mississippi, southeastern Louisiana, and southern Texas received 110 percent or more of normal precipitation. The statewide precipitation totals for the month were as follows: Arkansas – 1.84 inches (46.74 mm), Louisiana – 3.52 inches (89.41 mm), Mississippi – 2.90 inches (73.66 mm), Oklahoma – 1.06 inches (26.92 mm), Tennessee – 1.90 inches (48.26 mm), and Texas – 0.90 inches (22.86 mm). The state precipitation rankings for November were as follows: Arkansas (fourteenth driest), Louisiana (fifty-sixth driest), Mississippi (thirty-seventh driest), Oklahoma (thirty-fifth driest), Tennessee (fourteenth driest), and Texas (twenty-seventh driest). The region as a whole experienced its twenty-first driest November on record. All state rankings are based on the period spanning 1895-2020. Drought and Severe Weather:
- At the end of November, drought conditions deteriorated considerably across the Southern Region. Exceptional drought conditions expanded and persisted across western and northwestern Texas, with new areas developing in southern Texas. Extreme drought conditions persisted across parts of Oklahoma and Texas, with new areas developing or expanding across western and southern Texas. However, extreme drought conditions improved slightly across western Oklahoma and northern Texas. Severe drought classifications expanded across western Oklahoma as well as northern, western, southern, central, and eastern Texas. Moderate drought classifications expanded or developed across southern Oklahoma, central and southwestern Arkansas, northwestern Mississippi, northwestern Louisiana, and much of Texas. However, parts of northern and western Oklahoma as well as northwestern Arkansas saw improvement, with moderate drought conditions shrinking or even being removed. There was an increase in the overall area experiencing abnormally dry conditions, with conditions developing or expanding across central, southern, and western Arkansas, northern and southern Mississippi, western Tennessee, southeastern and northwestern Louisiana, southeastern and central Oklahoma, and north-central Texas. There was slight improvement across northern Oklahoma and southeastern Mississippi as abnormally dry conditions contracted or were eliminated.
- In November, there were approximately 63 storm reports across Arkansas, Louisiana, Mississippi, Oklahoma, Tennessee, and Texas. There were 6 tornado reports, 15 hail reports, and 42 wind reports. Three states (Mississippi, Oklahoma, and Texas) tallied the most tornado reports (2), Oklahoma tallied the most hail reports (11), and Arkansas tallied the most wind reports (15). Oklahoma tallied the most reports (25) while Tennessee tallied the fewest (1). Three states reported tornadoes, two states reported hail (Oklahoma and Texas), and every state tallied at least one wind report. Each report was tallied over four days (November 14, 24, 25, and 27).
- On November 14, 2020, there were 16 wind reports across Arkansas, Oklahoma, and Tennessee. Four injuries were reported near Romance, Arkansas due to strong winds. A wind gust of 69 mph (111.05 kph) was reported near Marble City, Oklahoma.
- On November 24, 2020, there were 43 severe weather reports across Arkansas, Louisiana, Oklahoma, and Texas. There were four tornado reports, two each in Oklahoma and Texas. Five injuries were reported due to an EF-2 tornado near Arlington, Texas. A wind gust of 65 mph (104.61 kph) was reported near Krum, Texas, while wind gusts of 64 mph (103.00 kph) were reported near Cool, Texas and Gage, Oklahoma. Additionally, wind gusts of 60 mph (96.56 kph) were reported near Webster, Louisiana and Shreveport, Louisiana.
- On November 25, 2020, a tornado was reported near Hawkins Field, Mississippi. No injuries were reported.
- On November 27, 2020, an EF-1 tornado was confirmed near McComb, Mississippi. Winds were estimated around 100 mph (160.93 kph) and damage was reported at the McComb Airport.
- For more information, please visit the Southern Regional Climate Center Home Page.
Western Region (Information provided by the Western Region Climate Center)
- The storm track continued the trend from October of favoring the northern half of the West with areas of above normal precipitation and near-normal temperatures. The wettest locations relative to normal were in Oregon east of the Cascades and northern Montana. Dryness, above normal temperatures, and further drought expansion persisted in the southern tier of the West with little-to-no precipitation for southern California, southern Nevada, Arizona, and New Mexico.
- A record shattering dry streak continues for Las Vegas, Nevada where no precipitation occurred (normal for the month is 0.36 in or 9.1 mm). At the end of November, the record for consecutive days with no measurable precipitation stands at 227 at the Las Vegas airport which is far greater than the previous record of 150 days ending July 21, 1959. There have been 18 other Novembers since 1948 with zero precipitation at Las Vegas. The dryness extended south into Arizona with Phoenix receiving zero precipitation (normal is 0.65 in or 16.5 mm) which has occurred 16 other times since 1933. Dryness was accompanied by well above normal temperatures in Arizona and New Mexico. For Arizona, Phoenix was the 6th warmest at 67.8 °F (19.9 °C), +3.7 °F (+2.1 °C) above normal and Tucson was the 4th warmest at 64. 8 °F (18.2 °C), +4.2 °F (+2.3 °C) above normal.
- In California, one significant storm occurred in mid-November bringing up to 4-6 in of precipitation (more locally) to northwest California and the west slope of the northern Sierra Nevada which helped to ease wildfire concerns and build some early season snowpack. However, this storm has a strong rain shadow and also a sharp moisture gradient with the southern half of the state seeing no precipitation. Around the San Francisco Bay area Oakland had its driest November on record since 1970 with 0.19 in (4.8 mm; 7% of normal) logged and San Jose was the 12th driest since 1893 with 0.13 in (3.3 mm; 7% of normal). Wildfire concerns will continue into December for places that saw a lack of soaking rains, especially southern California.
- For many places throughout the West the climatological start of snow accumulation in the mountains typically begins in November. At the end of November, the Cascades of Washington and Oregon, the mountains in eastern Oregon, parts of the Northern Sierra Nevada, and northern Montana all had above normal snow water equivalent (SWE). The southern Sierra Nevada and Utah were well below normal SWE. It is early in the snow season and recovery to above normal SWE can happen relatively quickly in December if the storm track shifts further south.
- Drought conditions were still very present in the West at the end of November. Based on the United States Drought Monitor over 75% of the area in the West is in at least moderate drought (D1) with 22% of the area in exceptional drought (D4). Exceptional drought is present in Nevada, Utah, Arizona, and New Mexico. The combination of below normal precipitation, above normal temperatures, and lack of snowpack led to expansion of drought in California, Nevada, Arizona, New Mexico and Utah. Improvements were found in the Pacific Northwest and northern Rockies with drought removal in parts of Washington and Montana.
- In Alaska, temperatures were well above normal for the North Slope and western coastal areas with near normal to slightly below normal temperatures for the rest of the state. Precipitation was above normal in the south-central region, western Alaska, the North Slope, and southeast Alaska, with some areas of below normal precipitation in the Interior. Utqiagvik was warm and wet, relatively speaking, with the 3rd warmest November at 15.3 °F (-9.3 °C), +14.6 °F (+8.1 °C) above normal and 3rd wettest with 1.01 in (25.7 mm) of precipitation (481% of normal) with records beginning in 1901. Nome followed a similar pattern having its 4th warmest November at 25.3 °F (-3.7 °C), +8.4 °F (+4.7 °C) above normal and 7th wettest receiving 2.4 in (61 mm) of precipitation (197% of normal). In southeast Alaska, Ketchikan recorded 30.1 in (763.3 mm) of precipitation (181% of normal) making it the 5th wettest November since 1910. For the Interior, both Tanana and Northway received no precipitation; this has happened four other times since 1902 at Tanana and had never occurred before this year at Northway since records began in 1942.
- For Hawaii, the islands of Maui, Molokai, Lanai, and Oahu all saw below normal precipitation. Honolulu logged 0.16 in (4.1 mm; 7% of normal) making it the 6th driest November since records began in 1940. Kahului recorded 0.25 in (6.35 mm; 11% of normal) of rainfall coming in at the 12th driest on record and had its warmest November on record at 79.3 °F (26.3 °C), +3.3 °F (+1.9 °C) above normal. At the end of November 23% of the area of Hawaii was in drought with 3% in extreme drought. Significant Events for November 2020
- Wind driven wildfire outbreak in northern California and northwest Nevada:On November 17 a cold frontal passage near Reno, Nevada was accompanied by strong downslope winds and drove rapid spread of several new wildfires. The Pinehaven Fire started in the foothills just to the southwest of Reno and destroyed five homes with damage to over a dozen other structures. The Mountain View fire, which occurred about 100 miles south of Reno in the eastern Sierra Nevada, burned over 20,000 acres, killed one person, and destroyed many structures in the town of Walker, California.
- For more information, please go to the Western Regional Climate Center Home Page.