National Overview

February Highlights


February Temperature

- The contiguous U.S. average temperature during February was 36.5°F, 2.7°F above average, ranking in the warmest third of the record.
- Generally, temperatures were above average across much of the eastern half of the contiguous U.S., including parts of the northern High Plains, with below-average temperatures from the central Rockies to the West Coast.
- For the month of February, Virginia ranked warmest on record. Pennsylvania, Maryland, Ohio, West Virginia, Kentucky, North Carolina, South Carolina and Georgia each ranked second warmest while Delaware, Tennessee and Florida each ranked third warmest, with nine additional states experiencing a top-10 warmest February on record.
- The contiguous U.S. average maximum (daytime) temperature during February was 47.8°F, 3.0°F above the 20th century average, ranking in the warmest third of the record. Above-average maximum temperatures were observed across much of the eastern contiguous U.S., from the Plains to the East Coast, with near- to below-average temperatures from the Rockies to the West Coast. Pennsylvania and Georgia ranked warmest on record for daytime temperatures. Ohio, West Virginia, Virginia, Indiana, Kentucky, South Carolina and Florida ranked second warmest February on record for daytime temperatures, with 12 additional states experiencing a top-10 warmest event for the month.
- The contiguous U.S. average minimum (nighttime) temperature during February was 25.2°F, 2.4°F above the 20th century average, ranking in the warmest third of the historical record. Minimum temperatures were above average from the southern Plains to the East Coast and in parts of the northern Plains. Temperatures were near- or below-normal from the central Plains to the West Coast and in parts of the northern Plains. Virginia ranked warmest on record. Maryland, North Carolina, South Carolina and Georgia each ranked second warmest while Ohio, Kentucky and Tennessee each ranked third warmest, with 11 additional states experiencing a top-10 warmest February for nighttime temperatures.
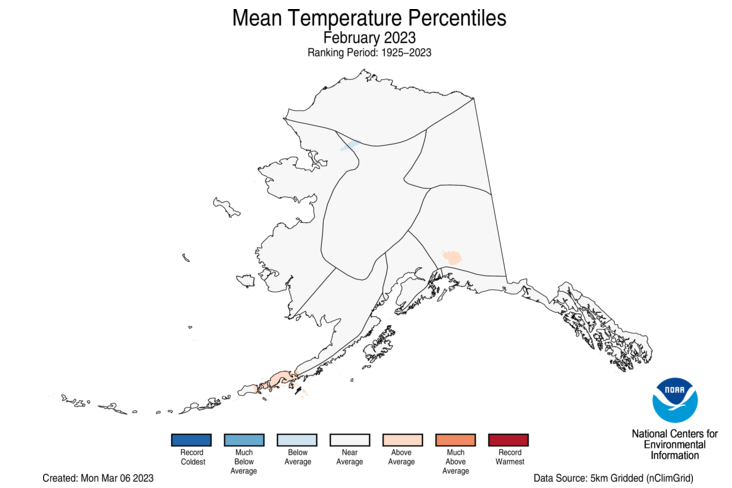
- The Alaska statewide February temperature was 5.9°F, 1.1°F above the long-term average. This February was in the middle third of the 99-year period of record for the state. Temperatures were near average for the month across almost the entire state.
- Based on NOAA's Residential Energy Demand Temperature Index (REDTI), the contiguous U.S. temperature-related energy demand during February was 38 percent of average and the 12th-lowest value in the 129-year period of record.
February Precipitation

- The February precipitation total for the contiguous U.S. was 1.97 inches, 0.16 inch below average, ranking in the middle third of the 129-year record.
- Precipitation was above average from parts of the southern Plains to the Great Lakes and in parts of California, the Southwest, northern Plains and central Appalachia. Precipitation was below average across much of the Northwest, Northeast, and in parts of the Southwest, Gulf Coast, Plains and Southeast.
- Wisconsin ranked fifth wettest while Iowa and Michigan ranked eighth wettest and 10th wettest for February, respectively. On the dry side, Connecticut and Rhode Island both experienced their seventh driest February while Massachusetts ranked as the eighth driest February in the 129-year record.
- Monthly precipitation averaged across the state of Alaska was 2.55 inches, ranking near normal in the 99-year record. Conditions were wetter than average across the North Slope, West Coast, eastern Interior and in parts of the Aleutians and Panhandle. Much of the central Interior, south central Alaska and the remainder of the Aleutians and Panhandle experienced near-average conditions while parts of southeast Alaska experienced below-average precipitation for the month.
- According to the February 28 U.S. Drought Monitor, about 38.5 percent of the contiguous U.S. was in drought, down about 4.2 percent from the end of January. Drought conditions expanded or intensified across portions of the Pacific Northwest, central Rockies, southern Plains, and Southeast. Drought contracted or was eliminated across large parts of the West and Plains, and portions of the Great Lakes, Southeast and Hawaii.
Other Notable Events
-
On February 3-4, a polar vortex accompanied by powerful winds swept across portions of the Northeast resulting in dangerously low temperatures, power outages and canceled flights.
- On February 3, the temperature at Mount Washington dropped to -47°F with a wind chill of -108°F - the coldest wind chill ever recorded for the United States.
- On February 4, Boston, Massachusetts set a new record low when temperatures dropped to -10°F at Logan International Airport. The previous record of -2°F was set in 1886.
- On February 4, Portland, Maine recorded its all-time lowest wind chill at -45°F.
-
February had several notable weather systems that brought severe thunderstorms and an unusually high number of tornadoes to portions of the United States.
- On February 8-9, a tornado outbreak occurred across portions of Louisiana, Alabama and the Florida Panhandle. A total of 10 tornadoes was confirmed by the National Weather Service, including two EF-2 tornadoes.
- On February 16-17, a tornado outbreak occurred across portions of the South. A total of 13 tornadoes, including two EF-2 tornadoes, was confirmed by the National Weather Service. The tornadoes caused damage in portions of Arkansas, Mississippi, Tennessee and Georgia.
- On February 21, an EF-2 tornado hit parts of central New Jersey, inflicting damage to an apartment complex in the suburbs of Trenton. This is the first February tornado to hit the state since 1999 and only the fifth since 1950.
- On February 26-27, a tornado outbreak occurred across portions of the South and Midwest. A total of 27 tornadoes, including three EF-2 tornadoes, was confirmed by the National Weather Service. The tornadoes caused damage in portions of Texas, Oklahoma, Kansas, Missouri, Illinois, Indiana and Ohio. A total of 11 of these confirmed tornadoes occurred in Oklahoma on February 26 - the highest number of tornadoes in February for the state since records began in 1950.
- A rare winter storm dumped heavy snow and record rainfall on portions of Southern California, prompting the National Weather Service to issue the first blizzard warning for the region since 1989.
- Ice cover in the Great Lakes was at a record low during mid-February with lake coverage at 7.5%, well below the historic average of 41%. By the end of February, ice cover increased to 14% of the Great Lakes, well below the historic average of 42%.
- A Kona Low, a type of cyclone which usually forms near the Hawaiian Islands during the winter months, brought 1-2 feet of rain to portions of the Big Island of Hawaii on February 17-19, resulting in life-threatening flash flooding, washed-out bridges, downed trees and power outages.
- Water levels at Lake Powell - the nation's second-largest reservoir - dropped to record lows in February, raising concerns for millions of Americans that rely on that system.
Winter Highlights


December-February Temperature

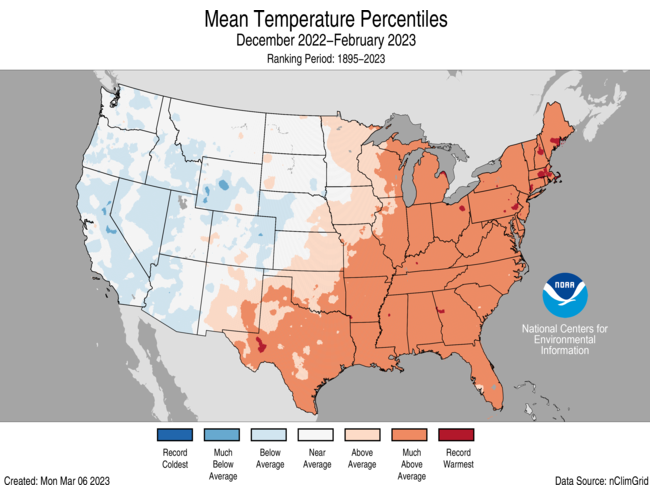
- The meteorological winter (December-February) average temperature for the Lower 48 was 34.9°F, 2.7°F above average, ranking 17th warmest on record.
- Winter temperatures were above average from the southern Plains to the East Coast. Temperatures were near- or below-normal from the northern and central Plains to the West Coast. Massachusetts had its warmest winter on record. Connecticut, New Jersey, Maryland, Ohio, West Virginia, Virginia and Kentucky ranked second warmest while 21 additional states ranked among their top-10 warmest winter seasons on record.
- The Alaska winter temperature was 8.1°F, 4.5°F above the long-term average, ranking in the warmest third on record for the state. Temperatures were above average across most of the state while parts of the Interior, south central Alaska and the Panhandle regions were near average for the season.
- The contiguous U.S. average maximum (daytime) temperature during December-February was 44.9°F, 2.2°F above the 20th century average, ranking in the warmest third of the record. Above-average daytime temperatures were observed across much of the eastern contiguous U.S., from the southern Plains to the Great Lakes and East Coast, with near- to below-average temperatures from the northern Plains to the West Coast. Ohio, West Virginia and Kentucky ranked second warmest while New Hampshire, Vermont, New Jersey, Pennsylvania, Maryland, Virginia and Indiana ranked third warmest, with 17 additional states experiencing a top-10 warmest Winter season for daytime temperatures.
- The contiguous U.S. average minimum (nighttime) temperature during December-February was 24.9°F, 3.1°F above the 20th century average, ranking 13th warmest on record. Above-average nighttime temperatures were observed across much of the eastern contiguous U.S., from the southern Rockies to the East Coast and in parts of the northern Plains, with near- to below-average temperatures from the northern Rockies to the West Coast. Massachusetts and Connecticut each ranked warmest on record for December-February nighttime temperatures. New Hampshire, Vermont, Rhode Island and Kentucky ranked second warmest while 22 additional states ranked among their top-10 warmest winter seasons on record for nighttime temperatures.
- Based on REDTI, the contiguous U.S. temperature-related energy demand during the winter season was 13 percent of average and the seventh-lowest value on record.
December-February Precipitation

- The U.S. winter precipitation total was 7.69 inches, 0.90 inch above average, ranking in the wettest third of the December-February record.
- Precipitation was below average across parts of the Northwest, southern Plains, Mid-Atlantic and Southeast. Conversely, an abundance of precipitation fell during the winter season from California to the Great Lakes, and in parts of the Mississippi, Tennessee and Ohio river valleys, Northeast and interior Southeast. Wisconsin ranked wettest while Minnesota ranked second wettest and Iowa ranked fourth wettest on record for the season. Four additional states experienced a top-10 wettest event while no state experienced a top-10 driest winter.
- For the winter season, precipitation ranked near-average for Alaska with wetter-than-average conditions observed across much of the North Slope, West Coast, eastern Interior and in parts of the Aleutians while much of the central Interior, south central, Southeast regions and parts of the Aleutians experienced near average precipitation for this period.
Extremes
-
The U.S. Climate Extremes Index (USCEI) for the winter season was 35 percent above average, ranking in the top third of the 113-year period of record. There were elevated extremes in warm maximum temperatures and warm minimum temperatures. The USCEI is an index that tracks extremes (falling in the upper or lower 10 percent of the record) in temperature, precipitation and drought across the contiguous United States.
- On the regional scale, the Northeast, Ohio Valley and Southeast ranked above average for the season. These regions experienced elevated extremes in warm maximum temperatures, warm minimum temperatures and record high extremes in one-day precipitation and days with precipitation during the season. In contrast, extremes were below average across much of the West. There was a general absence of extremes across the Northwest during winter and ranked second lowest for the season.
Year-to-Date Highlights


January-February Temperature

- For the January-February period, the average contiguous U.S. temperature was 35.8°F, 3.9°F above average, ranking 13th warmest in the 129-year record. Temperatures were above average across much of the conterminous U.S. with near- to below-average temperatures from the central Plains to the West Coast. New Hampshire, Massachusetts, Rhode Island, Connecticut, New York, Pennsylvania, New Jersey, Maryland, Delaware, Ohio, Kentucky and Virginia each had their warmest January-February period on record. Maine, Vermont, Indiana, West Virginia, Tennessee and North Carolina each had their second warmest while 12 additional states ranked among their warmest 10 year-to-date periods on record.
- The contiguous U.S. average maximum (daytime) temperature during January-February was 46.1°F, 3.5°F above the 20th century average, ranking 14th warmest in the historical record. Above-average temperatures were observed across much of the eastern contiguous U.S. and along parts of the northern Tier. Near- to below-average temperatures were observed from the central Plains to the West Coast. Massachusetts, Rhode Island, Connecticut, New Jersey, Maryland, Delaware, Pennsylvania, Ohio, Kentucky, Virginia and Florida each ranked warmest on record for daytime temperatures during January-February. Indiana, West Virginia, Tennessee and North Carolina ranked second warmest while 13 additional states experienced a top-10 warmest event for this period.
- The contiguous U.S. average minimum (nighttime) temperature during this two-month period was 25.5°F, 4.2°F above the 20th century average, 12th warmest in the historical record. Above-average nighttime temperatures were observed across much of the eastern contiguous U.S., from the Plains to the East Coast and in parts of the Northwest and northern Rockies. New Hampshire, Massachusetts, Rhode Island, Connecticut, New York, New Jersey, Maryland, Delaware and Virginia each ranked warmest on record for nighttime temperatures. Vermont, Michigan, Pennsylvania, Ohio, Indiana, Kentucky, Tennessee and Arkansas each ranked second warmest with 12 additional states experiencing a top-10 warmest event for nighttime temperatures during the January-February period. Nighttime temperatures with near- to below-average from the central Rockies to the West Coast.
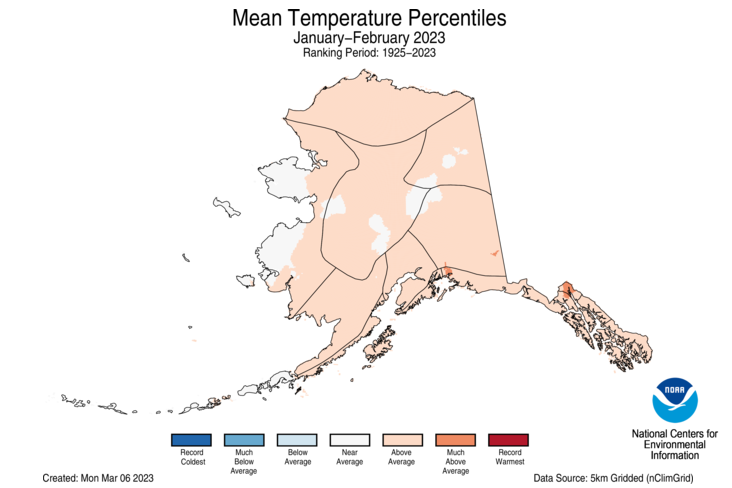
- The Alaska January-February temperature was 8.5°F, 5.0°F above the long-term average, ranking in the warmest third of the record for the state. Above-average temperatures were observed across the vast majority of the state with parts of the Interior and Western Alaska experiencing near-average temperatures for this two-month period.
- Based on REDTI, the contiguous U.S. temperature-related energy demand during January-February was seven percent of average and was the second-lowest value on record.
January-February Precipitation

- The January-February precipitation total for the contiguous U.S. was 4.90 inches, 0.45 inch above average, ranking in the wettest third of the historical record.
- Precipitation was above average from California to the Upper Midwest, Mississippi and Tennessee river valleys, and in parts of the Ohio River Valley, Northeast and Southeast. Precipitation was below average across parts of the Northwest, northern and southern Plains, Mid-Atlantic and Florida during the January-February period.
- Iowa ranked second-wettest on record while Wisconsin ranked fourth and Nebraska ranked fifth wettest on record. North Dakota ranked ninth driest and Oregon ranked 11th driest for this two-month period.
- The January-February precipitation ranked in the middle third of the 99-year record for Alaska, with above-average precipitation observed across much of the North Slope, West Coast, eastern Interior while the southern Panhandle was much wetter-than-average. The central Interior and parts of the Southwest and Southeast were near-average while the Northwest Gulf and parts of the Aleutians experienced below-average precipitation during this period.
Extremes
-
The U.S. Climate Extremes Index (USCEI) for the year-to-date period was 38 percent above average and ranked in the upper third of the 113-year period of record. Extremes in warm maximum temperatures and warm minimum temperatures were the major contributors to this elevated CEI value. The USCEI is an index that tracks extremes (occurring in the upper or lower 10 percent of the record) in temperature, precipitation and drought across the contiguous United States.
- On the regional scale, the Southeast ranked above average while the Northeast and Ohio Valley ranked second highest for this year-to-date period. All of these regions experienced elevated extremes in warm maximum temperatures, warm minimum temperatures. The Northeast and Ohio Valley also experienced elevated extremes in one-day precipitation. Conversely, extremes across the Northwest were 75 percent below average and the Northern Rockies and Plains was 60 percent below average ranking as their 16th and 18th lowest year-to-date period on record, respectively.
Monthly Outlook
- According to the February 28 One-Month Outlook from the Climate Prediction Center, areas from the southern Plains to the south Atlantic and much of western Alaska and the Alaska Peninsula favor above-normal monthly mean temperatures in March, with the greatest odds in Florida. The best chances for below-normal temperatures are forecast from the West Coast to the Northeast and in southeast Alaska. Much of the western U.S., northern Plains and Midwest as well as western Alaska are favored to see above-normal monthly total precipitation. Below-normal precipitation is most likely to occur across portions of the Upper Midwest and southeast Alaska. Drought improvement or removal is forecast for much of California and the Great Basin, while persistence is more likely for parts of the Pacific Northwest, northern Rockies, and Great Plains. Drought development is likely across the Florida Peninsula and parts of Texas.
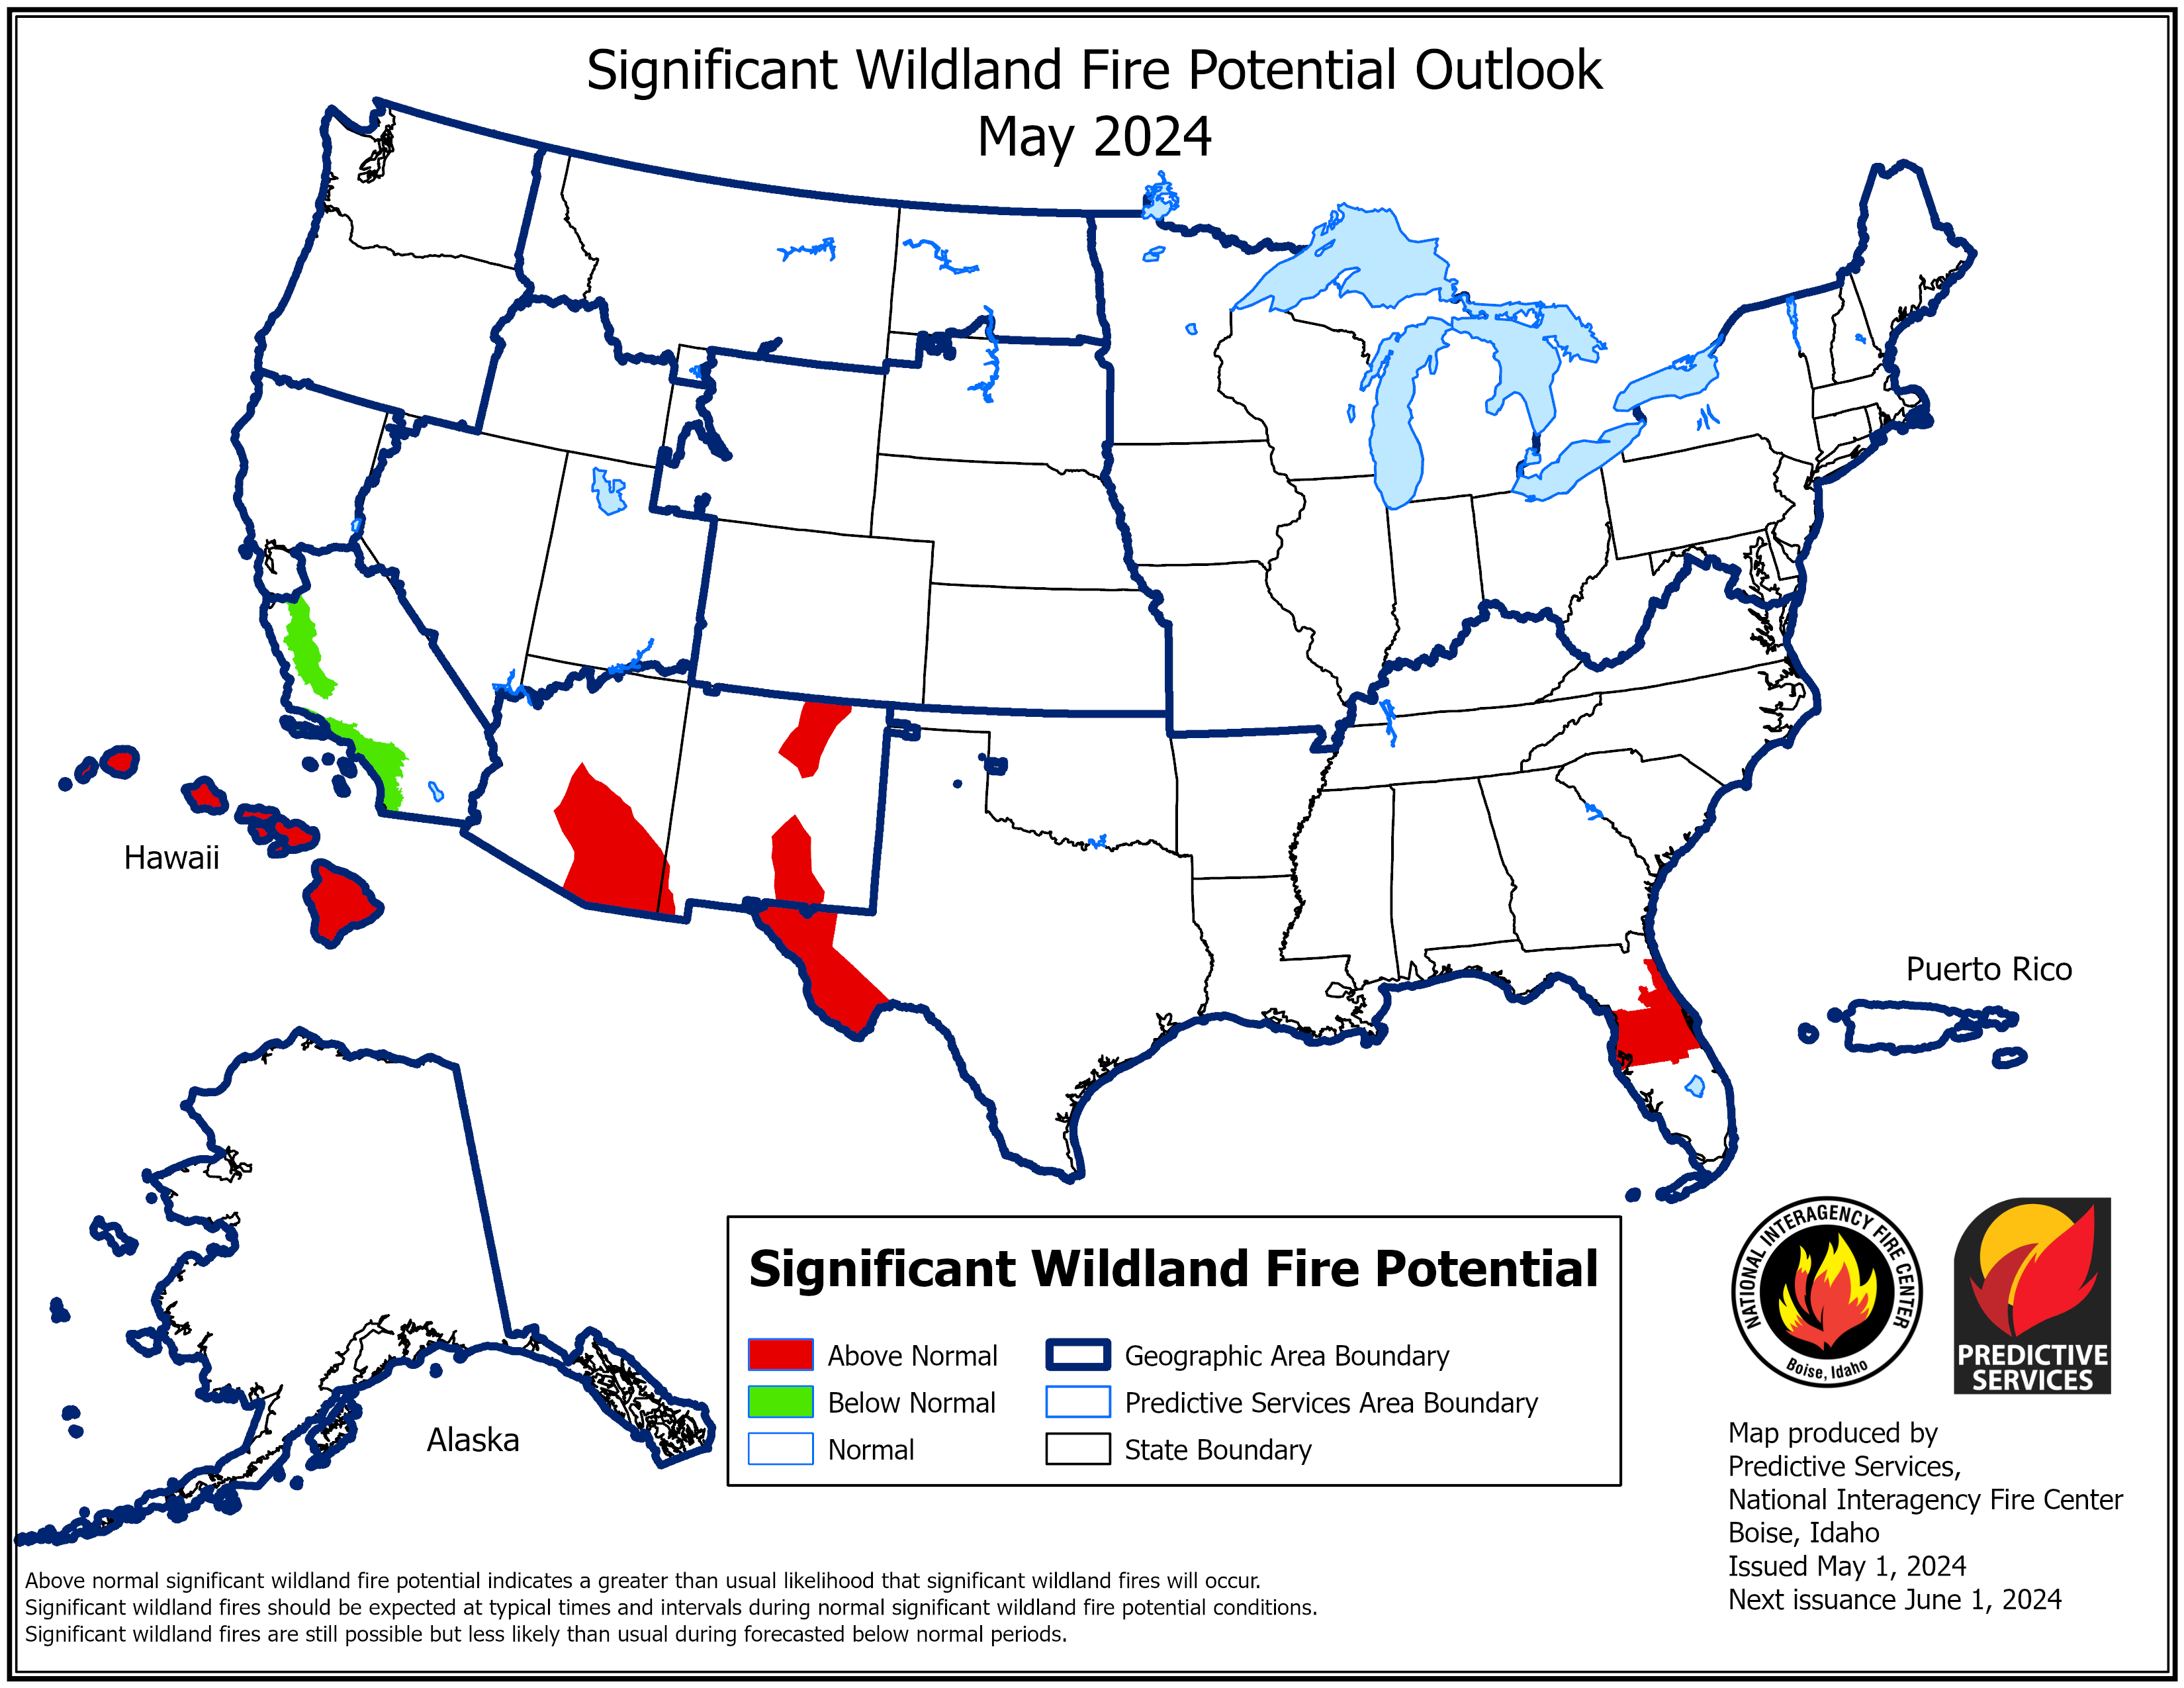
- According to the One-Month Outlook issued on March 1 from the National Interagency Fire Center, portions of New Mexico, Texas, Georgia and Florida have above normal significant wildland fire potential during March, while the Tennessee River Valley and parts of the Mississippi River and Ohio River valleys are expected to have below normal potential for the month.
Regional Highlights
These regional summaries were provided by the six Regional Climate Centers and reflect conditions in their respective regions. These six regions differ spatially from the nine climatic regions of the National Centers for Environmental Information.
Northeast Region (Information provided by the Northeast Regional Climate Center)
In the Northeast, February and winter were unusually warm and featured below-normal snowfall.
Temperature
The Northeast had its fourth warmest February since 1895 with an average temperature of 32.1 degrees F, 5.7 degrees F above normal. Average temperature departures for the 12 Northeast states ranged from 2.5 degrees F above normal in Maine to 7.3 degrees F above normal in West Virginia. This February ranked as the second warmest on record for Maryland, Massachusetts, New Jersey, Pennsylvania, and West Virginia. Meanwhile, Delaware had its third warmest February and Connecticut had its fourth warmest. New Hampshire, New York, Rhode Island, and Vermont had their seventh warmest February, while Maine had its 17th warmest. Baltimore, Maryland, had its warmest February on record at 44.7 degrees F, beating the old record of 44.2 degrees F from 2017. On February 16, Islip, New York, and Bridgeport, Connecticut, had their warmest high temperatures for February with highs of 71 degrees F and 68 degrees F, respectively. On the same day, LaGuardia Airport, New York, and Worcester, Massachusetts, tied their warmest low temperatures for February with lows of 54 degrees F and 49 degrees F, respectively. Winter 2022-23 was the warmest winter since recordkeeping began for the Northeast. The region's average temperature of 31.9 degrees F was 5.2 degrees F warmer than normal. State average temperature departures for winter ranged from 4.1 degrees F above normal in Delaware to 6.1 degrees F above normal in Vermont. It was the warmest winter on record for Connecticut, Massachusetts, New Hampshire, and New Jersey. This winter ranked as the second warmest on record for Maine, Maryland, Rhode Island, Vermont, and West Virginia and as the third warmest for Delaware, New York, and Pennsylvania. Two major climate sites experienced their warmest winter on record. The average winter temperature of 41.3 degrees F at Dulles Airport, Virginia, beat the old record of 40.8 degrees F from winter 2016-17. Meanwhile, Worcester, MA, had an average winter temperature of 33.7 degrees F, surpassing the previous record of 33.1 degrees F from winter 2001-02. Two sites recorded their warmest high temperatures for winter, with Beckley, WV, reaching 77 degrees F on February 22 and Dulles Airport, VA, recording 80 degrees F on February 23.
Precipitation
The Northeast experienced its seventh driest February since records began in 1895, seeing 1.54 inches of February precipitation, or 56 percent of normal. February precipitation for the 12 Northeast states ranged from 26 percent of normal in Connecticut to 90 percent of normal in West Virginia. This February ranked among the 20 driest Februarys for 11 states: Connecticut, third driest; Rhode Island, fourth driest; New Jersey, fifth driest; Maine and Massachusetts, seventh driest; New Hampshire and Pennsylvania, eighth driest; Delaware, 10th driest; New York, 14th driest; Vermont, 15th driest; and Maryland, 16th driest. The Northeast picked up 10.02 inches of precipitation during winter, which was 102 percent of normal. Winter precipitation for the states ranged from 82 percent of normal in Delaware to 119 percent of normal in Maine and New Hampshire, with seven states wrapping up the season on the wet side of normal. This winter ranked as the 19th wettest for Massachusetts and New Hampshire and as the 20th wettest for Rhode Island.
Drought
The U.S. Drought Monitor from January 31 showed less than 1 percent of the Northeast in moderate drought and 3 percent as abnormally dry. During February, moderate drought eased and abnormal dryness contracted on New York's Long Island, while abnormal dryness expanded in eastern West Virginia, western/central Maryland, and southern Pennsylvania. Pockets of abnormal dryness also persisted in central New York, southern New Jersey, and southern Maryland. The U.S. Drought Monitor from February 28 showed 6 percent of the Northeast as abnormally dry.
Notable Weather
On February 1, up to eight weeks later than usual, several major climate sites including Dulles Airport, Virginia, and Central Park and Kennedy Airport, New York, finally saw their first measurable snow of the season. For those three sites, it was the latest first snow of the season, and for several other sites including Baltimore, Maryland; Philadelphia, Pennsylvania; and Washington, D.C., it was among the five latest. On February 3 and 4, Arctic air briefly made an appearance in the Northeast. Low temperatures dropped into the single digits or below 0 degrees F in multiple locations, with several sites such as Boston, Massachusetts; Providence, Rhode Island; and Kennedy Airport, New York, recording one of their 10 coldest temperatures for February. The National Weather Service in Norton, Massachusetts, noted that Boston's low of -10 degrees F on February 4 was the site's first double-digit below zero day since January 1957. The temperature in Caribou, Maine, remained below zero for nearly 50 consecutive hours. In fact, it was so cold in northern Maine that water in trees expanded and froze, splintering the trees, and there were frost quakes, seismic events caused by sudden cracking of frozen soil or rock due to the freezing and expansion of underground water. Wind gusts of 30 to 55 mph were common, with locally higher gusts of up to 65 mph. The combination of gusty winds and cold temperatures led to below-zero wind chills in multiple areas. For instance, wind chills plummeted to more than -40 degrees F in Portland, Maine, and Burlington, Vermont, and to more than -30 degrees F in Boston, Massachusetts; Hartford, Connecticut; and Albany, New York. Mount Washington, New Hampshire, recorded an unofficial wind chill of -108 degrees F, possibly one of the lowest on record for the U.S. Blizzard warnings were posted for northern Maine, where whiteout conditions and significant drifting of snow left roads impassable. In southern New England, the gusty winds downed trees and power lines, leading to tens of thousands of power outages. As mentioned, the cold air outbreak was short-lived with temperatures climbing by more than 30 degrees F in 24 hours in parts of New York and New England. For example, the temperature in Watertown, New York, went from -32 degrees F at 6 AM on February 4 to 30 degrees F at 6 AM on February 5, a change of 62 degrees F. The warm temperatures continued through mid-month, especially on February 15 and 16 when several major climate sites recorded one of their 10 warmest high and/or low temperatures for February. In fact, on February 16, Islip, New York, and Bridgeport, Connecticut, had their warmest high temperatures for February with highs of 71 degrees F and 68 degrees F, respectively. These high temperatures also ranked among the five warmest for winter at the sites. On the same day, LaGuardia Airport, New York, and Worcester, Massachusetts, tied their warmest low temperatures for February with lows of 54 degrees F and 49 degrees F, respectively. A rare EF-2 tornado, with winds of up to 115 mph, traveled over 5 miles across Mercer County, New Jersey, on February 21, damaging trees and roofs along its path. According to NCEI's Storm Events Database, which has records back to 1950, this is the first tornado to touch down in Mercer County in the month of February. It was the fifth February tornado for the state of New Jersey, with one in February 1999 and three in February 1973. A storm system moved into the Northeast on February 22, bringing portions of Pennsylvania, New York, and New England snow and freezing rain. As the system slid across the region, generally through Pennsylvania and near the New England coast, on February 23, areas to the north saw below- or near-normal temperatures and additional precipitation in various forms. Storm snowfall totals were 6 inches or less in most areas, with storm ice accumulations from freezing rain reaching 0.50 inches in western New York. Meanwhile, areas to the south in much of Pennsylvania, Maryland, Delaware, and West Virginia saw unusually mild temperatures of 60 to 80 degrees F. In fact, Beckley, WV, hit 77 degrees F on February 22 and Dulles Airport, VA, recorded 80 degrees F on February 23, marking the warmest high temperatures for winter at the sites. The unusually warm temperatures of February and winter contributed to below-normal snowfall for many parts of the Northeast. This February was the least snowy on record for Harrisburg and Pittsburgh, Pennsylvania. Harrisburg received only a trace of snowfall, tying its record from 2020, while Pittsburgh saw 0.2 inches of snow, beating the old record of 0.5 inches from 1909. Meanwhile, Baltimore, Maryland, and Atlantic City, New Jersey, had their least snowy winter on record. Baltimore saw 0.2 inches of snow, besting the old record of 0.5 inches from winter 1949-50, while Atlantic City saw 0.3 inches of snow, beating the old record of 0.4 inches from winter 1972-73. According to modeled data from the USA National Phenology Network, spring leaf-out arrived earlier than usual in parts of the Mid-Atlantic and coastal Northeast, including Baltimore, Maryland, at nearly three weeks early and New York City at more than a month early.
For more information, please visit the Northeast Regional Climate Center Home Page.
Midwest Region (Information provided by the Midwest Regional Climate Center)
Temperature
The average February temperature for the Midwest was 29.2 degrees F (-1.6 degrees C), which was 2.9 degrees F (1.6 degrees C) above the 1991-2020 normal. Average temperatures were near or below normal in the northwest, warming significantly above normal to the south and east across the region. Preliminary statewide average temperatures ranged from 1.8 degrees F (1.0 degrees C) below normal in Minnesota to 6.4 degrees F (3.6 degrees C) above normal in Ohio. Preliminary rankings indicate February average temperatures were the 3rd warmest on record in Ohio, 6th warmest in Indiana, and 7th warmest in Kentucky. A large swath of Indiana and Ohio had monthly maximum temperatures over 10 degrees F (5.6 degrees C) above normal. Over 460 daily high maximum temperature records were broken or tied in February, with about half of the records set in Indiana, Ohio, and Kentucky. The average winter (December-February) temperature for the Midwest was 2.9 degrees F (1.6 degrees C) above normal, with areas in the east up to 7 degrees F (3.9 degrees C) above normal and areas in the far northwest near or slightly below normal. Preliminary rankings indicate Kentucky, Ohio, and Indiana had the 2nd, 3rd, and 4th warmest winters, respectively.
Precipitation
February precipitation totaled 2.64 inches (67 mm) for the Midwest, which was 0.8 inches (47 mm) above normal, or 144 percent of normal. Preliminary rankings indicate the Midwest was tied for the 12th wettest February on record. Precipitation was 125-300 percent of normal for a large portion of the central and upper Midwest, with precipitation across the Ohio River Valley ranging from 50-125 percent of normal. Preliminary statewide precipitation totals ranged from 0.03 inches (1 mm) below normal in Ohio to 1.36 inches (35 mm) above normal in Wisconsin. Based on preliminary rankings, four states had a top 10 wettest February: Wisconsin (4th), Michigan (5th), Iowa (7th), and Minnesota (9th). Minneapolis, Minnesota (151 years of observations), Duluth, Minnesota (149 years of observations), and La Crosse, Wisconsin (149 years of observations) all had the 2nd wettest February on record. About 700 daily high precipitation records were broken or tied in February, with about half of the records set in Iowa, Minnesota, and Wisconsin. Winter (December-February) precipitation for the Midwest was 1.26 inches (32 mm) above normal, or 121 percent of normal. The entire region had near- or above-normal precipitation, with the greatest deviations in the northwest where precipitation ranged from 150-300 percent of normal. Preliminary rankings indicate Wisconsin had the wettest winter on record, and Iowa and Minnesota had the second wettest.
Drought
Conditions continued to improve across the month of February. By month's end, the US Drought Monitor indicated that 12 percent of the region had abnormal dryness and 10 percent was in drought. The primary drought areas were in western Iowa, western Minnesota, and southeast Michigan. Across the winter season (December-February), drought conditions improved substantially. Winter began with 70 percent of the region abnormally dry or in drought and ended with about 22 percent affected. Southeast Michigan was the only region in the Midwest to have drought conditions worsen during winter, and those degradations were isolated to only a few counties.
Snow
February snowfall was near to above normal across the far upper Midwest and far below normal across the lower Midwest. Most locations in Missouri, Illinois, Indiana, Kentucky, and Ohio had 0.01-0.5 inches (0.3-1.3 cm) of snowfall reported in February, despite having near-normal precipitation. Conversely, from southern Minnesota eastward into Wisconsin and northern Michigan, snowfall totals were near to above normal, with totals ranging from 10-30 inches (25-76 cm). Green Bay, Wisconsin had its 5th snowiest February (137 years of data). Conversely, South Bend, Indiana had its 6th least snowy February (123 years of data) and Detroit had its 8th least snowiest (148 years of data). Winter (December-February) snowfall was less than 50 percent of normal for most of the lower Midwest, except for extreme southern Missouri which had above-normal snowfall driven by a single heavy snowfall event in January. Across the upper Midwest, winter season snowfall was near to above normal for most of Minnesota and Wisconsin while Michigan was below normal. Duluth, Minnesota had the 7th snowiest winter (132 years of data). Conversely, Toledo, Ohio (128 years of data) and Cleveland, Ohio (130 years of data) had the 9th and 10th least snowiest winters, respectively.
Notable Weather
February 16 Storm Drenches Kentucky - A potent storm system moved across the lower Midwest on February 16, bringing drenching rains along and south of the Ohio River and snow across the central region from Iowa to southern Wisconsin. Rainfall across a large portion of Kentucky totaled 2.5-4.5 inches (64-114 mm), overflowing the Rolling Fork River and flooding homes and roadways. One fatality was reported in Bradfordsville (central Kentucky) when a car was swept away by the floodwaters. Strong winds reportedly downed trees and damaged buildings in central Kentucky. February 22 Storm Brings Snow and Freezing Rain to the Upper Midwest - An intense low-pressure system moved across the central Midwest on February 22 resulting in widespread winter storm and blizzard warnings across the upper Midwest. This system was accompanied by a thin band of freezing rain from central Iowa to southern Michigan. Ice accumulations of a quarter inch (6.4 mm) to a half inch (13 mm) were widespread in the Detroit metro area, resulting in about 3,000 downed power lines and over 500,000 customers without power. By month's end, over 5,000 customers remained without power due to the storm damage.
For further details on the weather and climate events in the Midwest, see the weekly and monthly reports at the Midwest Climate Watch page.
Southeast Region (Information provided by the Southeast Regional Climate Center)
Temperature
Mean monthly temperatures were well above average across the Southeast in February. Most locations were 6 to 8 degrees F (3.4 to 4.5 degrees C) above average, with some locations, mostly across the northern tier of the region, as much as 10 degrees F (5.5 degrees C) above average. Mean monthly temperatures were 4 to 6 degrees F (2.2 to 3.4 degrees C) above average across the southern half of the Florida Peninsula. For the third consecutive month, mean temperatures were near average across Puerto Rico and the U.S. Virgin Islands. Of 163 long-term stations (i.e., period of record of at least 70 years), 143 (88 percent) observed one of their top 5 warmest mean February temperatures on record. Muscle Shoals, AL (1898-2023), Raleigh-Durham, NC (1887-2023), Roanoke, VA (1912-2023), and Lynchburg, VA (1893-2023) all recorded their warmest February on record. Several other long-term stations observed or tied their second warmest (i.e., Washington D.C., Fort Myers, FL, Miami, FL, Pensacola, FL, Atlanta, GA, Columbus, GA, Macon, GA, Savannah, GA, Asheville, NC, Charlotte, NC, Greensboro, NC, Charleston, SC, Richmond, VA), third warmest (i.e., Montgomery, AL, Daytona Beach, FL, Key West, FL, Orlando, FL, Tallahassee, FL, West Palm Beach, FL, Athens GA), fourth warmest (i.e., Huntsville, AL, Mobile, AL, Gainesville, FL, Melbourne, FL, Tampa, FL, Wilmington, NC, Greenville-Spartanburg, SC, Norfolk, VA), and fifth warmest (i.e., Sarasota, FL, Columbia, SC) February on record. In addition, over 70 daily maximum and over 80 daily high minimum monthly temperature records were tied or broken at long-term stations across the region. Some of the daily maximum temperatures broke their previous records by at least 3 degrees F (1.7 degrees C). Muscle Shoals, AL recorded its highest maximum temperature for any February day (since 1893) with a value of 86 degrees F (30 degrees C) on the 23rd, breaking the old record of 83 degrees F (28.3 degrees C). Brunswick, GA recorded its highest maximum temperature for any February day (since 1944) with a value of 88 degrees F (31.1 degrees C) on the 23rd and 24th, breaking the old record of 85 degrees F (29.4 degrees C). Other locations that set or tied all-time daily maximum temperature records for February include Mobile, AL (85 degrees F (29.4 degrees C) on the 28th), Atlanta, GA (81 degrees F (27.2 degrees C) on the 22nd), Raleigh-Durham, NC (85 degrees F (29.4 degrees C) on the 23rd), and Wilmington, NC (86 degrees F (30 degrees C) on the 23rd). Tuscaloosa, AL failed to drop below 70 degrees F (21.1 degrees C) for the first time ever in February (since 1948) on the 23rd. Brunswick, GA recorded its highest minimum temperature for any February day (since 1944) with a value of 73 degrees F (22.8 degrees C) on the 28th, breaking the old record of 66 degrees F (18.9 degrees C). Tifton, GA, located in the southern part of the state, recorded its highest minimum temperature for any February day (since 1911) with a value of 74 degrees F (23.3 degrees C) on the 16th, breaking the old record of 66 degrees F (18.9 degrees C). The geographic extent of the warm weather was also noteworthy. Washington, D.C. (1872-2023) reached 81 degrees F (27.2 degrees C) on the 23rd of the month, which is only 107 days since the last 80 degree F (26.7 degrees C) day observed on November 7, 2022. This breaks the record of 113 days between 80 degree F (26.7 degrees C) observations set between November 8, 1975 and March 1, 1976.
Precipitation
Precipitation was below average across most of the region in February. The driest locations were found across central portions of Georgia, southern Alabama, northwest Florida, and much of the Florida Peninsula (except around Miami), where monthly precipitation totals were less than 50 percent of normal. Precipitation was also below average across most of North Carolina, eastern Virginia, and the U.S. Virgin Islands. Some locations in southwest Florida were especially dry during the month. Naples, FL did not record any precipitation in February for only the third time on record (since 1942). Key West, FL recorded just 0.01 inches (0.25 mm) of precipitation, which tied its second driest February on record (since 1871), while Fort Myers, FL recorded its fifth driest February on record (since 1892) with just 0.07 inches (1.8 mm) of precipitation. Precipitation was variable across Puerto Rico. In contrast, small areas of above average precipitation were scattered across the region in February, particularly in western Alabama, north-central Florida, coastal portions of South Carolina, southern portions of Georgia and Florida, and western portions of North Carolina and Virginia. On the 5th of the month, Miami, FL recorded 4.13 inches (105 mm) of precipitation, which is the third highest total for any February day on record (since 1895). For the month, Miami recorded 5.72 inches (142 mm) of precipitation, making it the fifth wettest February on record. Regarding winter precipitation, less than 1 inch (25 mm) of snow and freezing rain was reported across northern Virginia and parts of the Shenandoah Valley on the 1st of the month. Washington D.C. recorded its first snowfall of the season with 0.4 inches (10 mm), marking the fifth latest date in the winter season for first measurable snowfall (since 1885). Graupel and sleet were also reported across extreme northern Alabama. On the 12th and 13th, light snowfall amounts were reported across northern sections of Alabama, Georgia, and South Carolina, while 1 to 5 inches (25 to 127 mm) of snowfall was recorded across the higher elevations of North Carolina and Virginia as an area of low pressure tracked northeastward across the region. Snowfall was reported across western portions of North Carolina and Virginia as a cold front swept across the region on the 17th and 18th of the month. Trace amounts of snowfall were also reported in northern Virginia on the 25th of the month.
Drought
Drought conditions continued to worsen across the Florida Peninsula due to the lack of precipitation and warm temperatures. By the end of February, most of the Peninsula was in moderate (D1) drought, with the rest of the state in abnormally dry (D0) conditions except in the central Panhandle (around Tallahassee) and southeast Peninsula (around Miami). Moderate (D1) drought emerged on St. Thomas and St. Croix in the U.S. Virgin Islands. Abnormally dry (D0) conditions expanded slightly across the north coastal region of Puerto Rico and outlying islands. On the other hand, moderate (D1) drought was eliminated across Alabama and the Carolinas, while the region of severe (D2) drought in the Big Bend region of Florida was upgraded to moderate (D1) drought. Small areas of abnormally dry (D0) conditions remained across the western Panhandle of Florida, southern Georgia, and eastern sections of North Carolina and Virginia. Moderate (D1) drought persisted across the southern tip of the Delmarva Peninsula. Overall, about 10 percent of the region was in abnormally dry (D0) conditions by the end of February, while moderate (D1) drought covered about 13 percent of the region.
Agriculture
Cold weather in December and January continued to affect many crops in the region. Early planted winter grain and other grazing crops were in poor condition across parts of Alabama. The cold weather forced a late planting of strawberries across parts of South Carolina, which were showing signs of fungal diseases. While the Vidalia onion crop was progressing well in Georgia, yields are expected to be lower than average. In addition, some operators in the state were still supplementing feed for livestock due to low hay supplies resulting from the cold temperatures. On the other hand, the unseasonably warm weather and resulting warm soil temperatures in February allowed many operators to prepare for spring row crop planting, except in areas that received above average precipitation, such as the Lowcountry of South Carolina. The warm temperatures and adequate soil moisture levels aided the growth of winter grazing and cool season pastures, wheat, rye, and oats, particularly across northern and central sections of Georgia and South Carolina. Livestock were also in generally good condition across much of the region. In Florida, the dry weather aided the harvest of sugarcane as well as the planting of rice and most citrus grove activities. However, the lack of precipitation has negatively impacted pastures, with many reported as poor to fair by the end of the month. The exceptionally warm weather in February caused some perennial fruit crops to bloom much earlier than usual, which has farmers concerned about potential losses if a late season freeze occurs over the next couple of months.
Notable Weather
There were only five reports of severe weather across the Southeast in February, which is well below the median frequency of 85 reports over the period 2000 to 2021 (6 percent of normal). There were two confirmed tornadoes, which is below the median frequency of 9.5 (21 percent of normal). On the 9th of the month, an EF-1 tornado touched down in Walton County in the western Panhandle of Florida. Significant damage to trees and minor damage to structures were observed in the community of Eucheeanna. On the 17th of the month, an EF-1 tornado touched down near the town of LaGrange in Troup County, GA. Numerous trees were damaged, and a few were uprooted and snapped on the campus of LaGrange College. Roof damage was reported to several structures including a health department building. Bleachers from Callaway Stadium were blown into a brick and metal fence. Considerable damage occurred on Forrest Avenue when a large oak tree was uprooted and fell on a house. Fortunately, no injuries or fatalities were reported with these tornadoes. There were only three high wind reports in February, which is well below the median frequency of 63.5 (5 percent of normal). On the 17th of the month, a thunderstorm wind gust of 72 mph (32 m/s) was reported at the Hartsfield-Jackson International Airport in Atlanta, GA. The thunderstorm associated with the tornado in LaGrange also produced straight-line wind damage to trees and small structures. Wind gusts exceeding 55 mph (25 m/s) were also recorded across northern Virginia, resulting in several felled trees. High winds brought down trees in Graham County in extreme southwestern North Carolina on the 27th of the month. There were no reports of large hail during the month (median frequency is 12). Heavy rainfall exceeding 5 inches (127 mm) resulted in flooded roadways across parts of southern Georgia and northeast Florida on the 11th of the month as an area of low pressure tracked northeast across the southern tier of the region. There were three rip current fatalities in February, all on the 19th of the month. One occurred in Isla De Culebra, PR while the other two occurred near Melbourne, FL.
For more information, please visit the Southeast Regional Climate Center Home Page.
High Plains Region (Information provided by the High Plains Regional Climate Center)
February in the High Plains had it all. From severe weather to snowstorms, nothing was off the table. Snow continued to pile up in the Dakotas, Wyoming, and parts of Nebraska, leading to numerous impacts. Much of South Dakota was shut down due to the storm in late February, with up to 16 inches (40.64 cm) reported in Huron and 44 mph (71 km/h) wind gusts in Sioux Falls. Towards the end of the month, the first severe weather outbreak of the year occurred in parts of southern and eastern Kansas. A tornado occurred on the 26th, with a weak EF-0 causing damage to the town of Liberal. With the same storm system, the winds were exceptionally strong. A wind gust of 97 mph (156 km/h) was recorded near the town of Hodgeman, with numerous reports of wind damage that day. While temperatures were close to normal for the southern part of the region in part to a cold start, the rest of the month was predominantly above-normal. This has led plants to begin blooming much earlier than expected. The plants that have bloomed are highly susceptible to freezing temperatures that may still occur.
Temperature
Temperatures this past month were, for the most part, near to below normal for the region. Parts of western Wyoming and northwestern Colorado were 9 degrees F (5 degrees C) or more below normal. Temperatures were well below normal across parts of Wyoming, with Rawlins and Lander ranking as the 10th coldest on record. The town of Farson had a brutal month, with an average temperature of 1.6 degrees F (-16.9 degrees C). The high temperature only surpassed 32 degrees F (0 degrees C) in only two days in February. While temperatures were chilly in Wyoming, Kansas had milder temperatures. Many locations recorded ten or more days of 60 degrees F (15.6 degrees C), while the town of Lakin reached 80 degrees F (26.7 degrees C) on the 27th.
Precipitation
Precipitation was spotty this past month, however, the precipitation that did occur was well above-normal. Both ends of the spectrum occurred this month with near-record dryness and wetness. Despite still being meteorological winter, severe weather was present this month. Winter storms continued to impact the northern parts of the region, with Wyoming and the Dakotas significantly impacted. Rawlins, Wyoming, recorded their 2nd wettest month with 1.67 inches (42.42 cm). Although the official station does not track snowfall, a nearby station reported over 34 inches (86.36 cm) of snow in February. Bismarck, North Dakota, and Huron, South Dakota, ranked 8th snowiest with over 15 inches (38.10 cm) in both locations. Opposite of this wetness, Akron, Colorado, was bone dry, recording a mere trace of precipitation this month to tie for the driest. With the conclusion of February, the meteorological winter has ended. In a complete turnaround from last year, many places recorded near-record precipitation and snowfall. Multiple locations in Nebraska and Wyoming recorded their wettest and snowiest winters. Valentine, Nebraska crushed its previous snow record by nearly 14 inches (35.56 cm), with 56.4 inches (143.26 cm) observed.
Drought
Drought improvement continued into February in response to the significant wetness this winter. While conditions did slightly deteriorate this past month, it was very isolated. Overall, there was a 2.4 percent decrease in D0 to D4 (abnormally dry to exceptional drought conditions). The continuous onslaught of winter storms has greatly improved the drought situation across the central and northern parts of the region. Both South Dakota and Wyoming observed a nearly 11 percent decrease in D2 to D4 (severe to exceptional drought) this past month, while Kansas experienced an 11 percent reduction in D0-D4. Elsewhere in the region, other improvements and degradation were observed.
For more information, please visit the High Plains Regional Climate Center Home Page.
Southern Region (Information provided by the Southern Regional Climate Center)
A cold start gave way to a very warm February for the Southern Region with outbreaks of severe and winter weather.
Temperature
February was a mixed month for temperatures across the Southern Region with near-normal temperatures observed across much of Texas and Oklahoma. The eastern portions of the region were well above normal during February. Three out of six states experienced top 10 warmest Februarys on record. Tennessee ranked 3rd warmest (out of 129 years) a full seven degrees F above the 1991-2020 normal of 41.1 F. Mississippi ranked 6th warmest, Louisiana ranked 8th, Arkansas ranked 13th, and the Southern Region as a whole ranked 15th. Texas and Oklahoma were more moderate ranking 29th and 36th warmest respectively. Two stations reached triple digits during February, both in Texas: Falcon Lake reached 102 F on February 23rd and Linn-San Manuel reached 100 F on February 23rd. The coldest temperature recorded in the region during February was 2.0 F at two stations in Oklahoma: Goodwell Research Station on February 17th and Guymon Airport on February 17th. Sixteen long-term stations set record high temperatures for February: 10 in Tennessee, three in Mississippi, two in Texas, and one in Louisiana. No station set record low temperatures for February in the Southern Region.
Precipitation
Precipitation was near normal across much of the region, with areas of well above normal precipitation in eastern Oklahoma, western Arkansas, and the Big Bend area of Texas, and well below normal in southern Texas, portions of far-west Texas and the Texas Panhandle. Statewide average totals were above normal for Oklahoma (28th wettest) and Arkansas (32nd wettest). Louisiana (41st driest) and Mississippi (50th driest) were drier than the 1991-2020 normal for February, while the rest of the Southern Region and the Southern Region as a whole were near their historical median values. The three wettest stations were a mix of COOP (2) and CoCoRaHS (1) and were spread across three states: Abbott, Arkansas (12.58 inches), near New Hebron, Mississippi (11.36), and Idabel, Oklahoma (11.07). Three stations reported single daily rainfall accumulations of over five inches, all in Arkansas, these included: near Melbourne (5.39 inches, February 9th), near Higden (5.37, February 9th), and Langley (5.3, February 8th). Seven long-term stations recorded daily rainfall accumulations for the month of February, six of these were in Arkansas, the stations were: Mountain View, Arkansas (4.91 inches, February 9th), Idabel, Oklahoma (4.60, February 8th), Gravely, AR (4.55, February 8th), Damascus, Arkansas (3.80, February 9th), Big Fork, Arkansas (3.77, February 8th), and Batesville Lock and Dam 1, Arkansas (3.77, February 9th).
Drought/Flooding
During February the spatial extent of drought conditions remained relatively steady across the Southern Region. As of February 28th, much of central Texas, the Texas Panhandle, much of Oklahoma, and extreme southern Louisiana remained in drought conditions. Degradation was evident in deep southern Texas, with the emergence of Extreme Drought. Eastern Texas and eastern Oklahoma saw improvement in drought conditions with much of this area becoming drought free. Arkansas, Tennessee, and Mississippi were free of drought as of February 28th. In the areas experiencing drought the primary impacts are low reservoir levels, low streamflow, and poor condition of overwintering/cold season crops and pasture. In the USDA Oklahoma Crop Progress and Condition report released on March 6, 2023, winter wheat was rated 39 percent good to excellent (one percent rated excellent), 21 percent fair, and 40 percent poor to very poor and in the USDA Texas Crop Progress and Condition report, winter wheat was rated 19 percent good to excellent (three percent rated excellent). 31 percent fair, and 50% poor to very poor.
Notable Weather
Twenty-nine tornadoes were reported across the Southern Region in February, impacting all six states in the region. The ratings were 8 EF0, 14 EF1, and 7 EF2. In total there were 15 reported injuries and one fatality. On February 26th an EF2 tornado near Norman, Oklahoma injured 12. On February 16th, an EF2 tornado at Pindall, Arkansas injured one and an EF2 near Ripley, Mississippi injured one. An EF2 tornado near Cheyenne, Oklahoma on February 26th resulted in one fatality. The largest of 35 hail reports was 2.0 inch hail that fell near West Memphis, Arkansas early on February 16th. There were a total of 149 severe wind reports across the Southern Region during February with 86 mph reported near Fittstown, Oklahoma early on February 27th. On February 1st and 2nd an ice storm that began on January 31st continued to impact the region, causing power outages, traffic accidents, travel delays, power outages, and injuries associated with the ice storm.
For more information, please visit the Southern Regional Climate Center Home Page.
Western Region (Information provided by the Western Region Climate Center)
Colder and drier than normal conditions persisted across the western U.S. during February 2023 as high pressure anchored offshore allowed cold air surges to move south into the West from interior Canada. The coldest temperatures occurred in southern Idaho, northeastern Nevada, central and eastern Utah, and western Wyoming. Alaska was cooler and wetter than normal while Hawaii was warmer than normal with near-normal to wetter than normal conditions.
Temperature
Nearly all of the western U.S. experienced below normal temperatures during February. Laketown, Utah tied its third coldest February in 122 years of records with a mean temperature of 12.4 degrees Fahrenheit (11 degrees Fahrenheit below normal). Along the Pacific coast, Eureka, California achieved its 4th coldest February since records began 133 years ago with a mean temperature of 44 degrees Fahrenheit (4 degrees Fahrenheit below normal). In Hachita, New Mexico, where records began in 1909, February 2023 was the third coldest on record with a mean temperature of 41 degrees Fahrenheit (5 degrees below normal). Slightly warmer than normal conditions were observed in northern and eastern Montana with near-normal temperatures in eastern New Mexico. No hot temperature records were set during February.
Precipitation
With a few exceptions, the western U.S was drier than normal during February while cold temperatures allowed what precipitation did occur to fall as snow. In 78 years of record keeping, Halfway, Oregon observed its fourth driest February on record, with 0.55 inches of rainfall (1.53 inches below normal). With 70 years of records, Hoqiuam, Washington observed its ninth driest February on record, measuring 3.65 inches of precipitation (3 inches below normal). Several locations in California, Arizona, Montana, Wyoming, and New Mexico were wetter than average. For example, Sasabe, Arizona measured 2.5 inches of precipitation (1.34 inches above normal), good for its seventh wettest February in 52 years of records.
Snowpack
Snowpack conditions at the end of February are well above normal (>150 percent of normal) across the southern tier of the western U.S. with near to slightly below normal conditions in the northern tier. The lowest snowpacks (<50% of normal) occur in the northern Sangre de Christo Range in Colorado and the eastern Gila Mountains in New Mexico. Snowpacks in California, Nevada, Arizona, and Utah now exceed their annual peak values, in many cases by 125-200%.
Drought
Drought remains widespread throughout the western U.S., however compared to one year ago, there is continues to be reductions in drought area (75 percent compared to 96 percent in late September). Substantially less area is in extreme to exceptional drought (3 percent compared to 24 percent). Extreme to exceptional drought remains in central Oregon, north central Montana, eastern New Mexico, southern Nevada, south central Utah, and far southeastern Wyoming.
Alaska Summary
February brought anomalous precipitation to Alaska and near normal temperatures overall. Adding to an already snowy winter even by AK standards, Anchorage had its fifth snowiest February with 32.4 inches and Juneau its third snowiest February with 46.5 inches of snowfall. While Hatcher's Pass in the Talkeetna Mountains is buried with its third deepest snowpack in 20 years, Girdwood in the Chugach Mountains remains below normal with 66% of normal snowpack, making this the 6th lowest snowpack in 45 years. Ketchikan, Alaska tied its sixth wettest February since records began 96 years ago, measuring 23.22 inches of precipitation (11.42 inches above normal). Dry conditions plagued the interior, with Tanana (101 years of records) and Northway (81 years of records) measuring zero precipitation (0.44 and 0.24 inches below normal, respectively). No extreme hot or cold monthly mean temperatures were observed during February. Bering sea ice was typical of the long-term average, coming within approximately 50 miles of the Pribilof Islands before beginning its northward retreat.
Hawaii Summary
February 2023 brought near normal to above normal precipitation and warmer than normal temperatures to Hawaii. Drought conditions have been eliminated throughout the state, marking a tremendous improvement from October when over 97% of the state was experiencing drought. Lihui, on Kauai, observed its sixth wettest February in 73 years of records with 8.67 inches of rainfall (5.04 inches above normal). Lihui also experienced its warmest February on record with a mean temperature of 74.6 degrees Fahrenheit (2 degrees Fahrenheit above normal). On Hawaii, Hilo measured 26.82 inches of rainfall (16.6 inches above normal), making February its 5th wettest since records began 74 years ago. Sea surface temperatures (SSTs) were slightly warmer than normal (1-2 degrees Fahrenheit) to the north and southwest of Hawaii, with anomalies of 0.5 to 1 degrees below normal to the east and southeast of the islands.
Notable Weather
February 21-24 Cold Surge: An extremely cold airmass that formed over the Canadian Arctic surged southward in late February bringing four days of extreme cold to the interior western U.S. Billings, Montana reached -18 degrees Fahrenheit and Yellowstone National Park in Wyoming bottomed out at -20 degrees Fahrenheit. Cold temperatures and strong mountain top winds caused wind chills to drop as low as -35 degrees Fahrenheit in many regions.
For more information, please go to the Western Regional Climate Center Home Page.