Atlantic Basin
Gaston was a short-lived tropical storm that initially emerged off the west coast of Africa near the end of August. The storm developed into a tropical depression on September 1st and was named Gaston later that same day as it intensified to a tropical storm; however, the storm maintained its status for only 18 hours, weakening back to a tropical depression on the 2nd. Peak winds reached 40 mph (65 km/hr). Gaston did not make landfall and thus no damages were reported.
 Tropical Storm Gaston Satellite Image |
 Tropical Storm Gaston Forecast Track  Saffir-Simpson Scale Color Legend |
| Tropical Cyclone | Gaston | ||||||||
| Cyclogenesis Date | 09/01 | ||||||||
| Cyclolysis Date | 09/01 | ||||||||
| Highest Saffir-Simpson Category | TS | ||||||||
| Maximum 6-hr Sustained Wind | 58 mph (50 kt or 93 km/h) | ||||||||
| Min Pressure | 995 mbar | ||||||||
| Accumulated Cyclone Energy (ACE*) Index (kt2) | .2450 x 104 | ||||||||
| Landfall Information (date, location and sustained winds) | N/A | ||||||||
| Deaths | 0 | ||||||||
| *The (ACE) Index calculations are based on preliminary data. | |||||||||
Hermine developed in the southwestern Gulf of Mexico's Bay of Campeche late on September 5th and rapidly intensified to a tropical storm in just 21 hours. The storm had maximum sustained winds of 65 mph (105 km/hr) before making landfall over northeastern Mexico near the Texas border on September 6th. The storm's strength dissipated to tropical depression status over land although heavy rain continued to fall as the storm moved northward over Texas toward Oklahoma and Kansas. At least eight people were killed. According to preliminary reports from the National Weather Service, Camp Mabry—located within Austin city limits—received 7.04 inches (179 mm) of rain on the 7th, shattering its old record of 3.11 inches (79 mm), previously set in 1923. Average for the month of September at Camp Mabry is 2.91 inches (74 mm). Local reports stated that the highest rainfall totals of about 14 inches (356 mm) were recorded in an area stretching from Mansfield Dam to Georgetown. Additionally, the storm spawned several tornadoes in northern Texas near Dallas and in southern Oklahoma. In Mexico, the states of Veracruz, Oaxaca, and Tabasco were hardest hit. In Veracruz, more than 200,000 residents were forced to flee their homes. In Tabasco, about 500,000 acres (200,000 hectares) of cropland was submerged, affecting the livelihood of about 20,000 farmers.
 Tropical Storm Hermine Satellite Image |
 Tropical Storm Hermine Forecast Track Saffir-Simpson Scale Color Legend |
| Tropical Cyclone | Hermine | ||||||||
| Cyclogenesis Date | 09/06 | ||||||||
| Cyclolysis Date | 09/07 | ||||||||
| Highest Saffir-Simpson Category | TS | ||||||||
| Maximum 6-hr Sustained Wind | 63 mph (55 kt or 102 km/h) | ||||||||
| Min Pressure | 991 mbar | ||||||||
| Accumulated Cyclone Energy (ACE*) Index (kt2) | 1.2725 x 10⁴ | ||||||||
| Landfall Information (date, location and sustained winds) | 09/07 – near Matamoros, Tamaulipas (55 kt or 102 km/h) 09/06–09/11 Total Precip (map) |
||||||||
| Deaths | 6 | ||||||||
| *The (ACE) Index calculations are based on preliminary data. | |||||||||
Igor developed off the west coast of Africa on September 6th and became a tropical storm on September 8th. On the 11th, Igor became the fourth hurricane of the 2010 Atlantic season, and rapidly intensified into a strong Category 4 storm on September 12th with maximum sustained winds of 150 mph (241 km/hr) by the next day. The high winds made Igor the strongest Atlantic storm to date this season. Igor weakened and, as a Category 1 storm, brushed the tiny island of Bermuda, bringing heavy rains and strong winds, and leaving structural damage but no casualties. The storm made its way northward to Newfoundland, Canada where it made landfall with tropical storm-force winds. More than 7.9 inches (200 mm) of rainfall was reported along with wind gusts reaching up to 90 mph (145 km/hr). The storm quickly dissipated over land, but flooded roads, knocked down trees and power lines, and left at least one person missing in its wake.
 Tropical Storm Igor Satellite Image |
 Tropical Storm Igor Forecast Track Saffir-Simpson Scale Color Legend |
| Tropical Cyclone | Igor | ||||||||
| Cyclogenesis Date | 09/10 | ||||||||
| Cyclolysis Date | 09/21 | ||||||||
| Highest Saffir-Simpson Category | Cat 4 | ||||||||
| Maximum 6-hr Sustained Wind | 150 mph (130 kt or 241 km/h) | ||||||||
| Min Pressure | 935 mbar | ||||||||
| Accumulated Cyclone Energy (ACE*) Index (kt2) | 43.1125 x 10⁴ | ||||||||
| Landfall Information (date, location and sustained winds) | N/A | ||||||||
| Deaths | 0 | ||||||||
| *The (ACE) Index calculations are based on preliminary data. | |||||||||
Hurricane Julia formed on September 13th. On the 15th, Julia reached Category 4 status joining an already-strengthened Category 4 Igor—the first time this feat has occurred in the North Atlantic since 1926 and only the second known time since 1900. However, within hours Julia dropped back down to Category 3. The storm continued to weaken and became extratropical on September 20th. Julia never regained strength. Hurricane Julia never made landfall, but did achieve the distinction of becoming the easternmost Category 4 hurricane on record in the North Atlantic.
 Tropical Storm Julia Satellite Image |
 Tropical Storm Julia Forecast Track Saffir-Simpson Scale Color Legend |
| Tropical Cyclone | Julia | ||||||||
| Cyclogenesis Date | 09/13 | ||||||||
| Cyclolysis Date | 09/20 | ||||||||
| Highest Saffir-Simpson Category | Cat 3 | ||||||||
| Maximum 6-hr Sustained Wind | 132 mph (110 kt or 213 km/h) | ||||||||
| Min Pressure | 950 mbar | ||||||||
| Accumulated Cyclone Energy (ACE*) Index (kt2) | 13.4625 x 10⁴ | ||||||||
| Landfall Information (date, location and sustained winds) | N/A | ||||||||
| Deaths | 0 | ||||||||
| *The (ACE) Index calculations are based on preliminary data. | |||||||||
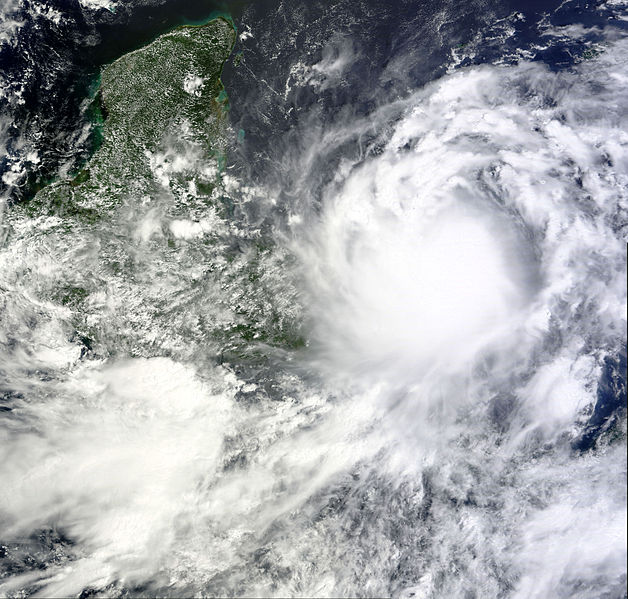
While Hurricanes Igor and Julia were churning in the open waters of the Atlantic, Karl formed a few hundred miles east of the Yucatan Peninsula on September 14th. Tropical Storm Karl made landfall over the Yucatan Peninsula near Chetumal in Mexico's state of Quintana Roo on the 15th. The storm maintained its tropical storm status as it moved over land and quickly gained strength before making a second landfall on September 17th just north of Veracruz, Mexico as a Category 3 storm with 115 mph (185 km/hr) winds. Karl's rapid evolution led to the first time a major hurricane was present in the Bay of Campeche. Karl brought heavy rains to both Mexico and Texas. Fifteen people were reportedly killed by the storm in Mexico as oil rigs were evacuated and the country's nuclear power facility was shut down. According to the governor of Veracruz, at least 500,000 people in that state were affected by the storm. Karl quickly dissipated as it passed over the mountainous region of southern Mexico. In Texas, moisture from the storm led to heavy downpours. Corpus Christi received 7.16 inches (182 mm) of rain on the 19th—a daily record?adding to the 2.61 inches (66 mm) received the previous day. Several rivers surpassed flood stage and one person was killed after their car was swept away by raging waters.
 Tropical Storm Karl Satellite Image |
 Tropical Storm Karl Forecast Track Saffir-Simpson Scale Color Legend |
| Tropical Cyclone | Karl | ||||||||
| Cyclogenesis Date | 09/14 | ||||||||
| Cyclolysis Date | 09/18 | ||||||||
| Highest Saffir-Simpson Category | Cat 3 | ||||||||
| Maximum 6-hr Sustained Wind | 121 mph (105 kt or 194 km/h) | ||||||||
| Min Pressure | 961 mbar | ||||||||
| Accumulated Cyclone Energy (ACE*) Index (kt2) | 6.0825 x 10⁴ | ||||||||
| Landfall Information (date, location and sustained winds) | 09/15–near Chetumal, Quintana Roo (56 kt or 105 km/h) | ||||||||
| Deaths | 0 | ||||||||
| *The (ACE) Index calculations are based on preliminary data. | |||||||||
Tropical Storm Lisa formed on September 20th in an area west of the Cape Verde Islands off the coast of Africa. After a slow start westward, a strong jet stream pushed the storm eastward back towards Cape Verde. The storm eventually did gain Category 1 hurricane strength on September 24th and made its way northwest. But the following day, Lisa began to weaken and had dissipated by the 26th. Lisa never made landfall.
 Tropical Storm Lisa Satellite Image |
 Tropical Storm Lisa Forecast Track Saffir-Simpson Scale Color Legend |
| Tropical Cyclone | Lisa | ||||||||
| Cyclogenesis Date | 09/21 | ||||||||
| Cyclolysis Date | 09/26 | ||||||||
| Highest Saffir-Simpson Category | Cat 1 | ||||||||
| Maximum 6-hr Sustained Wind | 81 mph (70 kt or 130 km/h) | ||||||||
| Min Pressure | 987 mbar | ||||||||
| Accumulated Cyclone Energy (ACE*) Index (kt2) | 4.1550 x 10⁴ | ||||||||
| Landfall Information (date, location and sustained winds) | N/A | ||||||||
| Deaths | 0 | ||||||||
| *The (ACE) Index calculations are based on preliminary data. | |||||||||
Tropical Storm Matthew formed on September 23rd, making landfall near the Honduras-Nicaragua border on the 24th where it quickly lost strength and then stalled over land. The remnants of the storm produced very heavy rainfall, with local amounts of 10 to 20 inches, and up to 30 inches in isolated areas. The remnants finally dissipated on the 28th. At least one person in El Salvador, seven people in Venezuela, 10 people in Colombia, and 32 people in the southern Mexico states of Chiapas and Oaxaca were killed due to the heavy rains and flooding that triggered several major landslides.
 Tropical Storm Matthew Satellite Image |
 Tropical Storm Matthew Forecast Track Saffir-Simpson Scale Color Legend |
| Tropical Cyclone | Matthew | ||||||||
| Cyclogenesis Date | 09/23 | ||||||||
| Cyclolysis Date | 09/24 | ||||||||
| Highest Saffir-Simpson Category | TS | ||||||||
| Maximum 6-hr Sustained Wind | 52 mph (45 kt or 83 km/h) | ||||||||
| Min Pressure | 998 mbar | ||||||||
| Accumulated Cyclone Energy (ACE*) Index (kt2) | .9650 x 104 | ||||||||
| Landfall Information (date, location and sustained winds) | 09/24–near Krukira, Nicaragua (43 kt or 80 km/h) | ||||||||
| Deaths | 13 | ||||||||
| *The (ACE) Index calculations are based on preliminary data. | |||||||||
A disturbance formed in the Caribbean Sea on September 25th. The storm gradually intensified and became more developed. Tropical Storm Nicole was named on the 29th, but lost its tropical storm status just six hours later, making it the shortest lived named storm of the 2010 North Atlantic hurricane season. However, the remnants from Nicole produced very heavy rain and wreaked havoc across Jamaica, where 12 people were killed due to flash flooding, as well as Cuba, the Cayman Islands, the Bahamas, and southern Florida. More than eight inches (203 mm) of rain was reported in parts of the Jamaica. The remnants also contributed to record torrential rains along the eastern U.S. seaboard from the Carolinas to Maine,. Eight deaths were reported in the United States due to flooding effects of the storm. On the positive side, abnormally dry and drought conditions were alleviated in these areas, according to the U.S. Drought Monitor.
 Tropical Storm Nicole Satellite Image |
 Tropical Storm Nicole Forecast Track Saffir-Simpson Scale Color Legend |
| Tropical Cyclone | Nicole | ||||||||
| Cyclogenesis Date | 09/29 | ||||||||
| Cyclolysis Date | 09/29 | ||||||||
| Highest Saffir-Simpson Category | TS | ||||||||
| Maximum 6-hr Sustained Wind | 46 mph (40 kt or 74 km/h) | ||||||||
| Min Pressure | 996 mbar | ||||||||
| Accumulated Cyclone Energy (ACE*) Index (kt2) | .2450 x 104 | ||||||||
| Landfall Information (date, location and sustained winds) | 09/29–Aguada de Pasajeros, Cuba (40 kt or 74 km/h) 09/29–10/02 Total Precip (map) |
||||||||
| Deaths | 9 | ||||||||
| *The (ACE) Index calculations are based on preliminary data. | |||||||||
Northwest Pacific Basin
 Tropical Storm Malou Satellite Image |
 Tropical Storm Malou Forecast Track Saffir-Simpson Scale Color Legend |
| Tropical Cyclone | Malou | ||||||||
| Cyclogenesis Date | 09/03 | ||||||||
| Cyclolysis Date | 09/07 | ||||||||
| Highest Saffir-Simpson Category | TS | ||||||||
| Maximum 6-hr Sustained Wind | 52 mph (45 kt or 83 km/h) | ||||||||
| Min Pressure | 980 mbar | ||||||||
| Accumulated Cyclone Energy (ACE*) Index (kt2) | 2.4725 x 10⁴ | ||||||||
| Landfall Information (date, location and sustained winds) | N/A | ||||||||
| Deaths | 0 | ||||||||
| *The (ACE) Index calculations are based on preliminary data. | |||||||||
 Tropical Storm Meranti Satellite Image |
 Tropical Storm Meranti Forecast Track Saffir-Simpson Scale Color Legend |
| Tropical Cyclone | Meranti | ||||||||
| Cyclogenesis Date | 09/08 | ||||||||
| Cyclolysis Date | 09/10 | ||||||||
| Highest Saffir-Simpson Category | Cat 1 | ||||||||
| Maximum 6-hr Sustained Wind | 75 mph (65 kt or 120 km/h) | ||||||||
| Min Pressure | 990 mbar | ||||||||
| Accumulated Cyclone Energy (ACE*) Index (kt2) | 1.1900 x 10⁴ | ||||||||
| Landfall Information (date, location and sustained winds) | 09/10 – Fujian province, China (45 kt or 75 km/h) | ||||||||
| Deaths | 0 | ||||||||
| *The (ACE) Index calculations are based on preliminary data. | |||||||||
 Tropical Storm Fanapi Satellite Image |
 Tropical Storm Fanapi Forecast Track Saffir-Simpson Scale Color Legend |
| Tropical Cyclone | Fanapi | ||||||||
| Cyclogenesis Date | 09/15 | ||||||||
| Cyclolysis Date | 09/21 | ||||||||
| Highest Saffir-Simpson Category | Cat 1 | ||||||||
| Maximum 6-hr Sustained Wind | 86 mph (75 kt or 139 km/h) | ||||||||
| Min Pressure | 965 mbar | ||||||||
| Accumulated Cyclone Energy (ACE*) Index (kt2) | 11.9600 x 10⁴ | ||||||||
| Landfall Information (date, location and sustained winds) | 09/19 – Hualien County, Taiwan (94 kt or 175 km/h) 09/20 – Fujian province, China (49 kt or 90 km/h) |
||||||||
| Deaths | 59 | ||||||||
| *The (ACE) Index calculations are based on preliminary data. | |||||||||
 Tropical Storm Malakas Satellite Image |
 Tropical Storm Malakas Forecast Track Saffir-Simpson Scale Color Legend |
| Tropical Cyclone | Malakas | ||||||||
| Cyclogenesis Date | 09/20 | ||||||||
| Cyclolysis Date | 09/26 | ||||||||
| Highest Saffir-Simpson Category | Cat 1 | ||||||||
| Maximum 6-hr Sustained Wind | 104 mph (90 kt or 167 km/h) | ||||||||
| Min Pressure | 960 mbar | ||||||||
| Accumulated Cyclone Energy (ACE*) Index (kt2) | 6.6200 x 10⁴ | ||||||||
| Landfall Information (date, location and sustained winds) | N/A | ||||||||
| Deaths | 0 | ||||||||
| *The (ACE) Index calculations are based on preliminary data. | |||||||||
Northeast Pacific Basin
 Tropical Storm Georgette Satellite Image |
 Tropical Storm georgette Forecast Track Saffir-Simpson Scale Color Legend |
| Tropical Cyclone | Georgette | ||||||||
| Cyclogenesis Date | 09/21 | ||||||||
| Cyclolysis Date | 09/21 | ||||||||
| Highest Saffir-Simpson Category | TS | ||||||||
| Maximum 6-hr Sustained Wind | 40 mph (35 kt or 64 km/h) | ||||||||
| Min Pressure | 1000 mbar | ||||||||
| Accumulated Cyclone Energy (ACE*) Index (kt2) | .2450 x 104 | ||||||||
| Landfall Information (date, location and sustained winds) | N/A | ||||||||
| Deaths | 0 | ||||||||
| *The (ACE) Index calculations are based on preliminary data. | |||||||||