Summary
Fifteen named storms occurred across the globe in October. Five of those reached tropical cyclone strength (≥74 mph), and two reached major tropical cyclone strength (≥111 mph). The 15 named storms was the sixth most since 1981, but the numbers of tropical cyclones and major tropical cyclones were both below the 1991-2020 averages. The global accumulated cyclone energy (ACE: an integrated metric of the strength, frequency, and duration of tropical storms) in October was the third lowest since 1981.
The Atlantic had three named storms including one hurricane: Julia. Hurricane Lisa was named on October 31 but became a hurricane on November 2. Both Julia and Lisa tracked through the western Caribbean and made landfall in Central America as hurricanes. The three named storms and one hurricane were both near normal but the ACE for October was below normal. The Atlantic hurricane season January-October remains near normal by most metrics.
The East Pacific had four named storms, including Hurricane Orlene which formed in September. The remnants of Hurricane Julia are also included as it maintained tropical storm strength across Central America and into the East Pacific. Three of those storms became hurricanes including two major hurricanes. These counts were above normal for October. However, the storms were relatively short-lived, so the ACE was near normal for October.
Hurricane Orlene rapidly intensified from a tropical storm to Category 4 within 24 hours before gradually weakening and making landfall in Mexico as a Category 1 hurricane. Three weeks later, Hurricane Roslyn followed a similar track that also included rapid intensification. However, Roslyn maintained Category 3 strength until making landfall in nearly the same place as Orlene. It was the strongest East Pacific landfall since Hurricane Patricia in 2015. Roslyn caused widespread flooding, landslides, and power outages.
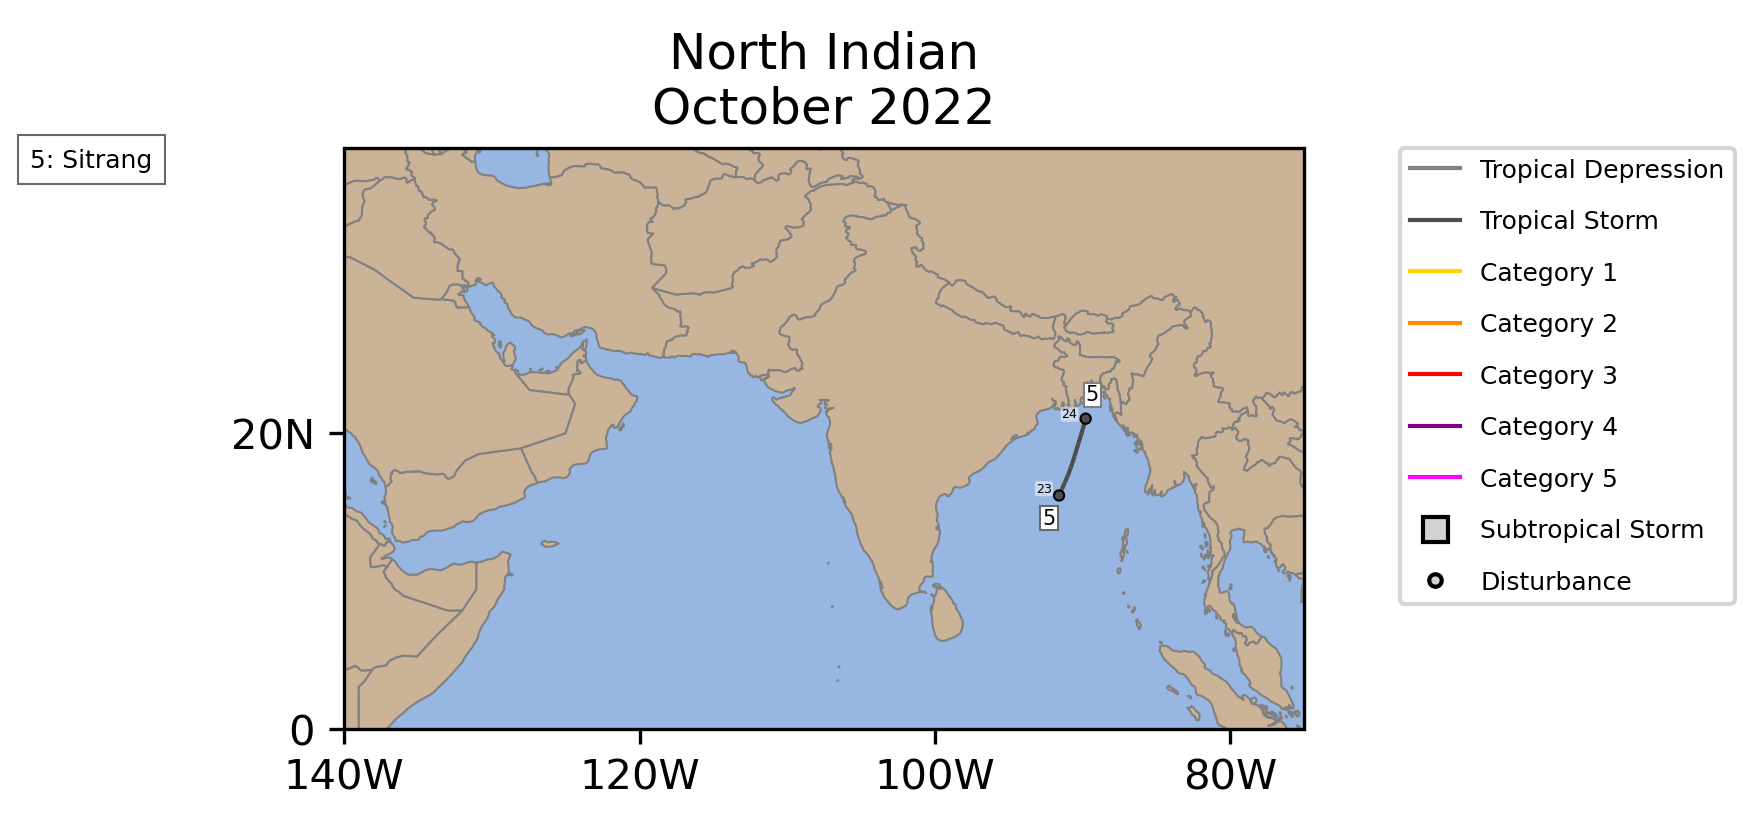
The West Pacific had seven named storms in October, which was above normal. However, only two of those storms became typhoons and none became major typhoons, both of which are below normal. The October ACE was the fifth lowest since 1981. The North and South Indian Ocean also each had one named storm in October, which is near normal.
North Atlantic
| Name |
Maximum CategoryMax Cat |
Dates >39 mph |
Maximum Sustained Winds | Minimum Central Pressure |
|---|---|---|---|---|
 | 1 | October 7Oct 7-10 | 85 mph | 982 mb |
 | TS | October 11Oct 11-14 | 60 mph | 999 mb |
 | 1 | October 31-November 3Oct 31-Nov 3 | 80 mph† | 988 mb† |
| †Value occurred in November | ||||
| Storm Type | Count | 1991-2020 Mean |
1981-2022 Rank* |
1851-2022 Record |
|---|---|---|---|---|
| Tropical Storm Winds ≥ 39 mph (34 kts) | 3 | 3.2 | 14th (tied with 8 other Octobers) | 9 (1950) |
| Hurricane Winds ≥ 74 mph (64 kts) | 1 | 1.7 | 17th (tied with 16 other Octobers) | 5 (1870, 1878, 1950, 2010) |
| Major Hurricane Winds ≥ 111 mph (96 kts) | 0 | 0.8 (8 in 10 Octobers) | 20th (tied with 22 other Octobers) | 3 (2020) |
| Accumulated Cyclone Energy ACE×10⁴ kt² | 5.3 | 21.4 | 29th | 87.8 (1878) |

| Storm Type | Count | 1991-2020 Mean |
1981-2022 Rank* |
1851-2022 Record |
|---|---|---|---|---|
| Tropical Storm Winds ≥ 39 mph (34 kts) | 12 | 13.5 | 19th (tied with 4 other seasons) | 27 (2020) |
| Hurricane Winds ≥ 74 mph (64 kts) | 5 | 6.6 | 25th (tied with 3 other seasons) | 14 (2005) |
| Major Hurricane Winds ≥ 111 mph (96 kts) | 2 | 3.0 | 20th (tied with 11 other seasons) | 7 (2005) |
| Accumulated Cyclone Energy ACE×10⁴ kt² | 84.3 | 115.6 | 23rd | 252.6 (1933) |

East Pacific
| Name |
Maximum CategoryMax Cat |
Dates >39 mph |
Maximum Sustained Winds | Minimum Central Pressure |
|---|---|---|---|---|
 | 4 | September 29-October 3Sep 29-Oct 3 | 130 mph | 949 mb |
 | TS | October 3Oct 3-5 | 45 mph | 1004 mb |
| 1 | October 7Oct 7-10 | 85 mph‡ | 982 mb‡ |
 | 4 | October 20Oct 20-23 | 130 mph | 954 mb |
| ‡Value occurred in the North Atlantic | ||||
| Storm Type | Count | 1991-2020 Mean |
1981-2022 Rank* |
1949-2022 Record |
|---|---|---|---|---|
| Tropical Storm Winds ≥ 39 mph (34 kts) | 4 | 2.8 | 4th (tied with 10 other Octobers) | 6 (1992, 2018) |
| Hurricane Winds ≥ 74 mph (64 kts) | 2 | 1.3 | 9th (tied with 9 other Octobers) | 3 (10 Octobers) |
| Major Hurricane Winds ≥ 111 mph (96 kts) | 2 | 0.7 (7 in 10 Octobers) | 4th (tied with 3 other Octobers) | 3 (1983, 1992, 2018) |
| Accumulated Cyclone Energy ACE×10⁴ kt² | 19.1 | 18.2 | 20th | 78.0 (2018) |

| Storm Type | Count | 1991-2020 Mean |
1981-2022 Rank* |
1949-2022 Record |
|---|---|---|---|---|
| Tropical Storm Winds ≥ 39 mph (34 kts) | 19 | 16.4 | 14th (tied with 2 other seasons) | 27 (1992) |
| Hurricane Winds ≥ 74 mph (64 kts) | 10 | 8.6 | 12th (tied with 4 other seasons) | 16 (1990, 1992) |
| Major Hurricane Winds ≥ 111 mph (96 kts) | 4 | 4.6 | 21st (tied with 4 other seasons) | 10 (1992, 2015, 2018) |
| Accumulated Cyclone Energy ACE×10⁴ kt² | 117.0 | 130.1 | 20th | 315.3 (2018) |

West Pacific
| Name |
Maximum CategoryMax Cat |
Dates >39 mph |
Maximum Sustained Winds | Minimum Central Pressure |
|---|---|---|---|---|
 | 2 | September 28-October 3Sep 28-Oct 3 | 95 mph‖ | 975 mb‖ |
 | TS | October 14Oct 14 | 45 mph | 999 mb |
 | TS | October 14Oct 14 | 40 mph | 998 mb |
 | 2 | October 15Oct 15-20 | 100 mph | 964 mb |
 | TS | October 18Oct 18 | 40 mph | 1004 mb |
 | 1 | October 27-November 2Oct 27-Nov 2 | 80 mph | 979 mb |
 | TS | October 31Oct 31 | 40 mph | 1000 mb |
| ‖Value occurred in September | ||||
| Storm Type | Count | 1991-2020 Mean |
1981-2022 Rank* |
1945-2022 Record |
|---|---|---|---|---|
| Tropical Storm Winds ≥ 39 mph (34 kts) | 7 | 4.3 | 4th (tied with 3 other Octobers) | 9 (1984, 2013) |
| Typhoon Winds ≥ 74 mph (64 kts) | 2 | 3.2 | 30th (tied with 9 other Octobers) | 7 (1992, 2013) |
| Major Typhoon Winds ≥ 111 mph (96 kts) | 0 | 2.1 | 38th (tied with 4 other Octobers) | 5 (1962, 2013) |
| Accumulated Cyclone Energy ACE×10⁴ kt² | 17.0 | 58.1 | 38th | 127.6 (1992) |

| Storm Type | Count | 1991-2020 Mean |
1981-2022 Rank* |
1945-2022 Record |
|---|---|---|---|---|
| Tropical Storm Winds ≥ 39 mph (34 kts) | 20 | 22.8 | 32nd (tied with 2 other seasons) | 34 (1994) |
| Typhoon Winds ≥ 74 mph (64 kts) | 12 | 14.2 | 27th (tied with 3 other seasons) | 24 (1971) |
| Major Typhoon Winds ≥ 111 mph (96 kts) | 5 | 8.3 | 32nd (tied with 3 other seasons) | 14 (1965, 2015) |
| Accumulated Cyclone Energy ACE×10⁴ kt² | 156.8 | 256.2 | 36th | 471.1 (1997) |

North Indian
| Name |
Maximum CategoryMax Cat |
Dates >39 mph |
Maximum Sustained Winds | Minimum Central Pressure |
|---|---|---|---|---|
 | TS | October 23Oct 23-24 | 50 mph | 994 mb |
| Storm Type | Count | 1991-2020 Mean |
1981-2022 Rank* |
1972-2022 Record |
|---|---|---|---|---|
| Tropical Storm Winds ≥ 39 mph (34 kts) | 1 | 1.1 | 14th (tied with 18 other Octobers) | 2 (13 Octobers) |
| Cyclone Winds ≥ 74 mph (64 kts) | 0 | 0.4 (4 in 10 Octobers) | 10th (tied with 32 other Octobers) | 2 (1999, 2014, 2018) |
| Major Cyclone Winds ≥ 111 mph (96 kts) | 0 | 0.3 (3 in 10 Octobers) | 8th (tied with 34 other Octobers) | 2 (1999, 2014) |
| Accumulated Cyclone Energy ACE×10⁴ kt² | 0.8 | 5.3 | 23rd | 26.2 (2019) |
| Storm Type | Count | 1991-2020 Mean |
1981-2022 Rank* |
1972-2022 Record |
|---|---|---|---|---|
| Tropical Storm Winds ≥ 39 mph (34 kts) | 5 | 3.3 | 5th (tied with 5 other seasons) | 6 (1992, 1996, 2006, 2019) |
| Cyclone Winds ≥ 74 mph (64 kts) | 1 | 1.2 | 11th (tied with 14 other seasons) | 4 (2019) |
| Major Cyclone Winds ≥ 111 mph (96 kts) | 0 | 0.8 (8 in 10 seasons) | 20th (tied with 22 other seasons) | 3 (1999, 2019) |
| Accumulated Cyclone Energy ACE×10⁴ kt² | 8.0 | 15.4 | 23rd | 68.9 (2019) |

South Indian
| Name |
Maximum CategoryMax Cat |
Dates >39 mph |
Maximum Sustained Winds | Minimum Central Pressure |
|---|---|---|---|---|
 | TS | October 6Oct 6-9 | 45 mph | 998 mb |
| Storm Type | Count | 1991-2020 Mean |
1981-2022 Rank* |
1956-2022 Record |
|---|---|---|---|---|
| Tropical Storm Winds ≥ 39 mph (34 kts) | 1 | 0.5 (5 in 10 Octobers) | 3rd (tied with 14 other Octobers) | 2 (1993, 2002) |
| Cyclone Winds ≥ 74 mph (64 kts) | 0 | 0.1 (1 in 10 Octobers) | 5th (tied with 38 other Octobers) | 1 (1982, 1984, 1997, 2013) |
| Major Cyclone Winds ≥ 111 mph (96 kts) | 0 | 0.0 (0 in 10 Octobers) | 2nd (tied with 41 other Octobers) | 1 (2013) |
| Accumulated Cyclone Energy ACE×10⁴ kt² | 1.9 | 1.0 | 7th | 12.5 (2013) |

| Storm Type | Count | 1991-2020 Mean |
1981-2022 Rank* |
1956-2022 Record |
|---|---|---|---|---|
| Tropical Storm Winds ≥ 39 mph (34 kts) | 2 | 0.8 (8 in 10 seasons) | 2nd (tied with 5 other seasons) | 3 (1997) |
| Cyclone Winds ≥ 74 mph (64 kts) | 0 | 0.1 (1 in 10 seasons) | 6th (tied with 37 other seasons) | 1 (5 seasons) |
| Major Cyclone Winds ≥ 111 mph (96 kts) | 0 | 0.0 (0 in 10 seasons) | 2nd (tied with 41 other seasons) | 1 (2013) |
| Accumulated Cyclone Energy ACE×10⁴ kt² | 2.5 | 1.6 | 10th | 12.5 (2013) |

Australia
No Australia Tropical Cyclones occurred during October 2022.
| Storm Type | Count | 1991-2020 Mean |
1981-2022 Rank* |
1956-2022 Record |
|---|---|---|---|---|
| Tropical Storm Winds ≥ 39 mph (34 kts) | 0 | 0.1 (1 in 10 Octobers) | 6th (tied with 37 other Octobers) | 1 (5 Octobers) |
| Tropical Cyclone Winds ≥ 74 mph (64 kts) | 0 | 0.0 (0 in 10 Octobers) | 2nd (tied with 41 other Octobers) | 1 (1984) |
| Major Tropical Cyclone Winds ≥ 111 mph (96 kts) | 0 | 0.0 (0 in 10 Octobers) | 1st (tied with 42 other Octobers) | 0 |
| Accumulated Cyclone Energy ACE×10⁴ kt² | 0.0 | 0.2 (2 in 10 Octobers) | 6th (tied with 37 other Octobers) | 2.2 (1984) |

| Storm Type | Count | 1991-2020 Mean |
1981-2022 Rank* |
1956-2022 Record |
|---|---|---|---|---|
| Tropical Storm Winds ≥ 39 mph (34 kts) | 1 | 0.3 (3 in 10 seasons) | 2nd (tied with 9 other seasons) | 2 (1997) |
| Tropical Cyclone Winds ≥ 74 mph (64 kts) | 0 | 0.0 (0 in 10 seasons) | 2nd (tied with 41 other seasons) | 1 (1984) |
| Major Tropical Cyclone Winds ≥ 111 mph (96 kts) | 0 | 0.0 (0 in 10 seasons) | 1st (tied with 42 other seasons) | 0 |
| Accumulated Cyclone Energy ACE×10⁴ kt² | 1.5 | 0.3 (3 in 10 seasons) | 5th | 2.2 (1984) |

Southwest Pacific
No Southwest Pacific Tropical Cyclones occurred during October 2022.
| Storm Type | Count | 1991-2020 Mean |
1981-2022 Rank* |
1956-2022 Record |
|---|---|---|---|---|
| Tropical Storm Winds ≥ 39 mph (34 kts) | 0 | 0.2 (2 in 10 Octobers) | 5th (tied with 38 other Octobers) | 3 (1998) |
| Tropical Cyclone Winds ≥ 74 mph (64 kts) | 0 | 0.0 (0 in 10 Octobers) | 2nd (tied with 41 other Octobers) | 1 (2007) |
| Major Tropical Cyclone Winds ≥ 111 mph (96 kts) | 0 | 0.0 (0 in 10 Octobers) | 2nd (tied with 41 other Octobers) | 1 (2007) |
| Accumulated Cyclone Energy ACE×10⁴ kt² | 0.0 | 0.5 (5 in 10 Octobers) | 5th (tied with 38 other Octobers) | 9.6 (2007) |

| Storm Type | Count | 1991-2020 Mean |
1981-2022 Rank* |
1956-2022 Record |
|---|---|---|---|---|
| Tropical Storm Winds ≥ 39 mph (34 kts) | 0 | 0.3 (3 in 10 seasons) | 7th (tied with 36 other seasons) | 3 (1998) |
| Tropical Cyclone Winds ≥ 74 mph (64 kts) | 0 | 0.0 (0 in 10 seasons) | 2nd (tied with 41 other seasons) | 1 (2007) |
| Major Tropical Cyclone Winds ≥ 111 mph (96 kts) | 0 | 0.0 (0 in 10 seasons) | 2nd (tied with 41 other seasons) | 1 (2007) |
| Accumulated Cyclone Energy ACE×10⁴ kt² | 0.0 | 0.6 (6 in 10 seasons) | 6th (tied with 37 other seasons) | 9.6 (2007) |

Global
| Name |
Maximum CategoryMax Cat |
Dates >39 mph |
Maximum Sustained Winds | Minimum Central Pressure |
|---|---|---|---|---|
| 2 | September 28-October 3Sep 28-Oct 3 | 95 mph‖ | 975 mb‖ |
| 4 | September 29-October 3Sep 29-Oct 3 | 130 mph | 949 mb |
| TS | October 3Oct 3-5 | 45 mph | 1004 mb |
| TS | October 6Oct 6-9 | 45 mph | 998 mb |
| 1 | October 7Oct 7-10 | 85 mph | 982 mb |
| TS | October 11Oct 11-14 | 60 mph | 999 mb |
| TS | October 14Oct 14 | 45 mph | 999 mb |
| TS | October 14Oct 14 | 40 mph | 998 mb |
| 2 | October 15Oct 15-20 | 100 mph | 964 mb |
| TS | October 18Oct 18 | 40 mph | 1004 mb |
| 4 | October 20Oct 20-23 | 130 mph | 954 mb |
| TS | October 23Oct 23-24 | 50 mph | 994 mb |
| 1 | October 27-November 2Oct 27-Nov 2 | 80 mph | 979 mb |
| 1 | October 31-November 3Oct 31-Nov 3 | 80 mph† | 988 mb† |
| TS | October 31Oct 31 | 40 mph | 1000 mb |
| ‖Value occurred in September | ||||
| †Value occurred in November | ||||
| Storm Type | Count | 1991-2020 Mean |
1981-2022 Rank* |
1972-2022 Record |
|---|---|---|---|---|
| Tropical Storm Winds ≥ 39 mph (34 kts) | 15 | 12.1 | 6th (tied with 1 other October) | 20 (1992) |
| Tropical Cyclone Winds ≥ 74 mph (64 kts) | 5 | 6.7 | 29th (tied with 7 other Octobers) | 11 (1992) |
| Major Tropical Cyclone Winds ≥ 111 mph (96 kts) | 2 | 4.0 | 31st (tied with 9 other Octobers) | 7 (2013, 2015, 2016, 2018) |
| Accumulated Cyclone Energy ACE×10⁴ kt² | 44.2 | 104.8 | 40th | 206.3 (2018) |

| Storm Type | Count | 1991-2020 Mean |
1981-2022 Rank* |
1972-2022 Record |
|---|---|---|---|---|
| Tropical Storm Winds ≥ 39 mph (34 kts) | 70 | 76.4 | 31st (tied with 1 other season) | 92 (2018) |
| Tropical Cyclone Winds ≥ 74 mph (64 kts) | 32 | 41.6 | 41st (tied with 1 other season) | 53 (1990) |
| Major Tropical Cyclone Winds ≥ 111 mph (96 kts) | 15 | 22.6 | 38th (tied with 1 other season) | 35 (2015) |
| Accumulated Cyclone Energy ACE×10⁴ kt² | 460.9 | 686.4 | 41st | 1,012.3 (2018) |

Data Description
The data in this report are derived from NCEI's IBTrACS dataset (Knapp et al. 2010; Schreck et al. 2014). IBTrACS tropical cyclone track and intensity data from agencies and sources around the globe. In this report, data from NOAA's National Hurricane Center (NHC) are used for the North Atlantic and East Pacific. The other basins use data from the U.S. Military's Joint Typhoon Warning Center (JTWC).
Historical values use the "best track" data that have been analyzed by forecasters after the season using all available data. Operational procedures and observing systems have changed with time and between regions, which makes these data heterogeneous. Intensity data are generally the most reliable since the early 1970s in the Atlantic (Landsea and Franklin 2013) and since the mid-1980s in other regions (Chu et al. 2002). The number of short-lived storms (≤2 days) has also increased since around 2000 due to improvements in observations and analysis techniques (Landsea et al. 2010).
Values for the current year are provisional values from the operational forecast advisories. IBTrACS obtains these from NCEP's TC Vitals, the NCAR Tropical Cyclone Guidance Project, and NHC provisional data. These values are subject to change during the post-season best track analysis. They also only include 6-hourly storm fixes, which means they may miss special advisories at landfall, peak intensity, etc.
The tropical cyclone seasons in the Southern Hemisphere begin in July and end in June, while the Northern Hemisphere seasons are counted from January to December. Storms are counted in all basins, months, and years in which they occur, which means some storms may appear more than once. However, the global totals only include each storm one time.
References
- Chu, J.-H., C. R. Sampson, A. S. Levine, and E. Fukada, 2002: The joint typhoon warning center tropical cyclone best-tracks, 1945–2000. Naval Research Laboratory, Reference Number NRL/MR/7540-02-16, 22 pp., https://www.metoc.navy.mil/jtwc/products/best-tracks/tc-bt-report.html.
- Knapp, K. R., M. C. Kruk, D. H. Levinson, H. J. Diamond, and C. J. Neumann, 2010: The International Best Track Archive for Climate Stewardship (IBTrACS). Bull. Amer. Meteor. Soc., 91, 363–376, https://doi.org/10.1175/2009BAMS2755.1.
- Landsea, C. W., and J. L. Franklin, 2013: Atlantic Hurricane database uncertainty and presentation of a new database format. Mon. Wea. Rev., 141, 3576–3592, https://doi.org/10.1175/MWR-D-12-00254.1.
- ——, G. A. Vecchi, L. Bengtsson, and T. R. Knutson, 2010: Impact of duration thresholds on Atlantic tropical cyclone counts. J. Climate, 23, 2508–2519, https://doi.org/10.1175/2009JCLI3034.1.
- Schreck, C. J., K. R. Knapp, and J. P. Kossin, 2014: The Impact of Best Track Discrepancies on Global Tropical Cyclone Climatologies using IBTrACS. Mon. Wea. Rev., 142, 3881–3899, https://doi.org/10.1175/MWR-D-14-00021.1.