Summary

Five named storms occurred across the globe in February. Four of those reached tropical cyclone strength (≥74 mph), and one reached major tropical cyclone strength (≥111 mph). The four tropical cyclones were above the 1991-2020 normal of 3.5 for February, but the five named storms and one major tropical cyclone were both below their averages. The global accumulated cyclone energy (ACE: an integrated metric of the strength, frequency, and duration of tropical storms) was nearly twice its normal value and the 2nd highest on record since 1972.
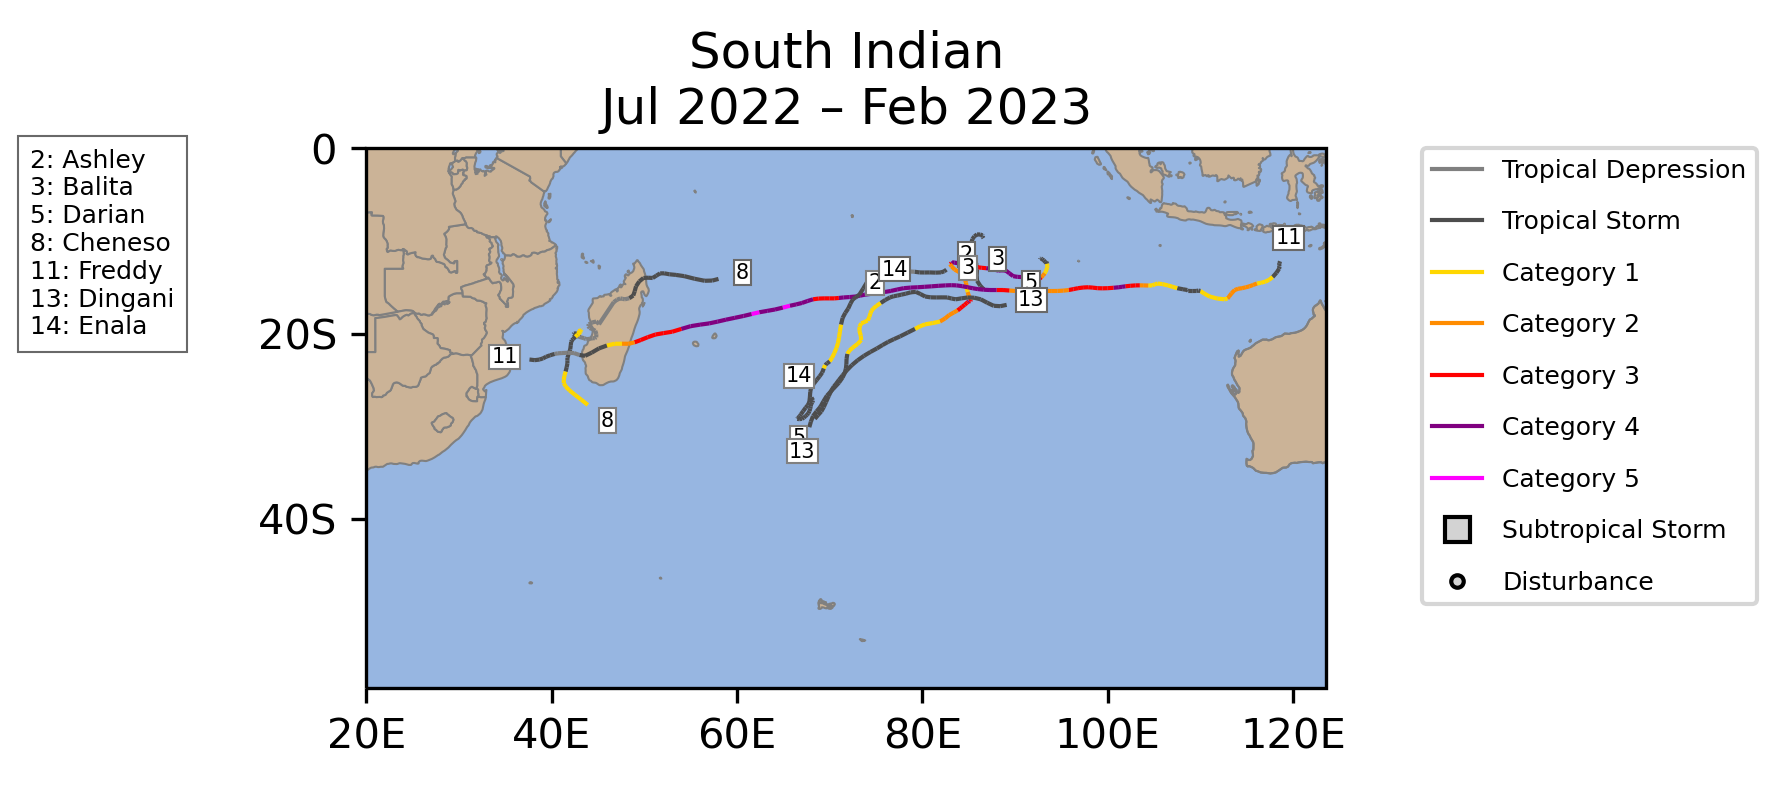
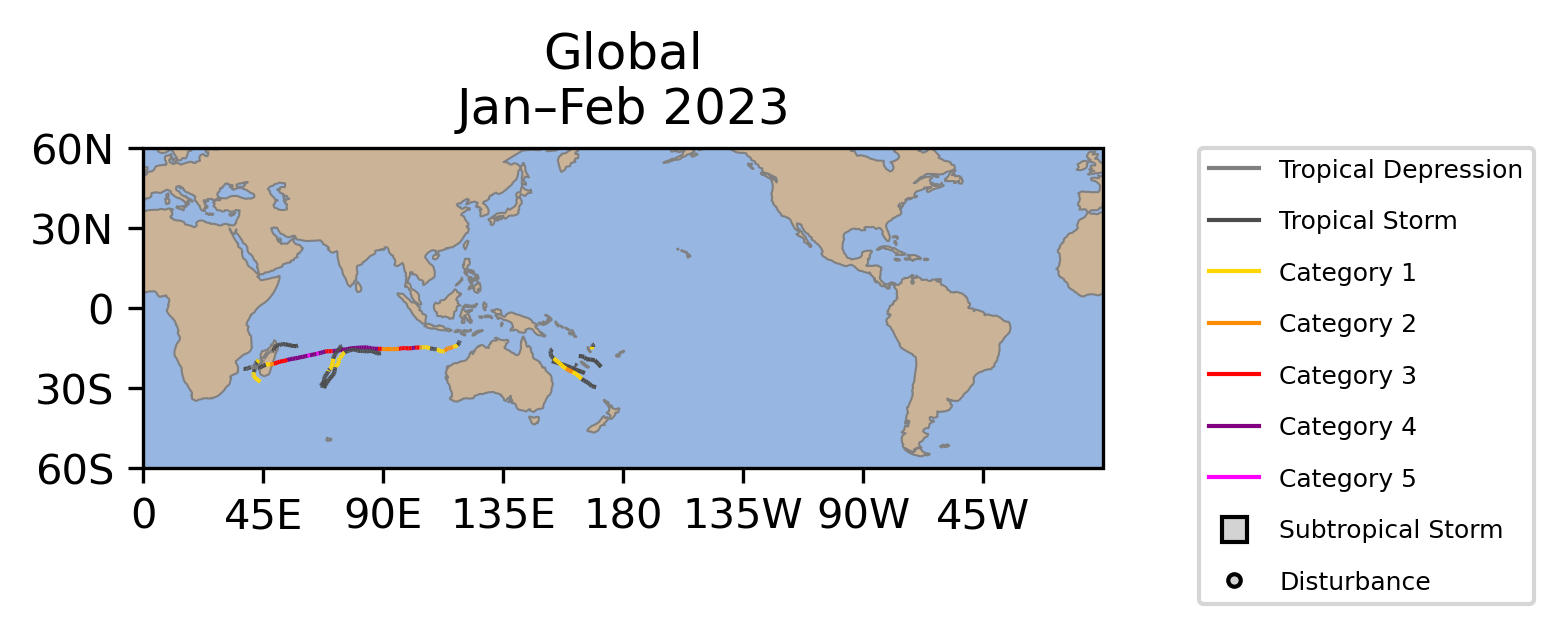
The exceptionally long-lived Tropical Cyclone Freddy in the South Indian Ocean was responsible for 75% of the global ACE in February. Freddy formed on February 6 near Indonesia and remains active as of the writing of this report on March 11. Hurricane/Typhoon John (1994) is the current record holder for the longest lived tropical cyclone at 31 days. It has already been 33 days since Freddy formed. However, Freddy weakened to a tropical depression for seven days when it was over Mozambique. Hurricane/Typhoon Ioke (2006) is the current record holder for ACE from a single storm with about 85 × 104 kt2. Freddy has currently produced about 83 × 104 kt2 and may approach Ioke's record. For reference, NOAA's definition of a near-normal Atlantic Hurricane Season has 73-126 × 104 kt2.
Tropical Cyclone Freddy crossed the entire South Indian Ocean including moving nearly due west between 14°S and 16°S for seven days. The storm also experienced a record six episodes of rapid intensification (30 kt in 24 hours) and became the first Saffir-Simpson hurricane wind scale category 5 storm of 2023. Freddy passed near La Réunion and Mauritius, but its primary impacts were heavy flooding over Madagascar and Mozambique.
No tropical cyclones were active in the Northern Hemisphere during February, which is typical. Freddy formed near Australia and then crossed 90°E into the South Indian Ocean basin. As a result, both basins had one of their top three Februaries on record in terms of ACE. The South Indian Ocean had three tropical cyclones, including Freddy, which was above average. The Australian region had two tropical cyclones, including Freddy, which was also above average. The Southwest Pacific had two named storms including one tropical cyclone, which was near average. However, the ACE was below average. All three Southern Hemisphere basins are near-average in terms of named storms, tropical cyclones, and major tropical cyclones for July 2022-February 2023. However, the Southwest Pacific is below average for ACE, while the other two basins are above average.
North Atlantic
No North Atlantic Tropical Cyclones occurred during February 2023.
| Storm Type | Count | 1991-2020 Mean |
1981-2023 Rank* |
1851-2023 Record |
|---|---|---|---|---|
| Tropical Storm Winds ≥ 39 mph (34 kts) | 0 | 0.0 (0 in 10 Februaries) | 1st (tied with 42 other Februaries) | 1 (1952) |
| Hurricane Winds ≥ 74 mph (64 kts) | 0 | 0.0 (0 in 10 Februaries) | 1st (tied with 42 other Februaries) | 0 |
| Major Hurricane Winds ≥ 111 mph (96 kts) | 0 | 0.0 (0 in 10 Februaries) | 1st (tied with 42 other Februaries) | 0 |
| Accumulated Cyclone Energy ACE×10⁴ kt² | 0.0 | 0.0 (0 in 10 Februaries) | 1st (tied with 42 other Februaries) | 1.3 (1952) |

| Storm Type | Count | 1991-2020 Mean |
1981-2023 Rank* |
1851-2023 Record |
|---|---|---|---|---|
| Tropical Storm Winds ≥ 39 mph (34 kts) | 0 | 0.1 (1 in 10 seasons) | 3rd (tied with 40 other seasons) | 1 (7 seasons) |
| Hurricane Winds ≥ 74 mph (64 kts) | 0 | 0.0 (0 in 10 seasons) | 2nd (tied with 41 other seasons) | 1 (1938, 1955, 2016) |
| Major Hurricane Winds ≥ 111 mph (96 kts) | 0 | 0.0 (0 in 10 seasons) | 1st (tied with 42 other seasons) | 0 |
| Accumulated Cyclone Energy ACE×10⁴ kt² | 0.0 | 0.3 (3 in 10 seasons) | 3rd (tied with 40 other seasons) | 6.5 (1955) |

East Pacific
No East Pacific Tropical Cyclones occurred during February 2023.
| Storm Type | Count | 1991-2020 Mean |
1981-2023 Rank* |
1949-2023 Record |
|---|---|---|---|---|
| Tropical Storm Winds ≥ 39 mph (34 kts) | 0 | 0.0 (0 in 10 Februaries) | 2nd (tied with 41 other Februaries) | 1 (1992) |
| Hurricane Winds ≥ 74 mph (64 kts) | 0 | 0.0 (0 in 10 Februaries) | 2nd (tied with 41 other Februaries) | 1 (1992) |
| Major Hurricane Winds ≥ 111 mph (96 kts) | 0 | 0.0 (0 in 10 Februaries) | 2nd (tied with 41 other Februaries) | 1 (1992) |
| Accumulated Cyclone Energy ACE×10⁴ kt² | 0.0 | 0.3 (3 in 10 Februaries) | 2nd (tied with 41 other Februaries) | 7.9 (1992) |

| Storm Type | Count | 1991-2020 Mean |
1981-2023 Rank* |
1949-2023 Record |
|---|---|---|---|---|
| Tropical Storm Winds ≥ 39 mph (34 kts) | 0 | 0.1 (1 in 10 seasons) | 4th (tied with 39 other seasons) | 1 (1989, 1992, 2016) |
| Hurricane Winds ≥ 74 mph (64 kts) | 0 | 0.1 (1 in 10 seasons) | 3rd (tied with 40 other seasons) | 1 (1992, 2016) |
| Major Hurricane Winds ≥ 111 mph (96 kts) | 0 | 0.0 (0 in 10 seasons) | 2nd (tied with 41 other seasons) | 1 (1992) |
| Accumulated Cyclone Energy ACE×10⁴ kt² | 0.0 | 0.7 (7 in 10 seasons) | 4th (tied with 39 other seasons) | 13.3 (1992) |

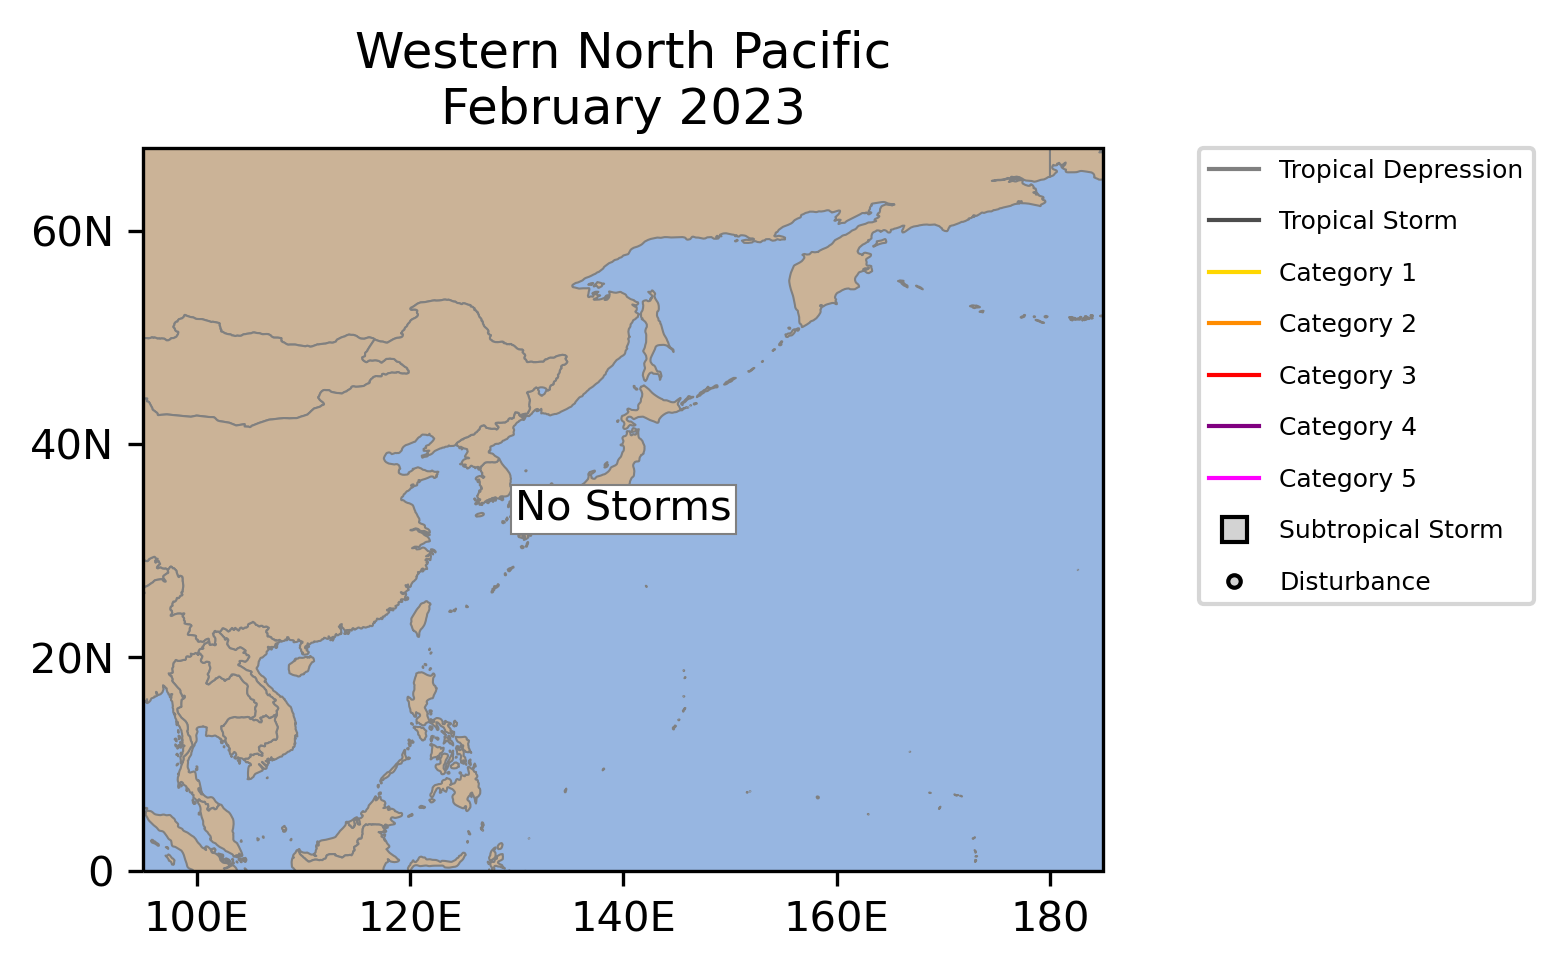
West Pacific
No West Pacific Tropical Cyclones occurred during February 2023.
| Storm Type | Count | 1991-2020 Mean |
1981-2023 Rank* |
1945-2023 Record |
|---|---|---|---|---|
| Tropical Storm Winds ≥ 39 mph (34 kts) | 0 | 0.3 (3 in 10 Februaries) | 11th (tied with 32 other Februaries) | 2 (1965, 1976) |
| Typhoon Winds ≥ 74 mph (64 kts) | 0 | 0.1 (1 in 10 Februaries) | 4th (tied with 39 other Februaries) | 1 (6 Februarys) |
| Major Typhoon Winds ≥ 111 mph (96 kts) | 0 | 0.1 (1 in 10 Februaries) | 3rd (tied with 40 other Februaries) | 1 (1953, 1970, 2015, 2019) |
| Accumulated Cyclone Energy ACE×10⁴ kt² | 0.0 | 1.5 | 11th (tied with 32 other Februaries) | 31.4 (2019) |
| Storm Type | Count | 1991-2020 Mean |
1981-2023 Rank* |
1945-2023 Record |
|---|---|---|---|---|
| Tropical Storm Winds ≥ 39 mph (34 kts) | 0 | 0.7 (7 in 10 seasons) | 22nd (tied with 21 other seasons) | 4 (1965) |
| Typhoon Winds ≥ 74 mph (64 kts) | 0 | 0.2 (2 in 10 seasons) | 10th (tied with 33 other seasons) | 2 (1953, 2015) |
| Major Typhoon Winds ≥ 111 mph (96 kts) | 0 | 0.1 (1 in 10 seasons) | 5th (tied with 38 other seasons) | 2 (1953) |
| Accumulated Cyclone Energy ACE×10⁴ kt² | 0.0 | 2.6 | 22nd (tied with 21 other seasons) | 44.7 (1958) |

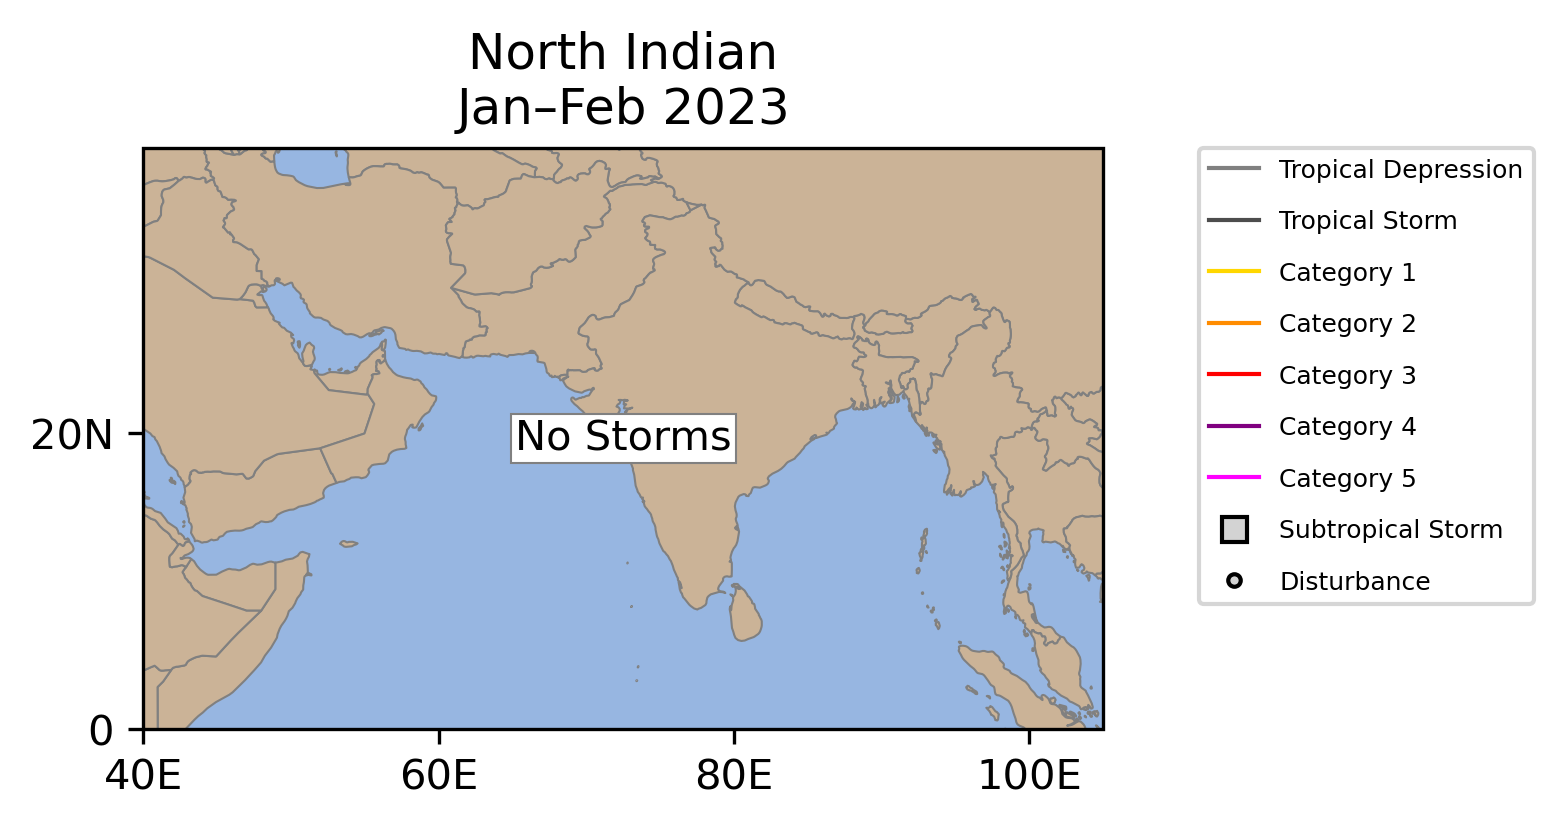
North Indian
No North Indian Tropical Cyclones occurred during February 2023.
| Storm Type | Count | 1991-2020 Mean |
1981-2023 Rank* |
1972-2023 Record |
|---|---|---|---|---|
| Tropical Storm Winds ≥ 39 mph (34 kts) | 0 | 0.0 (0 in 10 Februaries) | 3rd (tied with 40 other Februaries) | 1 (1987, 1999) |
| Cyclone Winds ≥ 74 mph (64 kts) | 0 | 0.0 (0 in 10 Februaries) | 1st (tied with 42 other Februaries) | 0 |
| Major Cyclone Winds ≥ 111 mph (96 kts) | 0 | 0.0 (0 in 10 Februaries) | 1st (tied with 42 other Februaries) | 0 |
| Accumulated Cyclone Energy ACE×10⁴ kt² | 0.0 | 0.0 (0 in 10 Februaries) | 3rd (tied with 40 other Februaries) | 1.8 (1987) |

| Storm Type | Count | 1991-2020 Mean |
1981-2023 Rank* |
1972-2023 Record |
|---|---|---|---|---|
| Tropical Storm Winds ≥ 39 mph (34 kts) | 0 | 0.2 (2 in 10 seasons) | 9th (tied with 34 other seasons) | 1 (8 seasons) |
| Cyclone Winds ≥ 74 mph (64 kts) | 0 | 0.0 (0 in 10 seasons) | 1st (tied with 42 other seasons) | 0 |
| Major Cyclone Winds ≥ 111 mph (96 kts) | 0 | 0.0 (0 in 10 seasons) | 1st (tied with 42 other seasons) | 0 |
| Accumulated Cyclone Energy ACE×10⁴ kt² | 0.0 | 0.2 (2 in 10 seasons) | 9th (tied with 34 other seasons) | 1.8 (1987) |
South Indian
| Name |
Maximum CategoryMax Cat |
Dates >39 mph |
Maximum Sustained Winds | Minimum Central Pressure |
|---|---|---|---|---|
 | 5 | February 6Feb 6-24 | 160 mph | 924 mb |
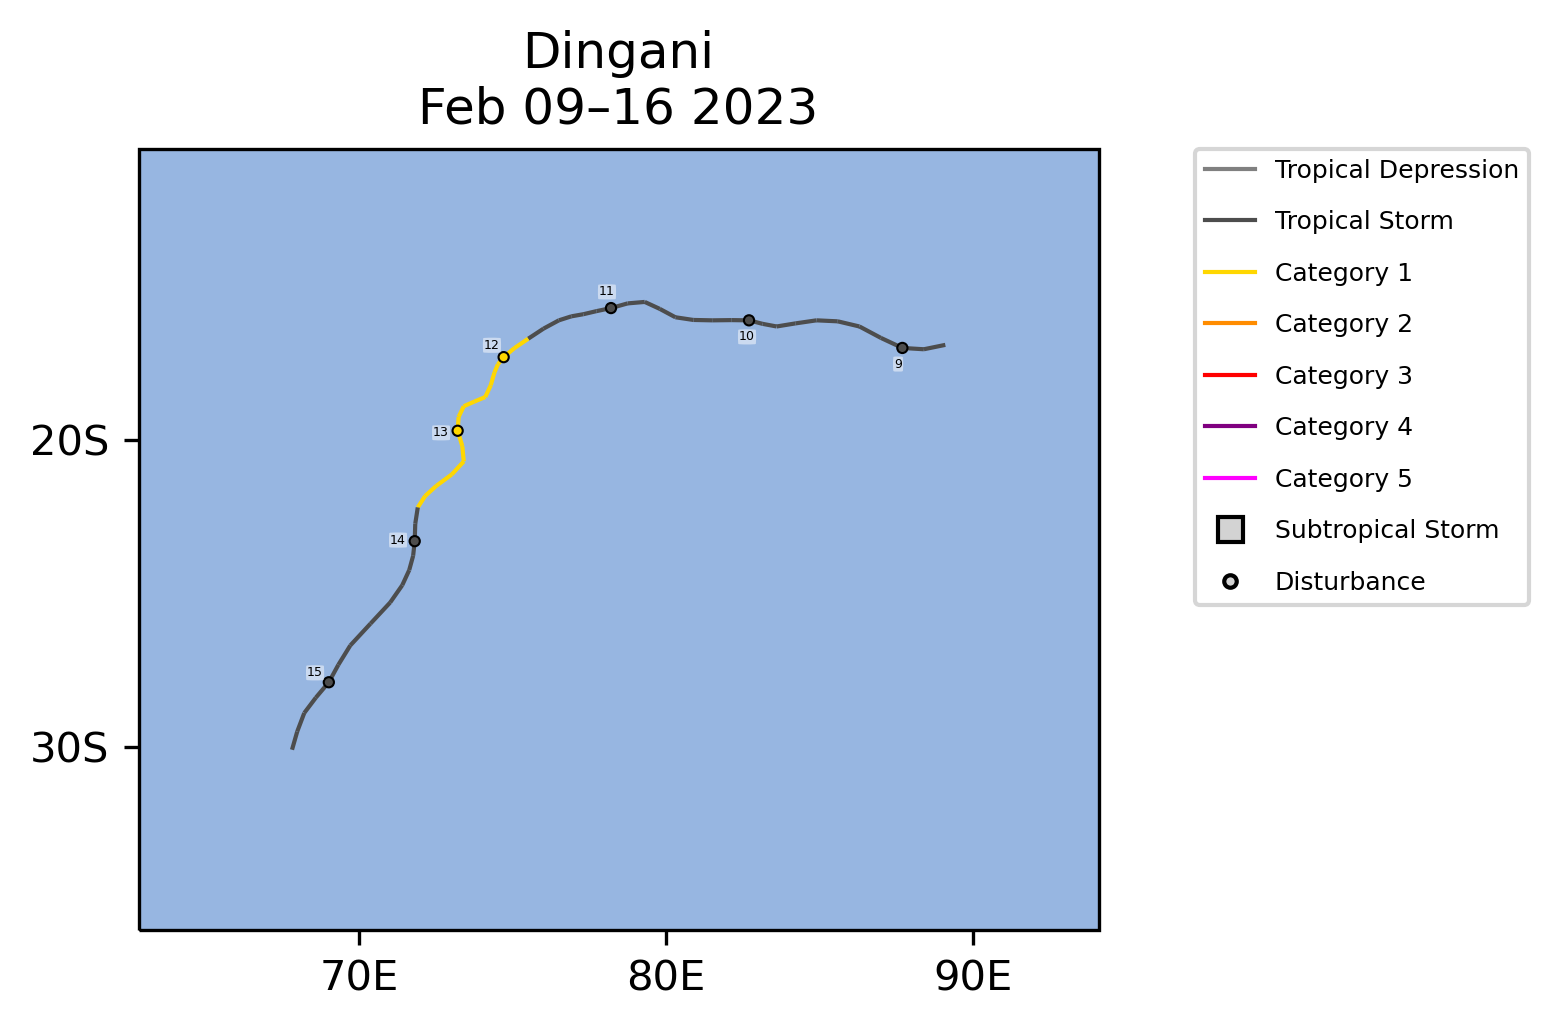 | 1 | February 9Feb 9-16 | 90 mph | 976 mb |
 | 1 | February 22Feb 22-28 | 85 mph | 984 mb |
| Storm Type | Count | 1991-2020 Mean |
1981-2023 Rank* |
1956-2023 Record |
|---|---|---|---|---|
| Tropical Storm Winds ≥ 39 mph (34 kts) | 3 | 2.7 | 11th (tied with 10 other Februaries) | 5 (2000, 2007, 2022) |
| Cyclone Winds ≥ 74 mph (64 kts) | 3 | 1.7 | 3rd (tied with 6 other Februaries) | 4 (1997, 2007) |
| Major Cyclone Winds ≥ 111 mph (96 kts) | 1 | 1.0 | 9th (tied with 18 other Februaries) | 3 (1994, 2007, 2022) |
| Accumulated Cyclone Energy ACE×10⁴ kt² | 59.9 | 22.6 | 2nd | 67.9 (2007) |

| Storm Type | Count | 1991-2020 Mean |
1981-2023 Rank* |
1956-2023 Record |
|---|---|---|---|---|
| Tropical Storm Winds ≥ 39 mph (34 kts) | 7 | 7.5 | 21st (tied with 5 other seasons) | 15 (1997) |
| Cyclone Winds ≥ 74 mph (64 kts) | 5 | 4.0 | 8th (tied with 6 other seasons) | 9 (1997) |
| Major Cyclone Winds ≥ 111 mph (96 kts) | 2 | 2.4 | 17th (tied with 11 other seasons) | 5 (2019) |
| Accumulated Cyclone Energy ACE×10⁴ kt² | 104.1 | 62.3 | 3rd | 147.1 (1997) |
Australia
| Name |
Maximum CategoryMax Cat |
Dates >39 mph |
Maximum Sustained Winds | Minimum Central Pressure |
|---|---|---|---|---|
| 5 | February 6Feb 6-24 | 160 mph† | 924 mb† |
 | 2 | February 8Feb 8-12 | 100 mph | 958 mb |
| †Value occurred in the South Indian | ||||
| Storm Type | Count | 1991-2020 Mean |
1981-2023 Rank* |
1956-2023 Record |
|---|---|---|---|---|
| Tropical Storm Winds ≥ 39 mph (34 kts) | 2 | 2.4 | 25th (tied with 9 other Februaries) | 6 (1971, 1984) |
| Tropical Cyclone Winds ≥ 74 mph (64 kts) | 2 | 0.9 (9 in 10 Februaries) | 3rd (tied with 7 other Februaries) | 4 (1980, 1992) |
| Major Tropical Cyclone Winds ≥ 111 mph (96 kts) | 1 | 0.5 (5 in 10 Februaries) | 4th (tied with 12 other Februaries) | 3 (1992) |
| Accumulated Cyclone Energy ACE×10⁴ kt² | 27.3 | 9.0 | 3rd | 36.9 (1979) |

| Storm Type | Count | 1991-2020 Mean |
1981-2023 Rank* |
1956-2023 Record |
|---|---|---|---|---|
| Tropical Storm Winds ≥ 39 mph (34 kts) | 7 | 6.4 | 15th (tied with 4 other seasons) | 15 (1997) |
| Tropical Cyclone Winds ≥ 74 mph (64 kts) | 3 | 2.5 | 9th (tied with 8 other seasons) | 7 (1996) |
| Major Tropical Cyclone Winds ≥ 111 mph (96 kts) | 2 | 1.1 | 3rd (tied with 6 other seasons) | 4 (1992) |
| Accumulated Cyclone Energy ACE×10⁴ kt² | 40.5 | 28.6 | 10th | 70.8 (1997) |

Southwest Pacific
| Name |
Maximum CategoryMax Cat |
Dates >39 mph |
Maximum Sustained Winds | Minimum Central Pressure |
|---|---|---|---|---|
| 2 | February 8Feb 8-12 | 100 mph‡ | 958 mb‡ |
 | 2 | February 27-March 4Feb 27-Mar 4 | 100 mph‖ | 959 mb‖ |
| ‡Value occurred in the Southwest Pacific | ||||
| ‖Value occurred in March | ||||
| Storm Type | Count | 1991-2020 Mean |
1981-2023 Rank* |
1956-2023 Record |
|---|---|---|---|---|
| Tropical Storm Winds ≥ 39 mph (34 kts) | 2 | 2.0 | 17th (tied with 10 other Februaries) | 5 (1993) |
| Tropical Cyclone Winds ≥ 74 mph (64 kts) | 1 | 1.1 | 10th (tied with 23 other Februaries) | 4 (1989, 2005) |
| Major Tropical Cyclone Winds ≥ 111 mph (96 kts) | 0 | 0.6 (6 in 10 Februaries) | 18th (tied with 25 other Februaries) | 4 (2005) |
| Accumulated Cyclone Energy ACE×10⁴ kt² | 4.6 | 13.4 | 31st | 72.0 (2005) |

| Storm Type | Count | 1991-2020 Mean |
1981-2023 Rank* |
1956-2023 Record |
|---|---|---|---|---|
| Tropical Storm Winds ≥ 39 mph (34 kts) | 5 | 4.7 | 16th (tied with 3 other seasons) | 12 (1998) |
| Tropical Cyclone Winds ≥ 74 mph (64 kts) | 1 | 2.7 | 30th (tied with 9 other seasons) | 8 (1998) |
| Major Tropical Cyclone Winds ≥ 111 mph (96 kts) | 0 | 1.4 | 29th (tied with 14 other seasons) | 4 (2003, 2005) |
| Accumulated Cyclone Energy ACE×10⁴ kt² | 6.5 | 34.5 | 37th | 99.8 (2016) |

Global
| Name |
Maximum CategoryMax Cat |
Dates >39 mph |
Maximum Sustained Winds | Minimum Central Pressure |
|---|---|---|---|---|
| 5 | February 6Feb 6-24 | 160 mph | 924 mb |
| 2 | February 8Feb 8-12 | 100 mph | 958 mb |
| 1 | February 9Feb 9-16 | 90 mph | 976 mb |
| 1 | February 22Feb 22-28 | 85 mph | 984 mb |
| 2 | February 27-March 4Feb 27-Mar 4 | 100 mph‖ | 959 mb‖ |
| ‖Value occurred in March | ||||
| Storm Type | Count | 1991-2020 Mean |
1981-2023 Rank* |
1972-2023 Record |
|---|---|---|---|---|
| Tropical Storm Winds ≥ 39 mph (34 kts) | 5 | 6.8 | 35th (tied with 5 other Februaries) | 11 (1986, 1992) |
| Tropical Cyclone Winds ≥ 74 mph (64 kts) | 4 | 3.5 | 11th (tied with 15 other Februaries) | 7 (1989, 1992) |
| Major Tropical Cyclone Winds ≥ 111 mph (96 kts) | 1 | 2.1 | 25th (tied with 8 other Februaries) | 5 (1992) |
| Accumulated Cyclone Energy ACE×10⁴ kt² | 91.8 | 46.8 | 2nd | 112.2 (1989) |

| Storm Type | Count | 1991-2020 Mean |
1981-2023 Rank* |
1972-2023 Record |
|---|---|---|---|---|
| Tropical Storm Winds ≥ 39 mph (34 kts) | 9 | 12.7 | 39th (tied with 2 other seasons) | 20 (1986) |
| Tropical Cyclone Winds ≥ 74 mph (64 kts) | 5 | 6.4 | 29th (tied with 6 other seasons) | 10 (1997) |
| Major Tropical Cyclone Winds ≥ 111 mph (96 kts) | 1 | 3.3 | 34th (tied with 7 other seasons) | 6 (1994, 2003) |
| Accumulated Cyclone Energy ACE×10⁴ kt² | 104.7 | 91.7 | 13th | 169.4 (1994) |
Data Description
The data in this report are derived from NCEI's IBTrACS dataset (Knapp et al. 2010; Schreck et al. 2014). IBTrACS tropical cyclone track and intensity data from agencies and sources around the globe. In this report, data from NOAA's National Hurricane Center (NHC) are used for the North Atlantic and East Pacific. The other basins use data from the U.S. Military's Joint Typhoon Warning Center (JTWC).
Historical values use the "best track" data that have been analyzed by forecasters after the season using all available data. Operational procedures and observing systems have changed with time and between regions, which makes these data heterogeneous. Intensity data are generally the most reliable since the early 1970s in the Atlantic (Landsea and Franklin 2013) and since the mid-1980s in other regions (Chu et al. 2002). The number of short-lived storms (≤2 days) has also increased since around 2000 due to improvements in observations and analysis techniques (Landsea et al. 2010).
Values for the current year are provisional values from the operational forecast advisories. IBTrACS obtains these from NCEP's TC Vitals, the NCAR Tropical Cyclone Guidance Project, and NHC provisional data. These values are subject to change during the post-season best track analysis. They also only include 6-hourly storm fixes, which means they may miss special advisories at landfall, peak intensity, etc.
The tropical cyclone seasons in the Southern Hemisphere begin in July and end in June, while the Northern Hemisphere seasons are counted from January to December. Storms are counted in all basins, months, and years in which they occur, which means some storms may appear more than once. However, the global totals only include each storm one time.
References
- Chu, J.-H., C. R. Sampson, A. S. Levine, and E. Fukada, 2002: The joint typhoon warning center tropical cyclone best-tracks, 1945–2000. Naval Research Laboratory, Reference Number NRL/MR/7540-02-16, 22 pp., https://www.metoc.navy.mil/jtwc/products/best-tracks/tc-bt-report.html.
- Knapp, K. R., M. C. Kruk, D. H. Levinson, H. J. Diamond, and C. J. Neumann, 2010: The International Best Track Archive for Climate Stewardship (IBTrACS). Bull. Amer. Meteor. Soc., 91, 363–376, https://doi.org/10.1175/2009BAMS2755.1.
- Landsea, C. W., and J. L. Franklin, 2013: Atlantic Hurricane database uncertainty and presentation of a new database format. Mon. Wea. Rev., 141, 3576–3592, https://doi.org/10.1175/MWR-D-12-00254.1.
- ——, G. A. Vecchi, L. Bengtsson, and T. R. Knutson, 2010: Impact of duration thresholds on Atlantic tropical cyclone counts. J. Climate, 23, 2508–2519, https://doi.org/10.1175/2009JCLI3034.1.
- Schreck, C. J., K. R. Knapp, and J. P. Kossin, 2014: The Impact of Best Track Discrepancies on Global Tropical Cyclone Climatologies using IBTrACS. Mon. Wea. Rev., 142, 3881–3899, https://doi.org/10.1175/MWR-D-14-00021.1.