NDP-104 (2020)
NCEI Accession 0221526 Data and Documentation Files
Mapped Observation-Based Oceanic Dissolved Inorganic Carbon (DIC), monthly climatology from January to December (based on observations between 2004 and 2017), from the Max-Planck-Institute for Meteorology (MOBO-DIC_MPIM) (NCEI Accession 0221526)
Lydia Keppler1,2, Peter Landschützer 1; Nicolas Gruber 3; Siv K. Lauvset 4; Irene Stemmler 1
Prepared by Alex Kozyr5
1Max-Planck-Institute for Meteorology (MPI-M), Hamburg, Germany
2International Max Planck Research School on Earth System Modelling (IMPRS-ESM), Hamburg, Germany
3Environmental Physics, Institute of Biogeochemistry and Pollutant Dynamics, ETH Zurich, Switzerland
4NORCE Norwegian Research Centre, Bjerknes Centre for Climate Research, Bergen, Norway
5National Centers for Environmental Information (NCEI), National Oceanic and Atmospheric Administration (NOAA), Silver Spring, MD, USA.


Abstract
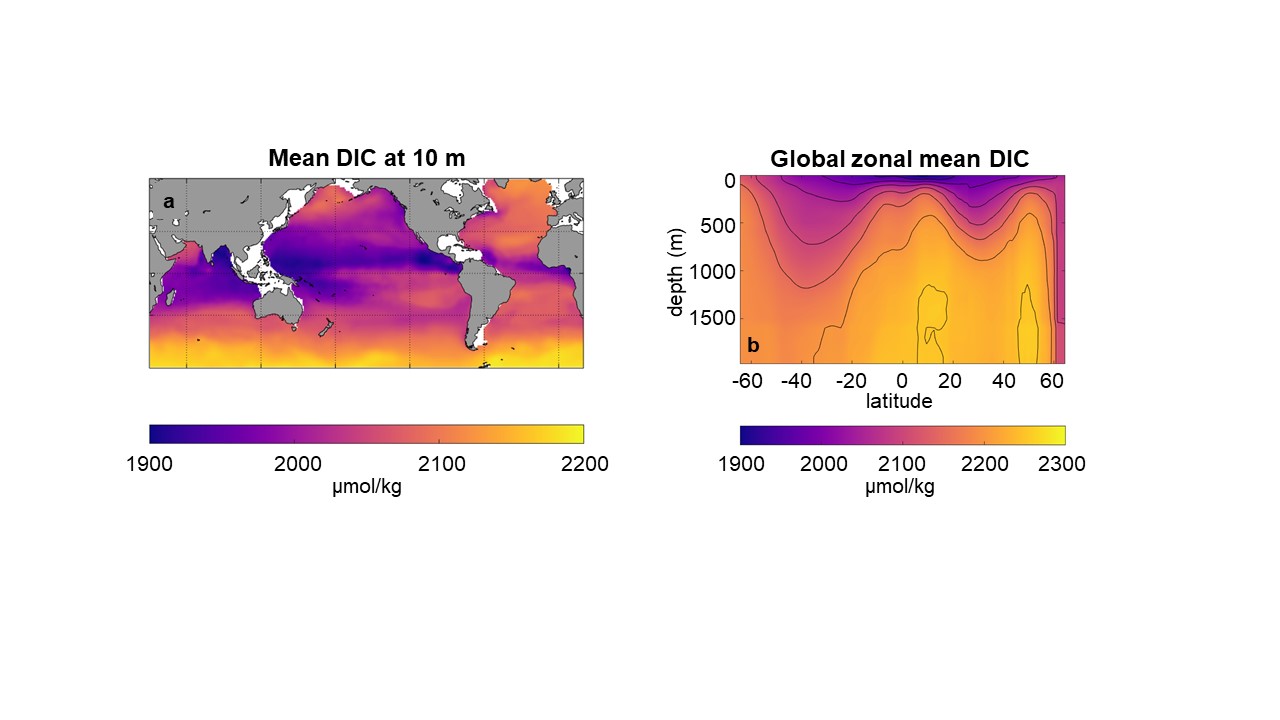
This NCEI accession contains mapped observation-based oceanic dissolved inorganic carbon (DIC), monthly climatology from January to December (based on observations between 2004 and 2017), from the Max-Planck-Institute for Meteorology (MOBO-DIC_MPIM). The SOM-FFN approach by Landschützer et al. (2013) was extended and applied to obtain time-varying gap-filled mapped fields of dissolved inorganic carbon (DIC) in the water column. In the SOM-FFN approach, the first step is to cluster the ocean into regions of similar physical and biogeochemical properties using self-organizing maps (SOM). In the second step, a feed-forward network (FFN) is run in each SOM-cluster to approximate and apply the statistical relationship between the target data (here: DIC), and better constrained predictor data that are available as mapped global fields. The SOM-FFN method was adjusted and in several ways compared to the original method by Landschützer et al. (2013), that mapped oceanic surface pCO2. As we map the DIC in the water column, we extended the mapping grid from three dimensions (latitude, longitude, and time), to four (latitude, longitude, time, and depth), and instead of monthly inter-annual fields, we resolved a monthly climatology based on the period from 2004 through 2017. As different predictors are available and/or meaningful when mapping DIC in the water column, we also have a different set of predictor data compared to the approach used by Landschützer et al. (2013). To overcome potential biases in the random selection of training and internal validation data, a bootstrapping approach was used, running the SOM-FFN method ten times. The mean across this ensemble was taken as the final DIC field. We defined the standard deviation across the ensemble as the uncertainty within the method, and name it ensemble spread.
Please cite this data set as:
Keppler, Lydia; Landschützer, Peter; Gruber, Nicolas; Lauvset, Siv K.; Stemmler, Irene (2020). Mapped Observation-Based Oceanic Dissolved Inorganic Carbon (DIC), monthly climatology from January to December (based on observations between 2004 and 2017), from the Max-Planck-Institute for Meteorology (MOBO-DIC_MPIM) (NCEI Accession 0221526). NOAA National Centers for Environmental Information. Dataset. https://doi.org/10.25921/yvzj-zx46.
Please cite the mapping method as:
Keppler, L., Landschützer, P., Gruber, N., Lauvset, S. K., & Stemmler, I. (2020). Seasonal carbon dynamics in the near‐global ocean. Global Biogeochemical Cycles, 34, e2020GB006571. https://doi.org/10.1029/2020GB006571
Matlab Code
The Matlab Codes written to create this data set can be made available upon request.Content:
The NetCDF file contains*:
-	Dissolved inorganic carbon (DIC in µmol kg-1, on the grid: lon, lat, depth, month)
-	Ensemble spread (DIC_err in µmol kg-1, on the grid: lon, lat, depth, month)
-	Longitude (lon; 179.5°W to 179.5°E, at 1° resolution)
-	Latitude (lat; 64.5°N to 64.5°S, at 1° resolution)
-	Depth (depth; from 2.5 m to 1975 m, on 33 depth levels)
-	Month of the year (month; 1 to 12)
* the first word in the brackets denotes the name of the variables in the NetCDF file
