Pacific pH Crossovers
System Information
The purpose of this analysis was to determine if any significant systematic offset existed between the various legs of the WOCE/NOAA/JGOFS Pacific Ocean measurements of pH. Most of the Pacific Ocean pH measurements used a spectrophotometric method (Clayton and Byrne 1993), with m-cresol purple as the indicator and either scanning or diode array spectrophotometers. The pH values obtained on three cruises - P2, P8S, and the eastern section of P21 - involved potentiometric measurements with a glass electrode.
Some of the pH values were reported on the total hydrogen scale while others were reported on the seawater scale. The seawater scale considers the interaction of hydrogen ions with bisulfate and fluoride ions in seawater, while the total scale includes only the bisulfate contribution (Dickson and Riley 1979; Dickson and Millero 1987). The two scales are linked by the following equation:
pHSWS = pHT - log {(1+[SO42-]T/KHSO4 + [F-]T/KHF)/(1 + [SO42-]T/KHSO4)},
where pHT is a hydrogen ion concentration on the total hydrogen scale, [F-]T and [SO42-]T are the total concentrations of fluoride and sulphate in seawater, and KHF and KHSO4 are the dissociation constants of hydrogen fluoride and sulphate in seawater (Dickson and Riley 1979). All pH values on total hydrogen scale were converted to the seawater scale (pHSWS) to be consistent with published dissociation constants of carbonic acid.
Crossover Analysis
The stations selected for each crossover were those with carbon data which were close to the crossover point. The number of stations selected was somewhat subjective, but was such that sufficient measurements were present for the analysis without getting too far away from the crossover location. In all cases the stations were within approximately 1° of latitude or longitude of the crossover point. Data from deep water (>2000 m) at each of the crossover locations were plotted against the density anomaly referenced to 3000 dB (σ-3) and fit with a second-order polynomial. The difference and standard deviation between the two curves was then calculated from 10 evenly spaced intervals over the density range common to both sets of crossovers. There were only four crossovers where both cruises measured spectrophotometric pH. The average of the absolute value of the differences of pH for those crossover locations was -0.0041±0.0018. No crossover examinations were possible with the potentiometric pH measurements.
| Crossover no. | Old crossover no. | Latitude | Longitude | Cruise 1 | Cruise 1 Stations | Cruise 2 | Cruise 2 Stations | ΔpH |
|---|---|---|---|---|---|---|---|---|
| 40a | 16 | 0 | 170°W | P14S15S | 174 | EQS92 | 56 | -0.0036±0.001 |
| 40i | 13 | 5°S | 170°W | P14S15S | 169 | EQS92 | 63 | -0.0060±0.001 |
| 41b | 8 | 10°S | 170°W | P14S15S | 157,159,161 | EQS92 | 66 | -0.0018±0.001 |
| 41c | 10 | 10°S | 170°W | P14S15S | 157,159,161 | P31 | 54,57,61 | -0.0049±0.001 |
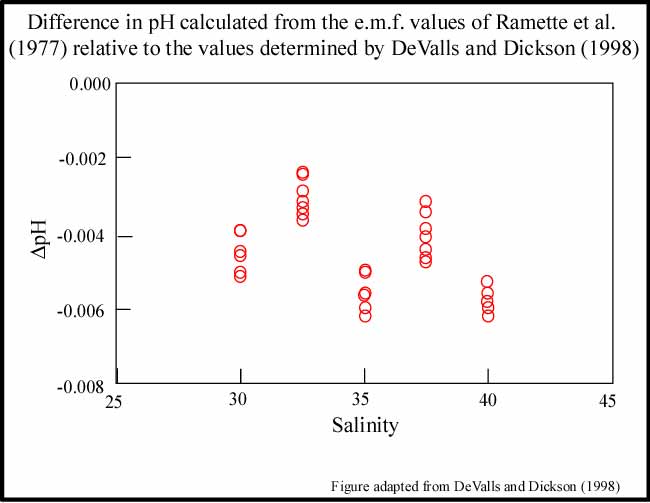
The limited number of crossovers available for this study suggests that the spectrophotometric pH measurements were very precise and consistent between cruises. DeValls and Dickson (1998) have suggested, however, that the pH values initially assigned to the tris buffers used to characterize the indicator, m-cresol purple, should be increased by 0.0047. This revision would translate into a comparable increase in the pHT values reported for the Pacific Ocean. An upward adjustment in the reported pHT values is further supported by internal consistency evaluations by McElligott et al. (1998), Lee et al. (2000), and as a part of this study. Laboratory experiments are still necessary to better constrain the exact magnitude of this adjustment.
Summary
The crossover comparisons suggest very good precision, but because of the small number of comparisons available, no further statistical analysis was done with this carbon parameter. No crossover examinations were possible with the potentiometric pH measurements. Given the mounting evedence for the need to adjust the spectrophotometric pH values, we recommend adjusting all spectrophotometric pH values upward by 0.0047 to be internally consistent with the other carbon parameters. Here is a summary tablea> of analytical techniques, PIs, sample volumes, and shorebased analysis for pH.
References
- Clayton T. and R. H. Byrne. 1993. Spectrophotometric seawater pH measurements: total hydrogen ion concentration scale calibration of m-cresol purple and at-sea results. Deep-Sea Research, 40:2115-2129.
- DeValls, T. A. and A. G. Dickson. 1998. The pH of buffers based on 2-amino-2-hydroxymethyl-1,3-propanediol ("tris") in synthetic seawater. Deep-Sea Research 45:1541-1554.
- Dickson, A.G., and F.J. Millero. 1987. A comparison of the equilibrium constants for the dissociation of carbonic acid in seawater media. Deep-Sea Research, 34:1733-1743.
- Dickson, A.G. and J.P. Riley. 1979. The estimation of acid dissociation constants in seawater media from potentiometric titrations with strong base: I. The ionic product of water-KW. Marine Chemistry 7:89-99.
- Lee, K., F. J. Millero, R. H. Byrne, R. A. Feely and R. Wanninkhof. 2000. The Recommended Dissociation Constants of Carbonic Acid for Use in Seawater. Geophysical Research Letters 27:229-232.
- McElligott, S., R.H. Byrne, K. Lee, R. Wanninkhof, F.J. Millero, and R.A. Feely. 1998. Discrete water column measurements of CO2 fugacity and pHT in seawater: A comparison of direct measurements and thermodynamic calculations, Marine Chemistry, 60:63-73.