The Pacific Ocean Database Synthesis
Between 1991 and 1999, investigators from 15 different laboratories and 4 countries analyzed carbon measurements on 25 WOCE/JGOFS/OACES cruises in the Pacific Ocean. The Pacific Ocean database compiled from these measurements consists of over 136,000 unique sample locations from these cruises. Carbon measurements were made as part of the DOE-funded JGOFS Global Survey. Details of the WOCE/JGOFS Pacific Ocean CO2 measurement program—including personnel, sampling and measurement protocols, and data quality assurance/quality control checks—are described in Lamb et al. 2002. Table 1 is the Pacific Ocean cruise and personnel summary.
The Pacific Ocean quality assessment required a much greater effort than did the Indian Ocean assessment. In the Indian Ocean the same parameters were measured with exactly the same equipment, the cruises were carried out as one expedition over a 2-year period, and CRMs were used on all WOCE and NOAA legs. The Pacific measurements involved many of the same principal investigators as the Indian Ocean expedition, but each group used different equipment, different parameter combinations were measured, and the measurements were spread over 8 years. During this synthesis work, we compiled data from 26 cruises in the Pacific Ocean, including data from Canadian, Japanese, and Australian cruises. Our assessment of the Pacific TCO2 data indicates that the reported values are accurate to ±3 µmol/kg after recommended adjustments of +4, -7, and -4 µmol/kg for legs P16N, P17N, and P2, respectively. The TALK data are generally good to ±5 µmol/kg after adjustments of +6, -9, -12, +14, and -6 µmol/kg for legs P08S, P17C, P17N, P02, and P31, respectively. We also adjusted all reported spectrophotometric pH values by +0.0047 to improve the internal consistency with the other carbon measurements. The Pacific Ocean correction factors are presented in Table 2.
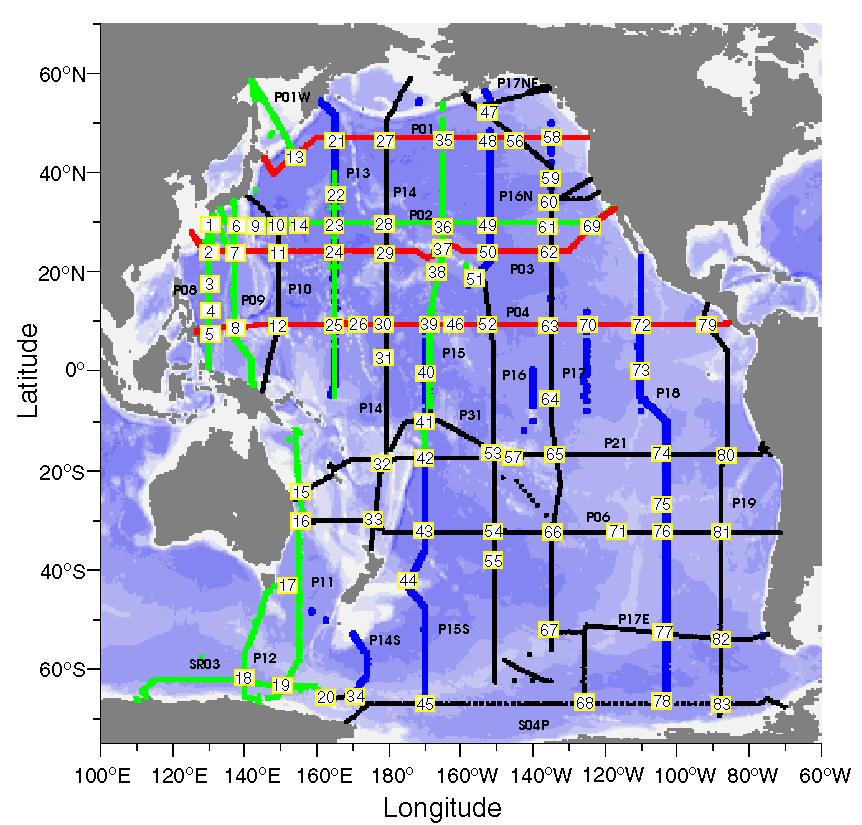
This page contains detailed information on the QA/QC procedures used to examine the quality of the Pacific data. These procedures can be used to infer the internal consistency of the basinwide data set and may be used to infer an offset with a given parameter on a particular cruise (see Table 2). The primary means of evaluating the internal consistency of the data was to compare deep-water concentrations in locations where two or more cruises intersect or overlap. Crossover locations are given in this figure.
Tables
- Table 1 gives details about the Pacific Ocean cruise summary
- Table 2 gives detailed information about Pacific Ocean cruise personnel
- Table 3 gives detailed information about summary of CRM and duplicate analyses
- Examination of the internal consistency and accuracy of the Pacific Ocean data are presented here
- Recommended adjustments for an internally consistent Pacific Ocean database are given here