Global Surface Summary of the Day - GSOD
Global Summary of the Day
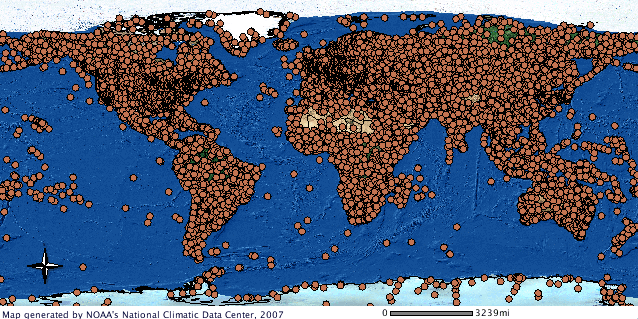 Global Surface Summary of the Day GIS map
Global Surface Summary of the Day is derived from The Integrated Surface Hourly (ISH) dataset. The ISH dataset includes global data obtained from the USAF Climatology Center, located in the Federal Climate Complex with NCDC. The latest daily summary data are normally available 1-2 days after the date-time of the observations used in the daily summaries. The online data files begin with 1929 and are at the time of this writing at the Version 8 software level. Over 9000 stations' data are typically available. The daily elements included in the dataset (as available from each station) are: Mean temperature (.1 Fahrenheit) Mean dew point (.1 Fahrenheit) Mean sea level pressure (.1 mb) Mean station pressure (.1 mb) Mean visibility (.1 miles) Mean wind speed (.1 knots) Maximum sustained wind speed (.1 knots) Maximum wind gust (.1 knots) Maximum temperature (.1 Fahrenheit) Minimum temperature (.1 Fahrenheit) Precipitation amount (.01 inches) Snow depth (.1 inches) Indicator for occurrence of: Fog, Rain or Drizzle, Snow or Ice Pellets, Hail, Thunder, Tornado/Funnel Cloud Global summary of day data for 18 surface meteorological elements are derived from the synoptic/hourly observations contained in USAF DATSAV3 Surface data and Federal Climate Complex Integrated Surface Hourly (ISH). Historical data are generally available for 1929 to the present, with data from 1973 to the present being the most complete. For some periods, one or more countries' data may not be available due to data restrictions or communications problems. In deriving the summary of day data, a minimum of 4 observations for the day must be present (allows for stations which report 4 synoptic observations/day). Since the data are converted to constant units (e.g, knots), slight rounding error from the originally reported values may occur (e.g, 9.9 instead of 10.0). The mean daily values described below are based on the hours of operation for the station. For some stations/countries, the visibility will sometimes 'cluster' around a value (such as 10 miles) due to the practice of not reporting visibilities greater than certain distances. The daily extremes and totals--maximum wind gust, precipitation amount, and snow depth--will only appear if the station reports the data sufficiently to provide a valid value. Therefore, these three elements will appear less frequently than other values. Also, these elements are derived from the stations' reports during the day, and may comprise a 24-hour period which includes a portion of the previous day. The data are reported and summarized based on Greenwich Mean Time (GMT, 0000Z - 2359Z) since the original synoptic/hourly data are reported and based on GMT.
- Cite as: NOAA National Centers of Environmental Information. 1999. Global Surface Summary of the Day - GSOD. 1.0. [indicate subset used]. NOAA National Centers for Environmental Information. Accessed [date].
- NCEI DSI 3505 (subset)
- gov.noaa.ncdc:C00516
C00516
| Search Data |
|
| Download Data |
|
| Distribution Formats |
|
| Ordering Instructions | Contact NCEI for other distribution options and instructions. |
| Distributor | NOAA National Centers for Environmental Information
ncei.info@noaa.gov |
| Dataset Point of Contact | User Engagment and Services Branch
DOC/NOAA/NESDIS/NCEI > National Centers for Environmental Information, NESDIS, NOAA, U.S. Department of Commerce 828-271-4800 ncei.orders@noaa.gov |
| Time Period | 1929-01-01 to Present |
| Spatial Bounding Box Coordinates |
N: 90.0
S: -90.0
E: 180.0
W: -180.0
|
| Spatial Coverage Map | |
| General Documentation |
|
| Publication Dates |
|
| Data Presentation Form | Digital table - digital representation of facts or figures systematically displayed, especially in columns
|
| Dataset Progress Status | Complete - production of the data has been completed |
| Data Update Frequency | As needed |
| Purpose | Global summary of the day is comprised of a dozen daily averages computed from global hourly station data. Daily weather elements include mean values of: temperature, dew point temperature, sea level pressure, station pressure, visibility, and wind speed plus maximum and minimum temperature, maximum sustained wind speed and maximum gust, precipitation amount, snow depth, and weather indicators. With the exception of U.S. stations, 24-hour periods are based upon UTC times. Values are usually delayed 24-48 hours from the time of observation. |
| Dataset Citation |
|
| Cited Authors |
|
| Originators |
|
| Publishers |
|
| Theme keywords | Global Change Master Directory (GCMD) Science Keywords
|
| Data Center keywords | Global Change Master Directory (GCMD) Data Center Keywords
|
| Place keywords | Global Change Master Directory (GCMD) Location Keywords
|
| Stratum keywords | Global Change Master Directory (GCMD) Location Keywords
|
| Use Constraints |
|
| Access Constraints |
|
| Fees |
|
| Lineage Statement | The Global Summary of the Day is a subset from the Integrated Surface Hourly dataset (DSI-3505) that allow for "on-the-fly" calculations for users. |
| Source Datasets |
|
| Processing Steps |
|
| Instrument |
|
| Platform |
|
Last Modified: 2023-08-03
For questions about the information on this page, please email: ncei.info@noaa.gov