The contiguous United States had its 8th warmest and 11th wettest spring

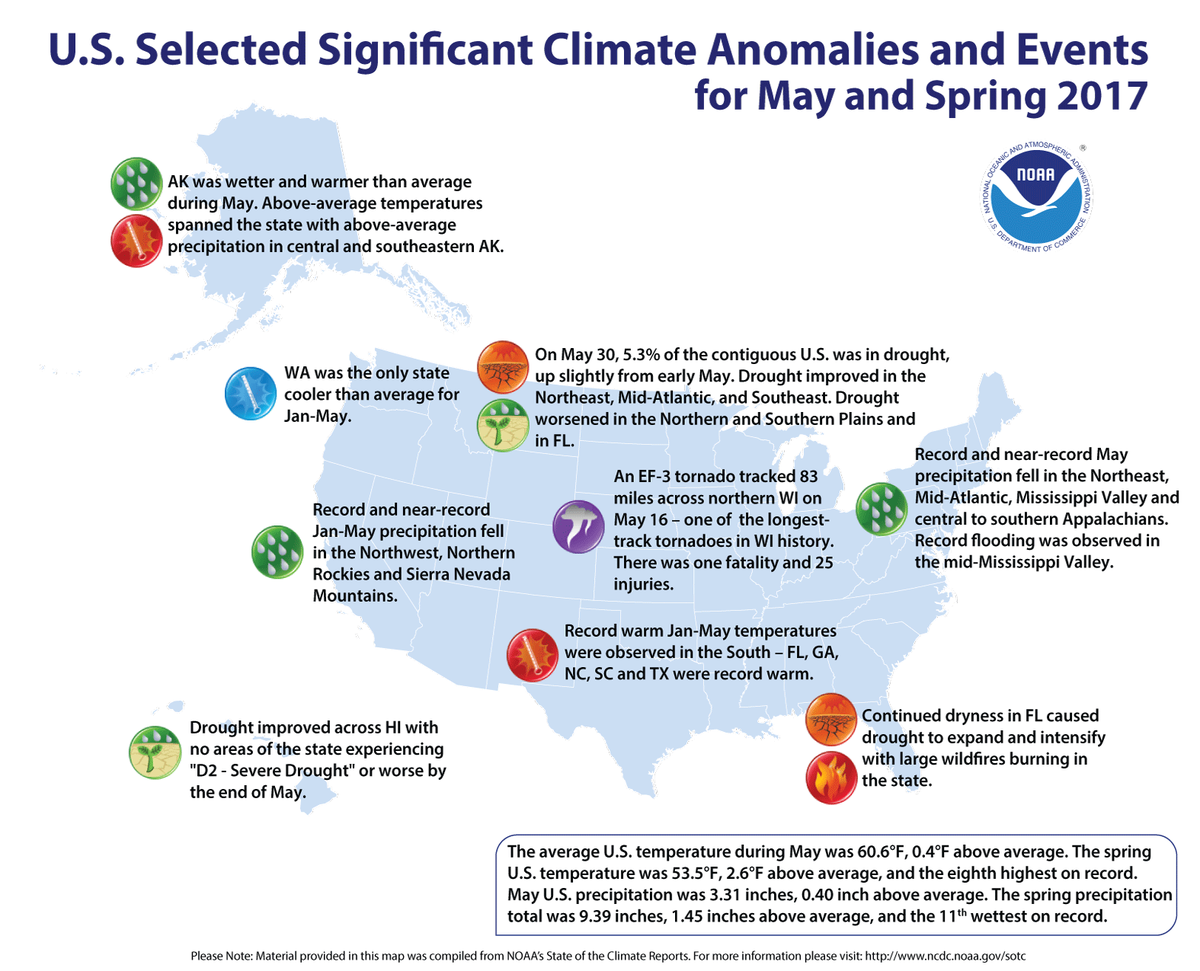
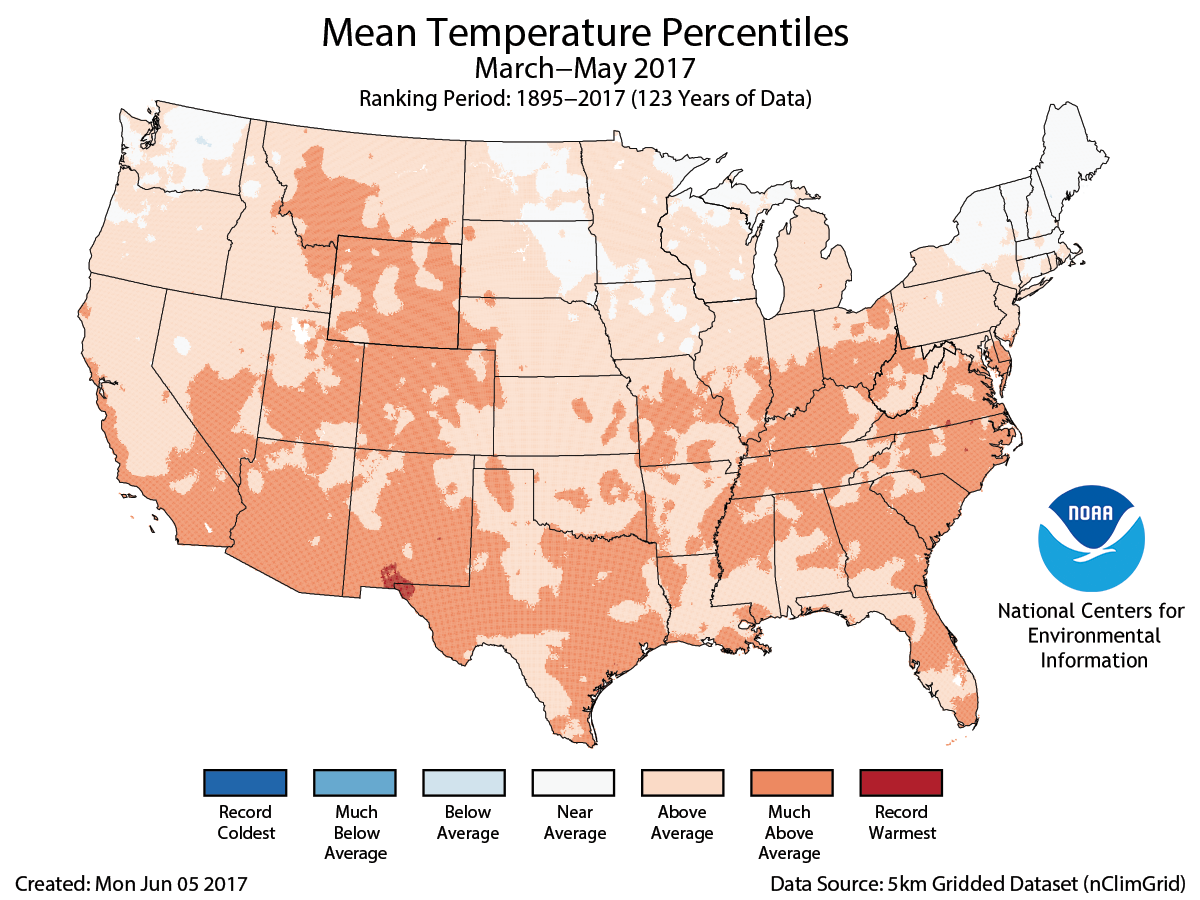
The spring (March–May) average temperature for the contiguous U.S. was 53.5°F, 2.6°F above the 20th century average, driven in large part by warmth during the early and middle part of the season. Much-above-average spring temperatures were observed in the Rockies, Southern Plains, Midwest, and Southeast.
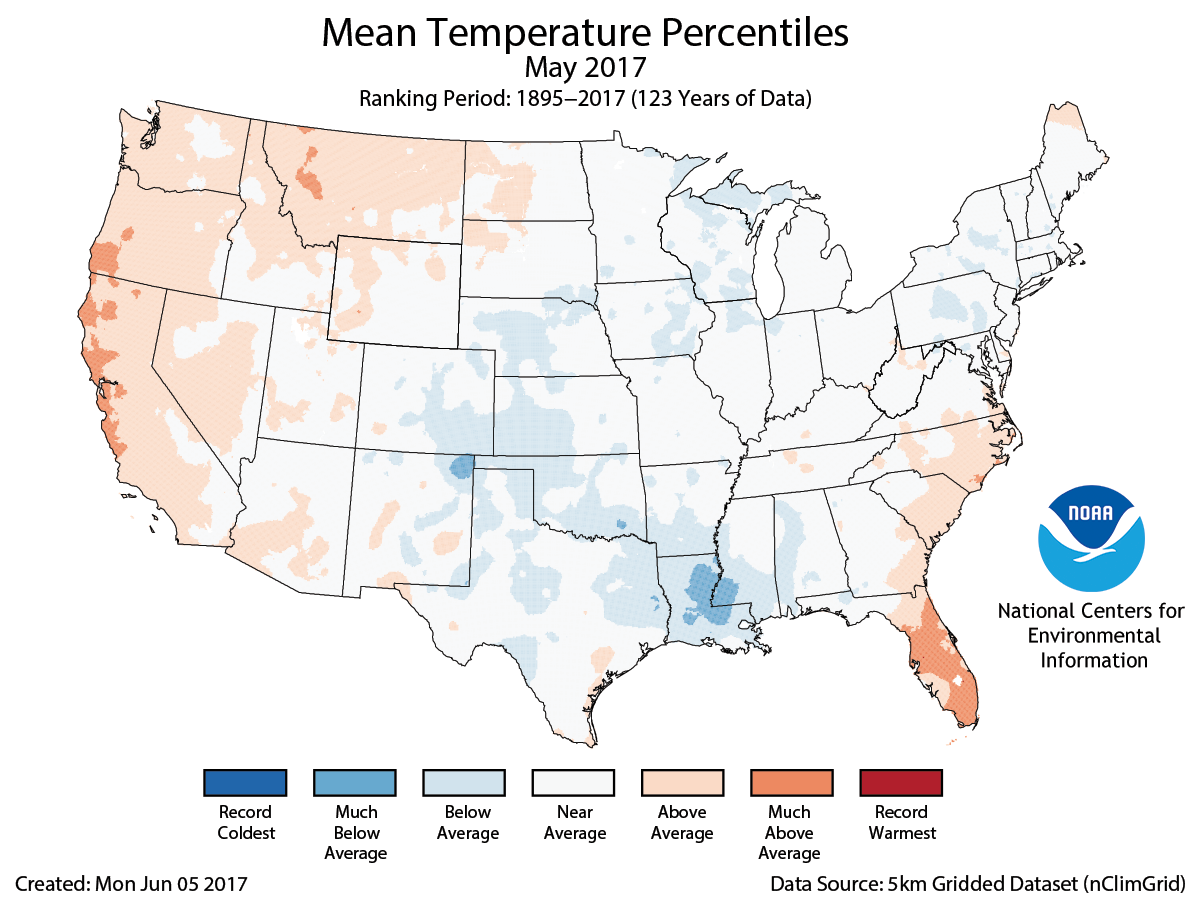
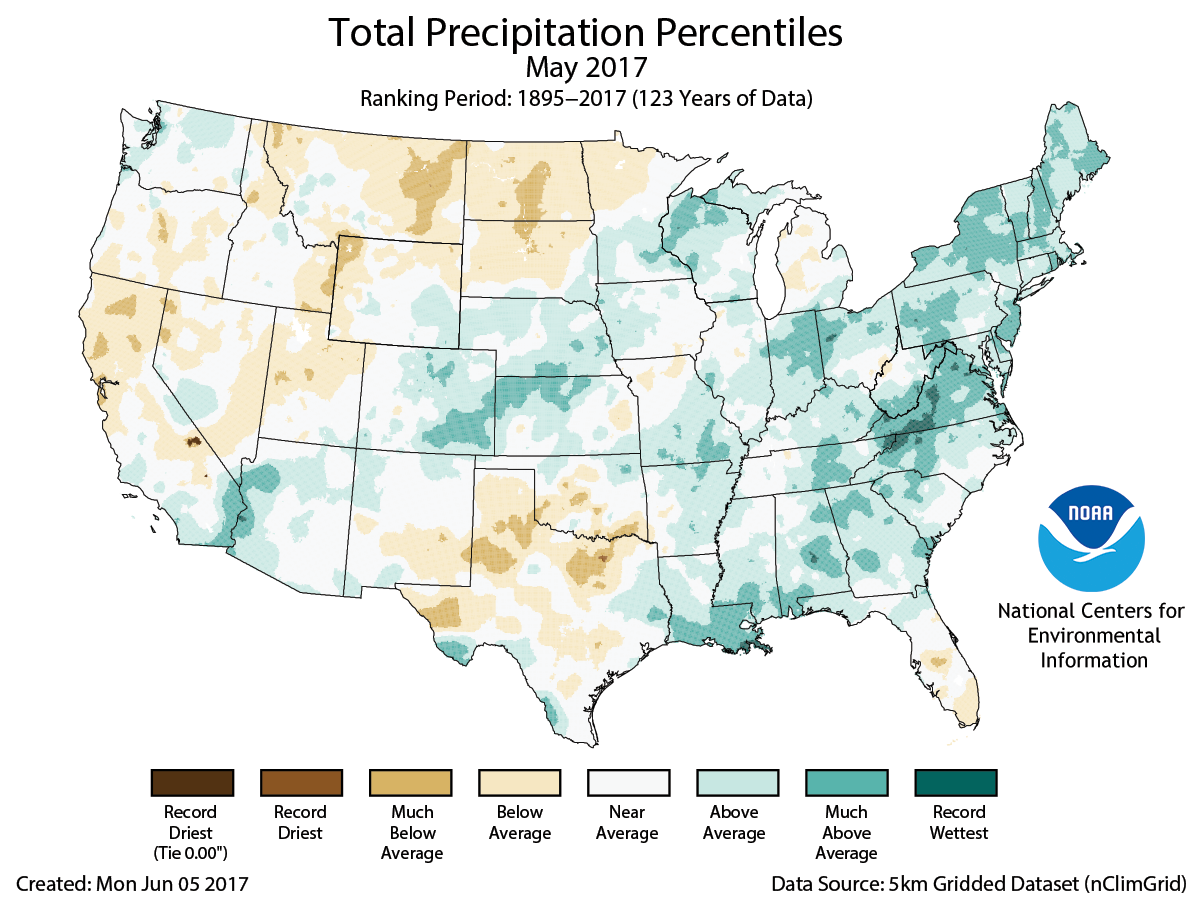
The May average temperature for the contiguous U.S. was 60.6°F, 0.4°F above average, and ranked near the middle of the 123-year period of record. Parts of the West and Southeast were warmer than average with near- to below-average temperatures in parts of the central and eastern U.S.
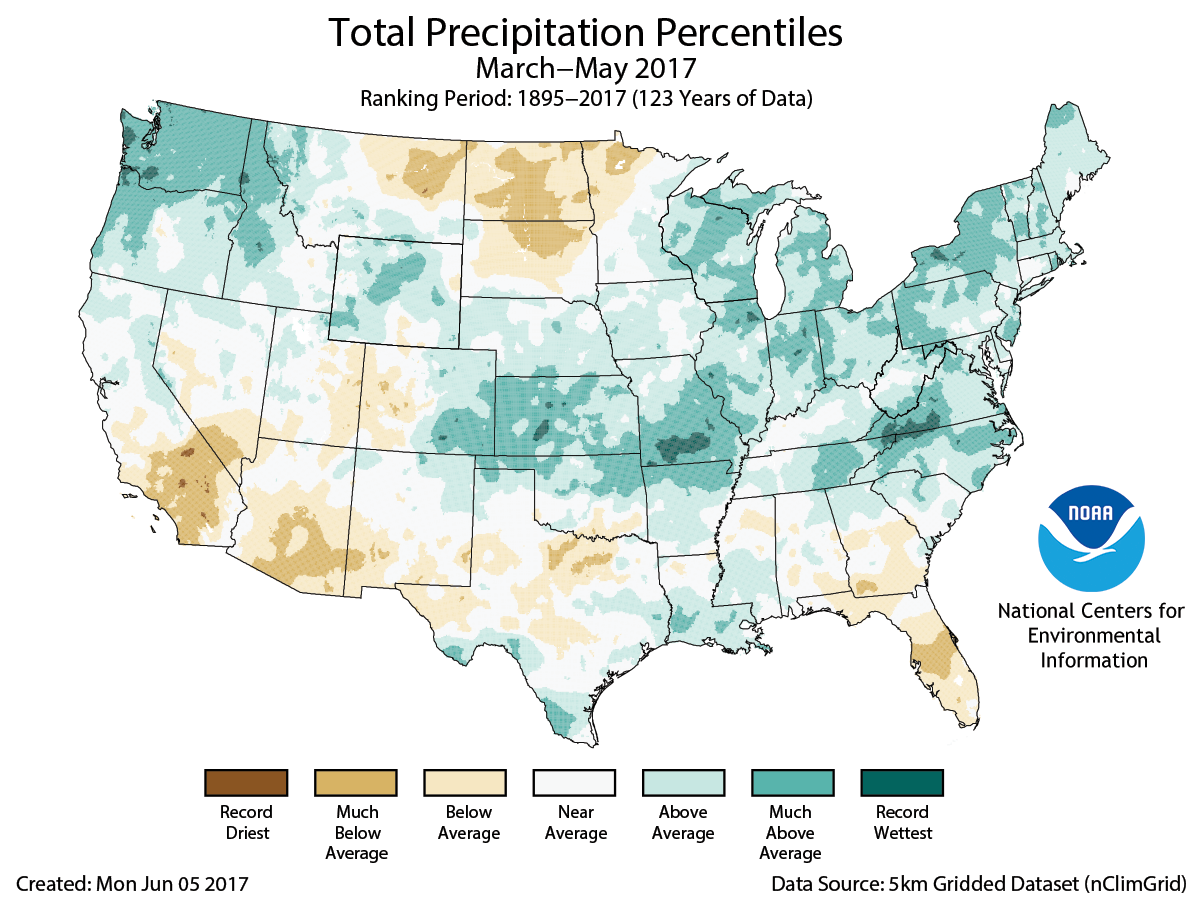
The spring precipitation total was 9.39 inches, 1.45 inches above the 20th century average. Much-above-average precipitation fell across the Northwest, Central Plains, Mid-Mississippi Valley, Great Lakes, and Mid-Atlantic. The Northern Plains, Southwest, and Florida were drier than average.
The May contiguous U.S. precipitation total was 3.31 inches, 0.40 inch above average, tying 2009 as the 25th wettest on record.
See all May, spring, and year-to-date U.S. temperature and precipitation maps.
This monthly summary is part of the suite of climate information services NOAA provides to government, business, academia, and the public to support informed decision-making.
Spring Temperature
-
Above-average temperatures spanned the nation during spring, with near-average temperatures observed in parts of the Northwest and Northeast. Nineteen states across the Rockies, Southern Plains, and Midwest had spring temperatures that were much above average. No state had a record warm or cold spring. For locations from the Rockies to East Coast, the majority of the seasonal warmth occurred during early- and mid-spring.
Spring Precipitation
-
Above-average precipitation was observed from coast to coast, with 15 states in the Northwest, Central Plains, Mid-Mississippi Valley, Great Lakes, and Mid-Atlantic much wetter than average. No state had a spring precipitation total that was record wet. Below-average precipitation was observed in the Southwest, Northern Plains, and Florida. North Dakota had its ninth driest spring on record. No state was record dry.
Spring Extremes
-
The U.S. Climate Extremes Index (USCEI) for spring was above average and ranked as the 19th highest value on record. On the national scale, extremes in warm maximum and minimum temperatures, one-day precipitation totals, and days with precipitation were above average. The USCEI is an index that tracks extremes (falling in the upper or lower 10 percent of the record) in temperature, precipitation, and drought across the contiguous U.S.
May Temperature
-
Above-average temperatures were observed along the West Coast and into the Great Basin and Northern Rockies as well as along the coastal Southeast. Below-average temperatures were observed in parts of the Great Plains, Upper Midwest, and Lower-Mississippi Valley. In the East and Midwest, above-average precipitation was associated with suppressed daytime maximum temperatures, while nighttime minimum temperatures remained above average. No state had a record warm or record cold May temperature.
May Precipitation
-
Above-average precipitation fell across most of the East and parts of the Rockies and Great Plains. Areas along the East and Gulf Coasts were particularly wet, with 10 states much wetter than average. Below-average precipitation was observed in the West, Northern Plains and Rockies, southern Florida, and the Southern Plains.
-
According to the May 30 U.S. Drought Monitor report, 5.3 percent of the contiguous U.S. was in drought, up 0.3 percent compared to the May 2 values. This continues the near-record low levels of drought that began in April. Drought improved across the Northeast, Mid-Atlantic, and Southeast. Drought worsened in the Northern and Southern Plains as well as in central and northern Florida.
Year-to-Date Temperature
-
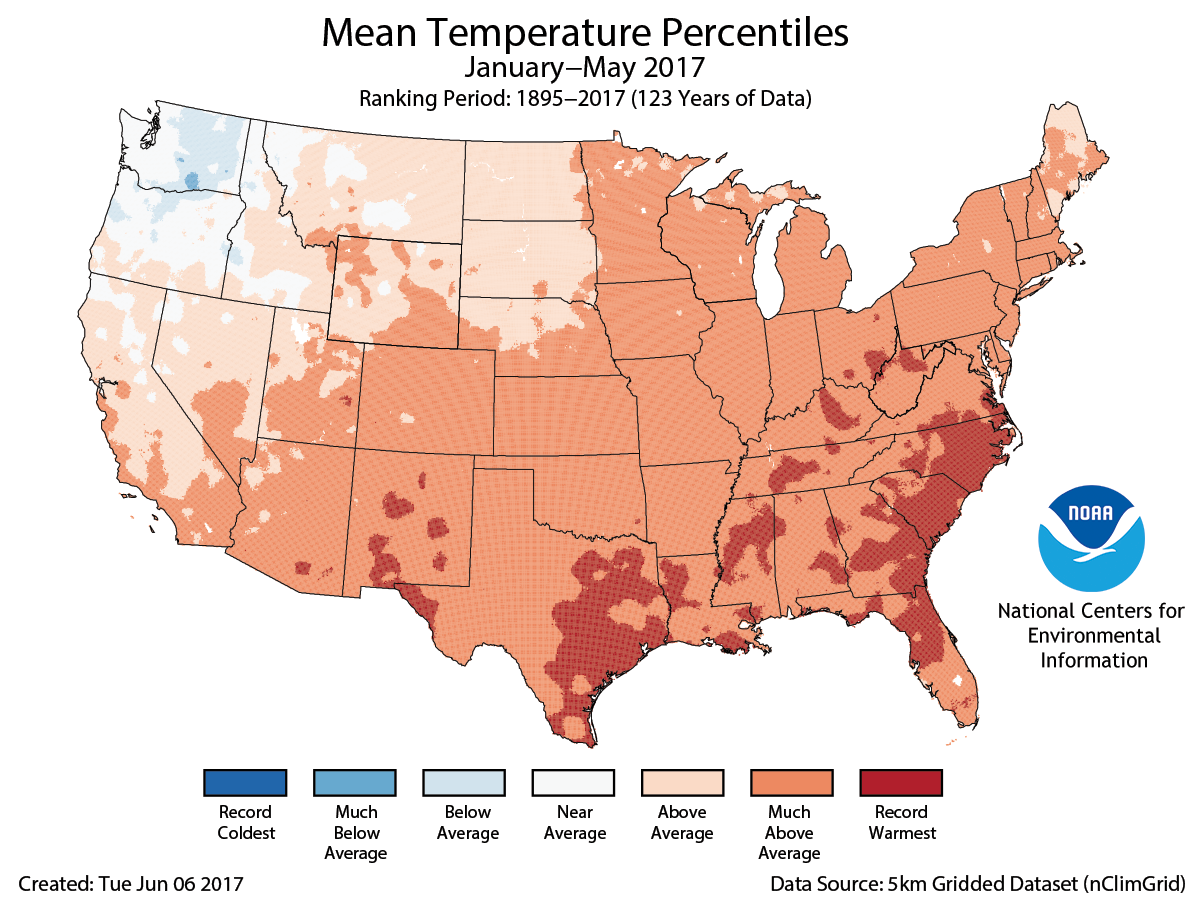
The year-to-date average temperature for the contiguous U.S. was 47.0°F, 3.7°F above the 20th century average. This ranked as the second warmest January–May on record for the contiguous U.S.—1.4°F cooler than the record set in 2012 and marginally warmer than the same period in 2000.
-
Above-average temperatures spanned the nation with only parts of the Northwest being colder than average. Forty states were much warmer than average during January–May with Florida, Georgia, North Carolina, South Carolina, and Texas record warm.
Year-to-Date Precipitation
-
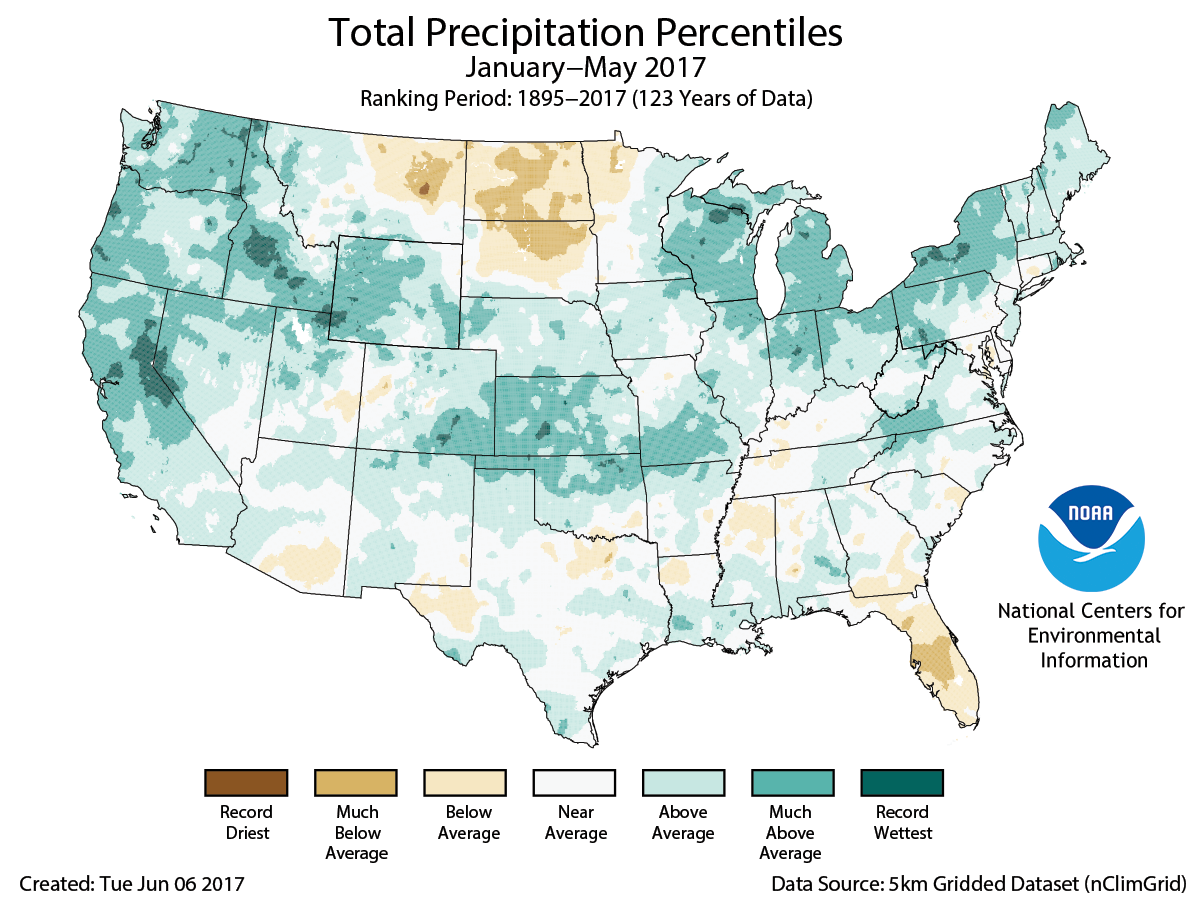
The year-to-date precipitation total for the contiguous U.S. was 14.85 inches, 2.46 inches above average and the third wettest January–May on record for the Lower 48. This was the wettest first five months of a year since 1998.
-
Above-average precipitation was widespread in the West, where six states had much-above-average precipitation due to early year rain and snow. Idaho had its wettest year-to-date on record. Two states in the Central Plains and five states in the Great Lakes and Northeast were much wetter than average. Below-average precipitation was observed in the Northern Plains and parts of the Southeast. North Dakota had its ninth driest January–May on record.
Year-to-Date Extremes
-
The USCEI for the year-to-date was more than double the average and the second highest value on record. On the national scale, extremes in warm maximum and minimum temperatures, one-day precipitation totals, days with precipitation, and the spatial extent of wetness were above average.
This month's U.S. State of the Climate report includes an update of NOAA's annual high tide flooding, or "nuisance flooding," monitoring and experimental predictions. The report found that, among most of the cities studied, flooding trends increased in 2016 by 130 percent on average since the mid-1990s and continue to accelerate. For a summary of the findings and access to the full report, visit the 2016 State of U.S. High Tide Flooding and a 2017 Outlook.

