
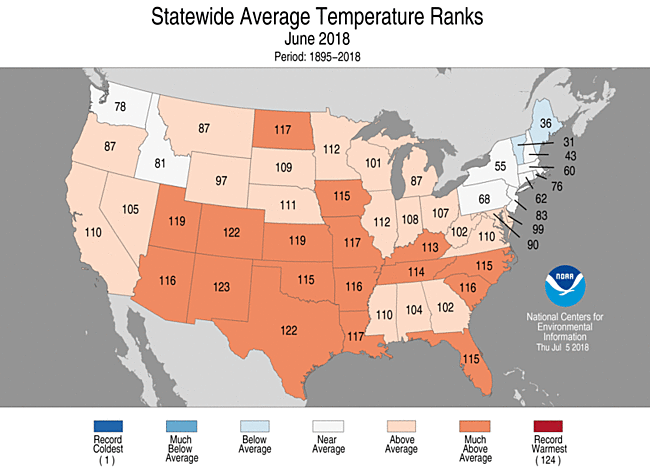
The contiguous United States had its third warmest June on record

The June contiguous U.S. temperature was 71.5°F, 3.0°F above the 20th century average. Only June 1933 and 2016 were warmer for the nation. Above-average temperatures spanned much of the Lower 48, with near- to below-average temperatures in the Northwest and Northeast. The first half of 2018 was marked by large month-to-month swings in temperature, but when averaged, the contiguous U.S. temperature was 49.4°F, 1.9°F above the 20th century average, and the 14th warmest January-June on record.
The June precipitation total for the contiguous U.S. was 3.08 inches, 0.15 inch above average, and ranked near the middle of the 124-year period of record. Much-above-average precipitation fell in parts of the Midwest, Northern to Central Plains and Mid-Atlantic with below-average precipitation across parts of the West and South. Several significant flash-flooding events impacted the U.S. during June. For the year-to-date, the precipitation total was 15.78 inches, 0.47 inch above average, and ranked near the middle of the 124-year period of record.

This monthly summary from NOAA’ s National Centers for Environmental Information is part of the suite of climate services NOAA provides to government, business, academia and the public to support informed decision-making.
June Temperature

-
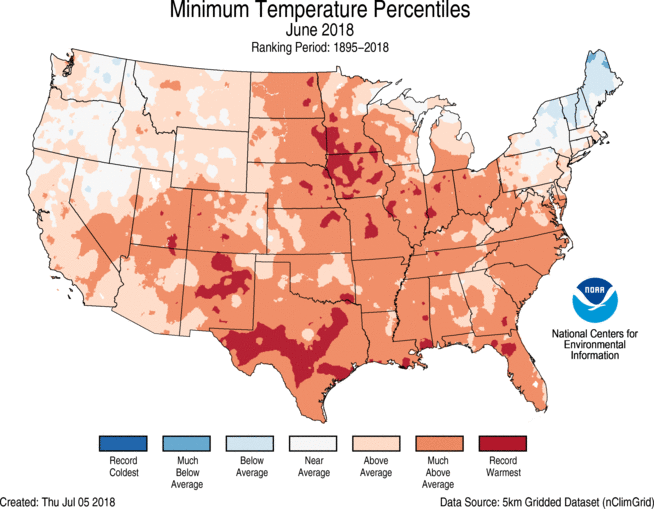
Above-average June temperatures were observed for much of the nation. Seventeen states across parts of the Southwest, Great Plains, Midwest and Southeast had a much-above-average temperature. Minimum temperatures, or overnight lows, were particularly warm across the central and southeastern U.S. Iowa, New Mexico and Texas each had a record warm June minimum temperature.
-
Near- to below-average June temperatures were observed across the Northwest and Northeast. In the Northeast, a heatwave that began in late June and persisted into early July was not enough to compensate for below-average temperatures in early- and mid-June.
June Precipitation

-
Above-average precipitation was observed in a string of states from the Northern Rockies and Plains, through the Midwest, and into the mid-Atlantic. Indiana, Iowa and Kentucky each had a June precipitation total that was much above average. During June, there were several noteworthy heavy precipitation events that caused significant regional flooding.
-
On June 15-17, heavy rainfall caused fatal flash flooding in the Upper Midwest, washing out highways, with record crests along some rivers. One of the hardest hit communities was Houghton County, Michigan, where nearly 7.0 inches of precipitation fell in a short period.
-
A slow moving low pressure system, with tropical origins, dropped record-setting rainfall along the southern Texas coast on June 18-21. A report of 11.00 inches or more of precipitation near Premont, Texas, was received by the National Weather Service. The rain gauge reached its capacity of 11.00 inches before overflowing. Widespread flooding was reported during the event.
-
On June 22, 7.61 inches of precipitation was observed in Richmond, Virginia, causing flash flooding, power outages and the closure of the Richmond International Airport. This was the second highest daily rainfall total for the city, with a period of record that dates to 1887. Of the total precipitation, 4.09 inches of rain fell in just one hour, a new hourly record for the airport.
-
-
Below-average precipitation was observed across parts of the West, South, Midwest, Southeast, and Northeast during June. Utah tied its sixth driest June on record, receiving just 0.07 inch of precipitation during the month, 0.66 inch below average. Some locations in the Southwest received zero precipitation during June, a frequent occurrence during this time of year.
-
According to the July 3 U.S. Drought Monitor report, 29.7 percent of the contiguous U.S. was in drought, up from 26.4 percent at the end of May. Drought conditions worsened in parts of the West, Southern Plains, the Mississippi River Valley and the Northeast. Numerous large wildfires impacted parts of the Rockies and Southwest during June, where months of warm and dry conditions contributed to an abundance of wildfire fuels. Drought conditions improved for parts of the Great Plains, Midwest and the Texas Gulf Coast. Abnormally dry conditions expanded in Hawaii and Puerto Rico.
Year-to-Date (January-June) Temperature

-
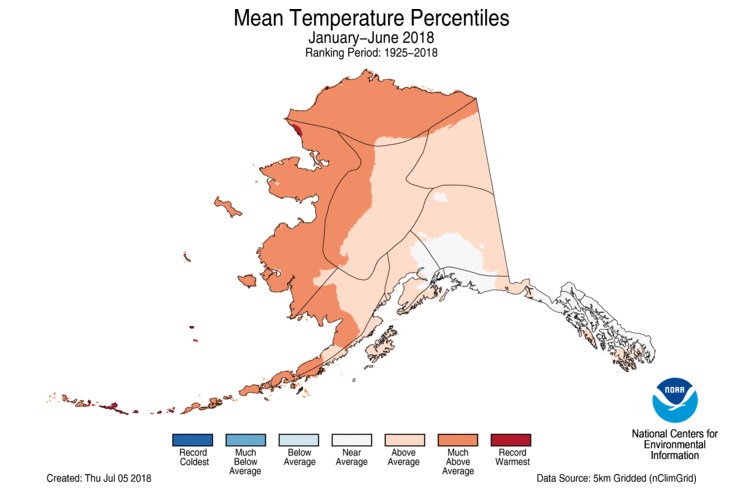
Above-average January-June temperatures were observed across the West, Southern Plains, East Coast and much of the Midwest. Eight states in the West and South had much-above-average year-to-date temperatures, including Arizona and New Mexico that were record warm. The Arizona statewide average temperature was 59.5°F, 4.3°F above average, and the New Mexico temperature was 53.4°F, 4.1°F above average. Near- to below-average temperatures were observed in the north-central contiguous U.S.
-
The Alaska statewide average temperature for the year-to-date was 25.6°F, 4.3°F above average, and tied 2005 as the 10th warmest on record. Above-average temperatures were observed across western and northern areas of the state, with near-average temperatures in southern Alaska.
Year-to-Date (January-June) Precipitation

-
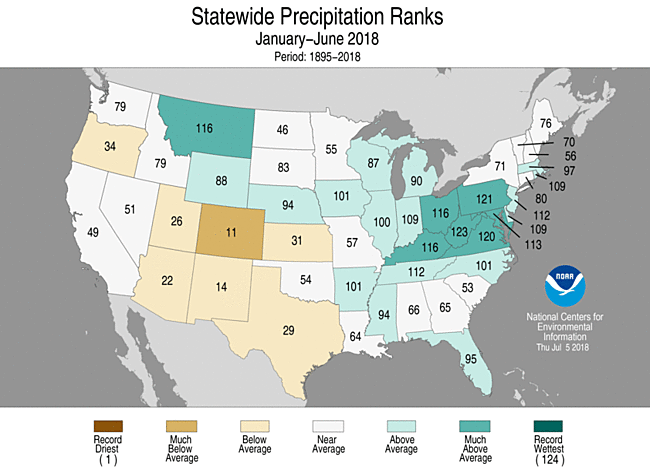
Above-average precipitation was observed in the Northern Plains, Midwest and along parts of the East Coast. Seven states had a January-June precipitation total that was much above average, with record precipitation observed for some localized areas.
-
Below-average precipitation was observed for locations across the Southwest, Southern Plains, Upper Midwest and Mid-Mississippi Valley. Colorado had its 11th driest year-to-date on record.
Billion-Dollar Weather and Climate Disasters

-
Through the end of June, there have been six weather and climate disaster events with losses exceeding $1 billion each across the U.S. during 2018. This was double the long-term average of three events for the January-June period since 1980, but slightly less than the 7.4 event average for the January-June period of the last five years. These events included four severe storm events and two winter storm events. Overall, these events resulted in the deaths of 36 people and had significant economic effects on the areas impacted.
-
Since these records began in 1980, the U.S. has sustained 233 weather and climate disasters where overall damages/costs reached or exceeded $1 billion (including CPI adjustment to 2018). The total cost of these 233 events exceeds $1.5 trillion.


