An engaging tsunami resource brings data alive
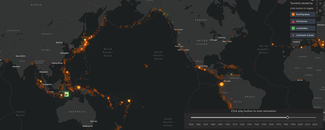
NCEI is a trusted source for the history of tsunami events worldwide with over 2,500 events since 1650 B.C. archived and stewarded. Finding detailed information, data, and images for tsunamis is possible with the Natural Hazards Database, Natural Hazards Image Database, and the Natural Hazards Viewer, and seeing the larger patterns and timing has just gotten easier. Our Tsunami Events (1850 to Present) Time-Lapse Animation tool shows events unfolding over time. To support educators integrating this interactive tool into classrooms, NCEI has developed a short guide for how to use it effectively.
Basic Use
To start exploring the Tsunami Events (1850 to Present) Time-Lapse Animation:
- Press play to see the animation move through over 170 years of tsunami data.
- Experiment by zooming anywhere on the map and filter tsunami causes by selecting the colored icons in the upper right corner.
- Use the slider to move to specific years; the legend indicates the number of deaths sorted by tsunami cause.
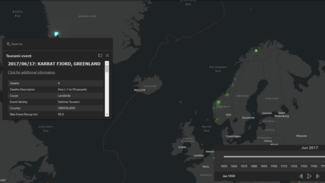
- Clicking on a tsunami event icon provides event details.
- Note: Historical tsunami data are complex, which can affect data reliability (e.g. misinterpretation of events, typographical errors, scarcity of information, etc.). As a result, an “Event Validity” level is assigned to each tsunami event to explain if doubts exist regarding the reliability and/or sufficiency of data.
Tsunami Events Teacher’s Guide
Navigating the animation tool is rewarding for all ages, and supporting exploration of the tool can help middle school and high school students understand key concepts in Earth Science curriculum. By allowing students to explore the Tsunami Events (1850 to Present) Time-Lapse Animation tool with the prompts of the printable Tsunami Worksheet, students will naturally develop an understanding of science concepts including the Next Generation Science Standards’ MS-ESS3-2 and HS-ESS3-1.
Educators can use the following details, tutorials, and resources to guide the discovery of their students. All bolded material can be found in the printable Tsunami Worksheet.
Using the month-by-month pan, find and summarize a tsunami that occurred on your birth month and year. If none occurred in that time period, then choose another month/year. What did you think was the most interesting detail about your event?
- Drag the icon on the timeline to the correct year.
- Pan through each month using the arrows.
- Tsunami source events pop up in white as they occur.
- Click the white icon for details about the tsunami.
Find the largest symbol (circle, triangle, square, or diamond) in the animation. What does the size of the icon mean?
- To see all tsunamis since 1850, move to the end of the timeline.
- Select a large icon for details.
- Compare the details with a smaller icon.
- The number of deaths is indicated by the size of the icon. A key in the upper right corner shows the approximate range. (Note: Sometimes the number of tsunami deaths cannot be separated from the source event, e.g. an earthquake.)
Does each icon represent the only areas affected by the identified tsunami?
- The icons in the time-lapse animation indicate only the source of the tsunami event, but tsunamis may have widespread impacts far beyond their source location.
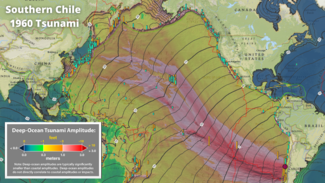
- For example, the May 22, 1960 tsunami that originated in Southern Chile from a 9.5 earthquake had devastating impacts across the Pacific Ocean region. This earthquake was the largest earthquake ever recorded, and the far-reaching impacts can be seen by using NCEI’s Hazards Viewer. You can read more about this event here.
Name three countries where tsunami source events occur frequently. How many of those countries are near a dark pink line? What do you think the dark pink line represents?
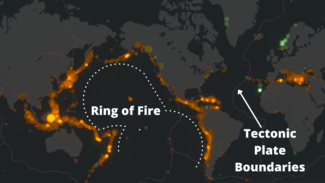
- The pink lines are the boundaries of the tectonic plates. The water displacement from the plates moving during earthquakes can cause tsunamis.
- The “Ring of Fire” along the tectonic plate boundaries circling the Pacific Ocean is an area characterized by active volcanoes and more frequent earthquakes and tsunamis.
What are the most frequent causes of tsunamis? Predict where the highest chance of landslide-caused tsunamis would be, and then look at where these events historically occurred.
- 81% of tsunamis occur because of earthquakes under large bodies of water, but 11% of tsunamis are caused by landslides either caused by earthquakes along rugged coastlines or in regions with glaciers.
- With a changing climate, the increasing temperatures result in glacial retreat and melting permafrost. This increases the frequency of tsunamis generated by subaerial landslide events.
Outside of the “Ring of Fire,” where else are volcanic eruptions occurring? Can a volcano be considered active even if it is not currently erupting?
- Indonesia, the Caribbean, and the Mediterranean are among the regions that have volcanic activity outside the “Ring of Fire.”
- The August 27, 1883, Krakatau eruption in Indonesia resulted in a series of tsunamis that destroyed 165 nearby coastal settlements in Indonesia. The waves traveled outside of the Indian Ocean, as far as Hawaii and South America’s Pacific coastline. Read more about the event here.
- Volcanoes are considered active if they have erupted in the last 10,000 years. An active volcano that has not erupted for some time, but could erupt again in the future, is labeled as dormant.
Tsunami Mitigation and Preparedness
As a natural phenomenon that has the potential to impact the lives and livelihoods of people around the world, developing tsunami mitigation strategies is imperative. Support the problem-solving skills of your students by exploring the following questions:
- How do you think people communicated the threat of tsunamis to a region before the internet or telephones?
- Brainstorm an invention for protecting communities from the impacts of tsunamis.
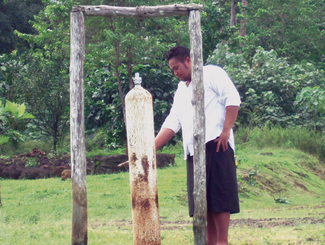
Thankfully, real-world solutions exist for protecting people from the impacts of tsunamis. In American Samoa and the country of Samoa, a “sa bell” is rung to announce events to the community, including the issuance of a tsunami warning.
Japan is frequently affected by tsunamis, and there are numerous inscribed rocks along the coasts marking where it is safe to build further inland. Some of these stones are centuries old and have stood the test of time.
More recently, NOAA’s Tsunami Warning Centers issue alerts to emergency managers, news outlets, and the public to quickly warn about the threat of tsunami impacts for a region. This can initiate sirens, text message alerts, or radio announcements depending on the region.
The National Weather Service also has the TsunamiReady Program, which is a voluntary community recognition program that promotes tsunami hazard preparedness in communities. These initiatives include public outreach programs such as the International Tsunami Information Center's flyers that share how to sense an approaching tsunami through the Feel, See, Hear, and Run campaign.
More Resources
Continue your exploration of tsunamis in the classroom with the NCEI Educator Toolkit on Historic Tsunamis. This resource combines hands-on activities to develop understanding of tectonic plate movements and additional resources to help bring NCEI’s natural hazards resources into the classroom.
For more background information on tsunamis, refer to the United Nations Educational, Scientific and Cultural Organizations’ Tsunami Glossary. This internationally accepted document defines the technical terms related to tsunamis alongside visual depictions of tsunami creation and their impacts.


