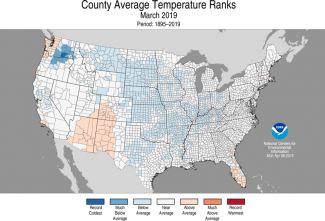
NCEI provides U.S. data, maps, and rankings for temperature, precipitation

County-level data, maps, and rankings of precipitation and temperature can be accessed online from NCEI. The county-level information responds to needs for high-quality climate information on a finer scale.
Accessing County Data
County information can be found on the National Temperature and Precipitations Maps web page and by using Climate at a Glance. Climate at a Glance was developed as a quick and easy source for climate information and initially provided near real-time analysis of monthly temperature and precipitation data across the contiguous United States. Also, Climate at a Glance was intended for the study of climate variability and change. Since its launch in the fall of 2000, users have been able to obtain data for select cities, divisions, states, regions, and the contiguous United States and compare current conditions with the historical record.
County data, available since November 2018, provide a more localized picture of weather and climate conditions. The county-level data are generated from a dataset known as nClimGrid, which is based on the GHCN dataset and is the foundational dataset for studying the climate across larger geographic areas. Previously, the smallest aggregated scale of nClimGrid consisted of nClimDiv, which is the climate division dataset, consisting of 344 specified divisions across the contiguous United States. Counties are typically smaller than divisions, which makes them ideal for smaller-scale analyses. Currently, there are 3,107 counties or county-equivalents across the contiguous United States.
County data analyses currently consist of maps and time series graphs of average temperature, maximum and minimum temperature, and precipitation. For those parameters, the public can access maps of counties by state for months, years, and seasons as well as rankings and graphs. County data are available from 1895 through the present and can be accessed directly through FTP.
Uses of County Data
County-level data can provide specific information that is useful for drought managers, university researchers, agriculture producers, and business leaders. For instance, a nationwide company has used county-level temperature and precipitation data to analyze the sales performance of dairy products to better explain and predict future sales. County data can also be useful for Regional Climate Centers, which cater to localized needs for six climate regions across the contiguous United States.
Within NCEI, county-level data provide an additional resource to assist in monitoring the state of the climate. County maps have also been added to the monthly National Climate Report. NCEI regularly receives a variety requests from industries and users around the country for which the finer-scale climate data are helpful. For information about county-level data, contact ncei.info@noaa.gov.


