
The Global Historical Climatology Network daily (GHCNd) is an integrated database of daily climate summaries from land surface stations across the globe. GHCNd is made up of daily climate records from numerous sources that have been integrated and subjected to a common suite of quality assurance reviews.
GHCNd contains records from more than 100,000 stations in 180 countries and territories. NCEI provides numerous daily variables, including maximum and minimum temperature, total daily precipitation, snowfall, and snow depth. About half the stations only report precipitation. Both record length and period of record vary by station and cover intervals ranging from less than a year to more than 175 years.
Available Data
Daily data from GHCN are available as individual ASCII (i.e., plain text) files (one file per station) and as a GZIP-compressed TAR file containing all of the station files. Please read the GHCNd readme file for details on the files available and for a description of the data format.
Access Methods
To determine off-line availability of any country's data, please contact NCEI at ncei.orders@noaa.gov or 828-271-4800.
Metadata-Inventories
- Stations: Station ID, latitude, longitude, elevation, State (if applicable), and Station name
- Inventory: Station ID, latitude, longitude, element type, and begin/end date
- Documentation: Data format, element definitions, and Station variables
- Country Codes: List of country codes used in the Station inventory
Updates
GHCNd receives daily updates from a variety of data streams, which also go through a suite of quality checks. Additionally, the dataset is reconstructed each weekend from more than 25 data source components to ensure that GHCNd is generally in sync with its growing list of constituent sources. During this process, the system applies quality assurance checks to the full dataset.
Each daily update to GHCNd is assigned a unique version number, and then archived at NCEI. GHCNd also serves as the official archive for the U.S. Cooperative Observer data, which have been comprehensively integrated into the dataset with other U.S. daily data sources.
Users are encouraged to see further notes on the Source Data section below regarding real-time versus time-delayed, archive quality updates. Generally, real-time replacement of updated data streams are replaced by archive-ready data sources 45 to 60 days after the end of a month.
Major changes to the processing system, as well as announcements of significant data additions to GHCNd are provided via an RSS feed and in the GHCNd status reports. Information on the dataset format, metadata, and definitions of the data quality, management, and source flags that accompany each datum is provided in this readme file.
Source Data Descriptions
NCEI recieves GHCN-D source data from National Meteorological and Hydrological Centers (NMHCs) around the world, through official bi-lateral agreements, and from a number of data archives at NCEI. These sources fall into four broad categories:
- US Collection
- International Collection
- Government Exchange Data
- Global Summary of the Day
Note: the source for each datum is indicated by a source flag as described in the readme.txt file.
U.S. Collection
The U.S. Collection contains daily data from a dozen separate datasets archived at NCEI. These archives provide some of the earliest observations available for the United States (from the U.S. Forts and Voluntary Observer Program covering much of the 19th century) to the latest measurements from state-of-the-art climate monitoring stations that make up the U.S. Climate Reference Network. GHCNd contains the most complete collection of U.S. daily climate summaries available.
Active U.S. stations in GHCNd have updates both via real-time data feeds and via time-delay, archive-quality data feeds. U.S. data users formerly accustomed to receiving “final” archived data (e.g. for DSI-3200) should confirm a real-time data source for a particular station/day has been replaced by an archive-quality data source. Real-time data sources include the High Plains Regional Climate Center data feed (source flag=”H”) and real-time Automated Surface Observing System (ASOS) summaries (source flag=”A”), which are subject to change upon receipt of archive-quality sources. Archive-ready data sources are normally available 45-60 days following the close of a data month and include DSI-3207 (WxCoder3 data; source flag=”7”).
GHCNd is continually reprocessed. Because receipt of changes/additions occurs even for archive-quality data sources, a data value and/or quality flag is subject to change even after all archive quality sources are integrated. However, changes to U.S. data values are rare 60 days after the close of a particular data month.
International Collection
The International Collection contains historical records for approximately 20,000 locations outside the U.S. from more than 100 different countries and largely reflects the data collection efforts that led to the release of Global Daily Climatology Network dataset (the predecessor to GHCNd). The summaries from some countries in this collection are historical and are not updated on a regular basis. As an example, precipitation records ended generally in the late 1990s for Brazil and South Africa, and in 1970 for India.
Government Exchange Data
Government Exchange Data refers to data collected through official Global Climate Observing Systems (GCOS) and bilateral agreements. In the best case scenario, an NMHC may offer its complete digital daily climate database for inclusion in GHCNd, which is the case for Canada (with more than 7500 station records provided) and Australia (with more than 17,000 station records). In other cases, NMHCs have provided daily data only for the GCOS Surface Network stations under their jurisdiction, resulting in data from only a few stations. However, new historical contributions are periodically added to this collection.
Global Summary of the Day
The Global Summary of the Day contains 24-hour summaries encoded in the special “climatological code” group transmitted with synoptic (SYNOP) reports on the Global Telecommunications System (GTS). NCEI archives these reports in the Integrated Surface Dataset (ISD; DSI-3505) and the 24-hour summary period generally ends at midnight UTC (i.e., 2400 UTC). Daily maximum and minimum temperatures from this source are included in GHCNd only when provided as a nominal 24-hour climatological summary as indicated in the SYNOP messages, whereas daily precipitation totals are also included when they must be summed from two 12-hour or four 6-hour sub-totals (as provided in standard SYNOP code groups). Identification of sub-daily summations is indicated by the associated “measurement” flag codes for each datum. Daily summaries from the Global Summary of the Day may differ significantly from climate summaries with 24-hour periods ending at local midnight, particularly in the case of precipitation. Nevertheless, data from this GTS source are available for a number of locations that are not contained in any other data source available to NCEI, and they provide the only source of updates for many stations.
Coverage
Of the more than 100,000 stations that comprise GHCNd, approximately 20,000 updates with observations are during any given 30-day period.. While many sites report only precipitation, daily maximum and minimum temperatures are also available from more than 25,000 sites, and many stations in North America also report snowfall and snow depth. Snow depth observations for stations outside of the United States originate from the synoptic reports in the Global Summary of the Day dataset.
The interval covered by GHCNd station records varies from less than one year to more than 175 years, with the average record length spans more than four decades. Currently, the earliest observation in the dataset is a daily precipitation total recorded on January 1,17321832 at Parramatta, Australia (GHCNd ID = ASN00066046; total = 0.0 mm). The earliest maximum and minimum temperature measurements are from January 2, 1833 at Uccle, Belgium (GHCNd ID = BE000006447; maximum temperature = -1.4°C and minimum temperature = -4.8°C). Uccle, a GCOS Surface Network station, is still active and provides the longest daily station record in the dataset.
The Table contains maps indicating the density of stations that have at least 10 years of precipitation or temperature records during successive 30-year intervals starting in 1861.
| Years | Temperature | Precipitation |
|---|---|---|
| 1861: 1890 | 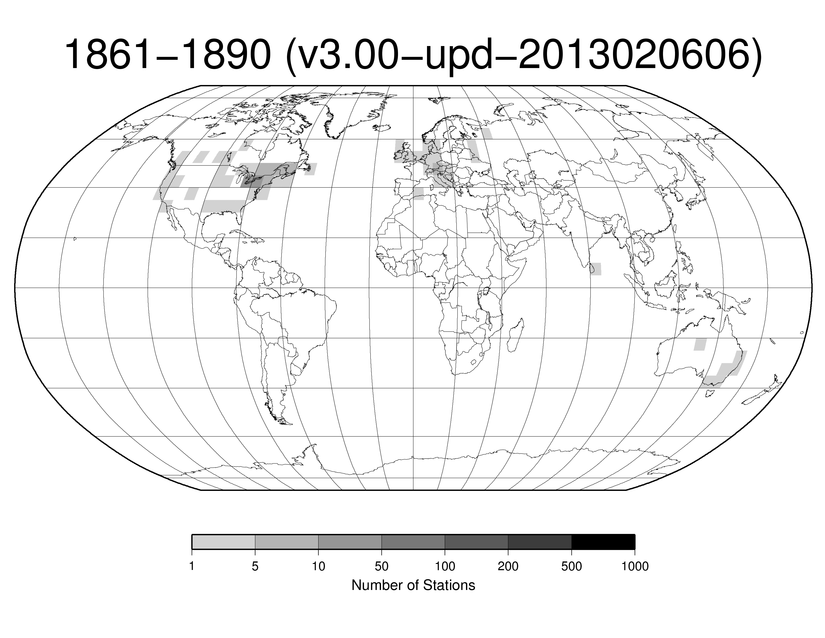 | 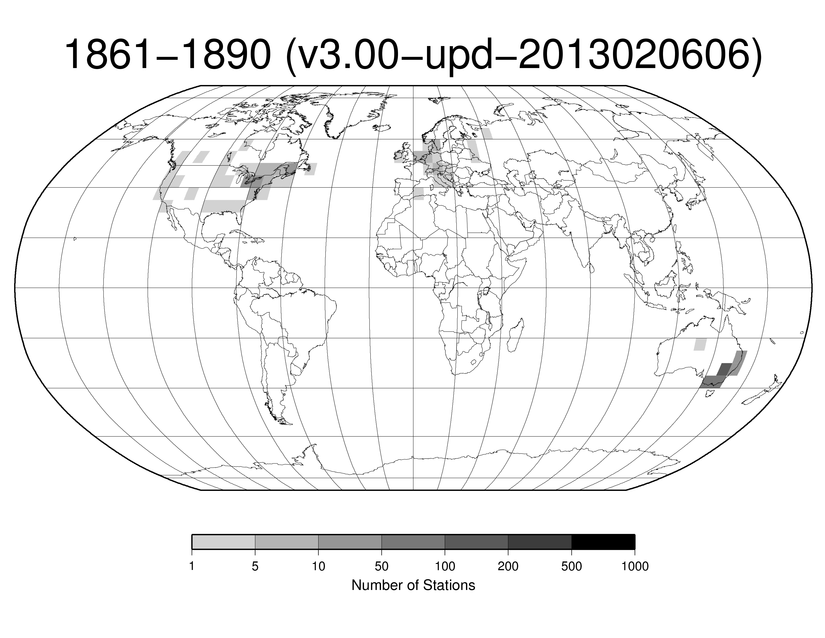 |
| 1891: 1920 |  | 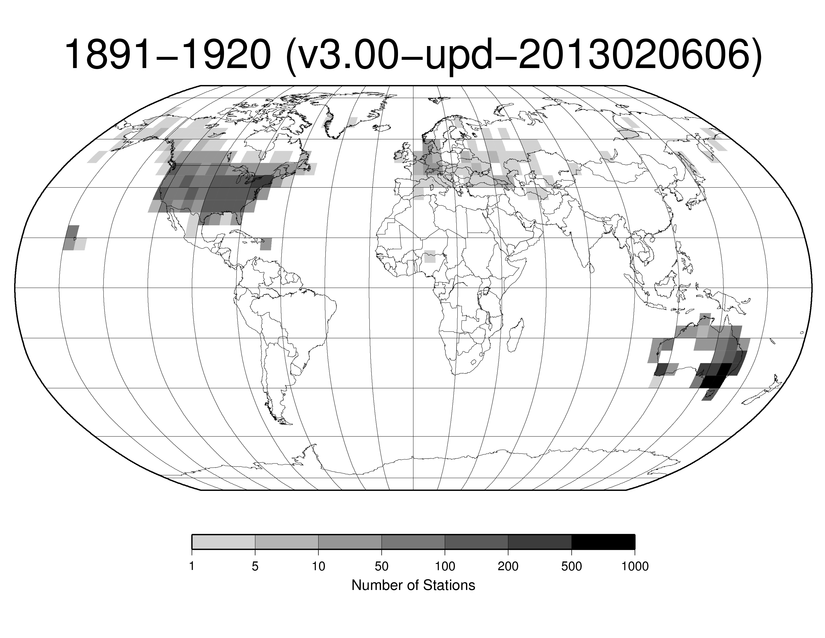 |
| 1921: 1950 | 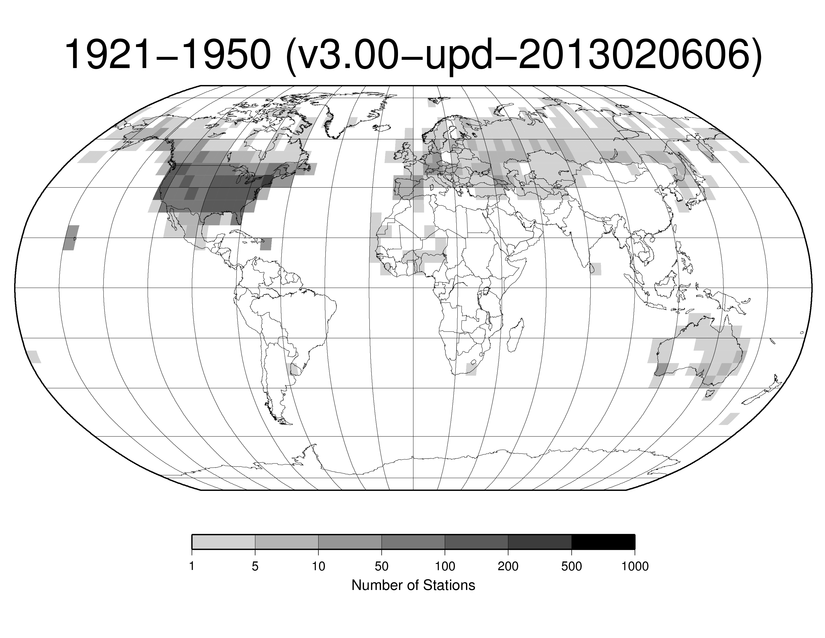 |  |
| 1951: 1980 | 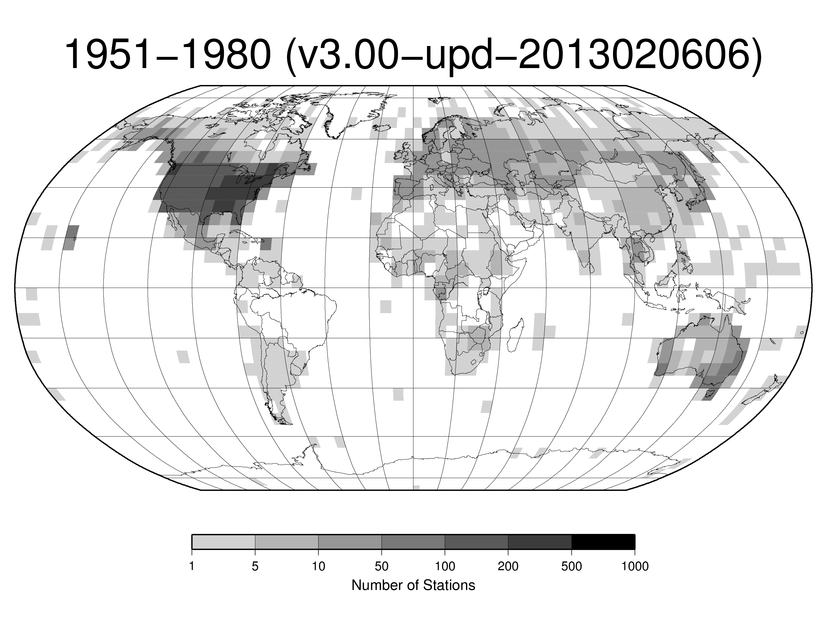 | 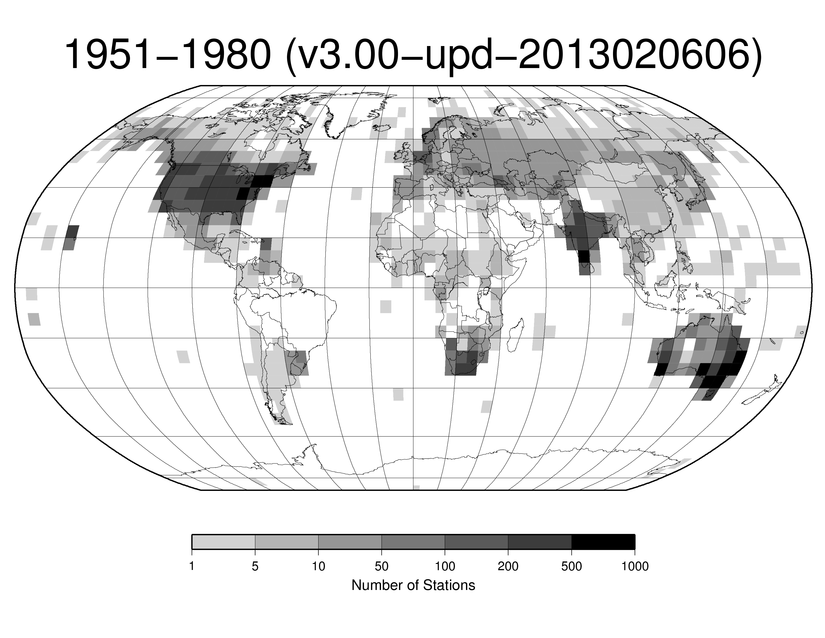 |
| 1981: 2010 | 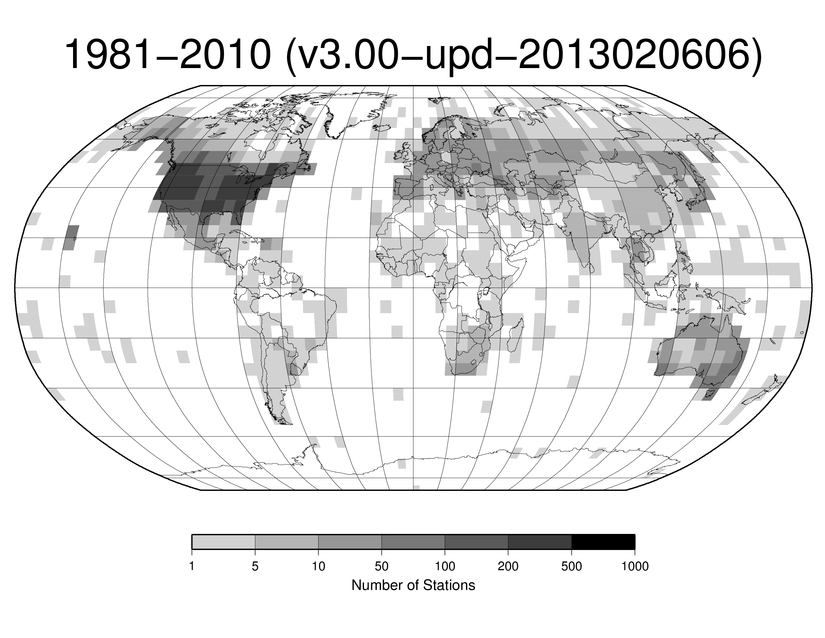 | 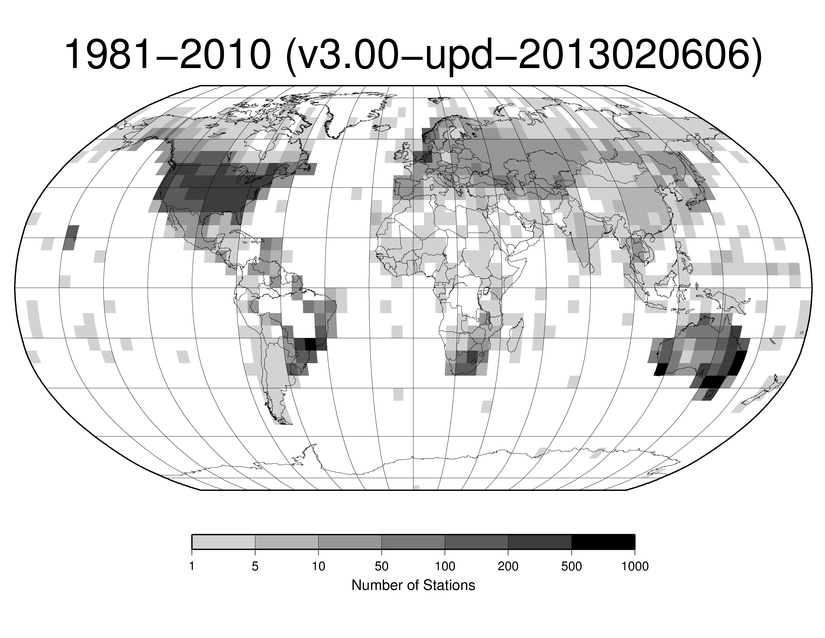 |
Like GHCNm, the concentration of stations with observations of temperature or precipitation in GHCNd is denser over North America and Eurasia than in Africa, Antarctica, and South America. However, the densest historical station networks in GHCNd come from the U.S., Canada, and Australia, which is a reflection of the comprehensive contributions from these countries. Nevertheless, Brazil, India, and South Africa have also contributed records from very dense national precipitation networks.
The temporal evolution of the station network is such that daily summaries are available from a relatively small number of stations before 1890 when the number of stations reporting maximum and minimum temperatures (precipitation) was about 2.5% (8.9%) of the peak number. The total number, spatial distribution, and temporal completeness generally increase through time for all variables, although both the temperature and precipitation networks attained their maximum density in the 1960s. For the periods of record of individual stations and elements, see the GHCNd inventory.
Data Integration
The process of integrating data from multiple sources into GHCNd takes place in three steps:
- Screening the source data for stations whose identity is unknown or questionable
- Classifying each station in a source dataset either as one that is already represented in GHCN-D or as a new site
- Mingling the data from the different sources
The process performs the first two of these steps whenever a new source dataset or additional stations become available, while the mingling of data is part of the automated processing that creates GHCNd on a regular basis.
Screening the Source Data
A station within a source dataset is considered for inclusion in GHCNd if it meets all of the following conditions:
- It can be identified with a name, latitude, and longitude contained in metadata provided as part of the source dataset or in standard station history information
- Its record contains 100 or more values for at least one of the GHCNd elements
- It does not fail the interstation duplicate check that compares records from all stations within a source dataset in order to identify cases in which more than 50% of a station's record is identical to the data from another station
Classifying Stations
The next step is to determine for each station in the source dataset if data for the same location are already contained in GHCNd, or if the station represents a new site. Whenever possible, stations are matched on the basis of network affiliation and station identification number. If no match exists, then there is consultation from different networks for existing cross-referenced lists that identify the correspondence of station identification numbers.
For example, data for Alabaster Shelby County Airport, Alabama, USA, is stored under Cooperative station ID 010116 in NCEI's datasets 3200 and 3206 as well as in the data stream from the High Plains Regional Climate Center; they are combined into one GHCNd record based on the ID. In data set 3210 and the various sources for ASOS stations, however, the data for this location are stored under WBAN ID 53864 and must be matched with the corresponding Cooperative station ID using NCEI's Master Station History Record.
A third approach is to match stations on the basis of their names and location. This strategy is more difficult to automate than the other two approaches because identification of multiple stations within the same city or town, with the same name and small differences in coordinates, can be the result of either differences in accuracy or the existence of multiple stations in close proximity to each other. As a result, the employment of the third approach is used only when stations cannot be matched on the basis of station identification numbers or cross-reference information. This is the case, for example, when there is a need for matching stations outside the U.S. whose data originate from the Global Summary of the Day dataset and from the International Collection.
Mingling
The implementation of the above classification strategies yields a list of GHCNd stations and an inventory of the source datasets for integration of each station. This list forms the basis for integrating, or mingling, the data from the various sources to create GHCNd. Mingling takes place according to a hierarchy of data sources and in a manner that attempts to maximize the amount of data included while also minimizing the degree to which data from sources with different characteristics are mixed. While the mingling of precipitation, snowfall, and snow depth are separate, consideration of maximum and minimum temperatures is performed together in order to ensure the temperatures for a particular station and day always originate from the same source. Data from the Global Summary of the Day dataset are used only if no observations are available from any other source for that station, month, and element. Among the other sources, consideration of each day is made individually; if an observation for a particular station and day is available from more than one source, GHCNd uses the observation from the most preferred source available.
Several criteria are used for the hierarchy of data sources used in cases of overlap. In general before integration into GHCNd, the higher priority sources are those that have received the greatest amount of scrutiny versus those from fully automated, real-time data streams. At station networks within the U.S., sources providing Cooperative Summary of the Day data are given preference to other data streams since they contribute the largest amount of data. For international stations, the official Governmental Exchange Data is preferred to the International Collection when observations from these two sources are present on the same day. Lastly, there may be comparisons of a new source of data for a particular station to station data already contained in GHCNd. If data from the new source match data for a station already added to GHCNd during their common overlap period, and the match rate is at least 50% for all elements, and the new station and the existing GHCNd station are within 40 km of one another (based on their respective coordinates), then the new station data is added as an additional source to the existing GHCNd station record.
Quality Control
During each reprocessing cycle, the data are first passed through a "format checking program" that looks for such problems as impossible months or days, invalid characters in data fields, etc. If this occurs, then the routine sets the offending records to missing. The primary purpose of this program is to ensure that the data integration procedures do not either introduce or retain records that violate the intended and documented GHCNd data format. Next, a comprehensive sequence of fully-automated quality assurance (QA) procedures identifies daily values that violate one of the quality tests. Durre et al. (2010) describes these tests in detail. This system flags approximately 0.3% of nearly 2 billion data values. It is estimated that 98-99% of the values flagged are true data errors and only 1-2% are false positives (Durre et al. 2010). Achievement of this level of performance is through careful selection and evaluation of procedures and test thresholds using the techniques described by Durre et al. (2008). The tests are as follows (see the readme file for a list of the flags assigned when a particular test fails):
-
Trace flag consistency check:
-
Checks for days on which the data measurement flag indicates a trace yet the amount is nonzero. This flag applies to precipitation, snowfall, snow depth, evaporation, water equivalent of snow on the ground, and wind movement.
-
Naught check:
-
Checks for days on which maximum and minimum temperature are both equal to 0°C at stations not operated by the U.S. or are both equal to -17.8°C (0°F) at U.S. stations.
-
Duplicate data check:
-
Checks for duplication of the data between entire years, different years in the same calendar month, and different months within the same year. This check applies to air, evaporation pan, and soil temperatures, precipitation and snowfall.
-
World record exceedance check:
-
Identifies values that fall outside the world extremes for the highest and lowest ever observed. This check applies to all elements except weather types.
-
Streak check:
-
Checks for unrealistic sequences of identical values in time series of nonmissing values (or in non-missing/non-zero values in the case of precipitation). Flags sequences of
- 20 or more consecutive identical values in time series of non-missing daily maximum, minimum, and observation time air temperature;
- 20 or more consecutive identical values in time series of non-missing and non-zero precipitation observations;
- 10 or more consecutive identical non-zero values in time series of non-missing snowfall totals;
- 90 or more consecutive identical non-zero values in time series of non-missing snow depth values.
-
Frequent-value check (precipitation only):
-
Checks for clusters of 5-9 identical moderate to heavy daily totals in time series of non-zero precipitation observations.
-
Gap check:
-
Identifies unrealistic breaks in the period-of-record distribution of elements for a particular calendar month. Flags:
- Maximum/minimum air, evaporation pan, or soil temperatures that are at least 10°C warmer or colder than all other corresponding maximum/minimum temperatures for a given station and calendar month
- Precipitation values that are at least 300 mm larger than all other precipitation totals for a given station and calendar month
- Snow depth values that are at least 35 cm larger than all other reported snow depths for a given station and calendar month
-
Z-score-based climatological outlier check:
-
Checks for daily surface air maximum and minimum temperatures that exceed the respective 15-day climatological means by at least six standard deviations.
-
Percentile-based climatological outlier check:
-
Checks for daily precipitation totals that exceed the respective 29-day climatological 95th percentiles by at least a certain factor (9 when the day's mean temperature is above freezing, 5 when it is below freezing).
-
Internal temperature consistency check:
-
Checks for consistency among maximum, minimum, and time of observation temperature within a three-day window. This check applies to air, evaporation pan, and soil temperatures.
-
Temporal consistency check (spike or dip):
-
Checks if a daily maximum (minimum) temperature exceeds the maximum (minimum) temperatures on the preceding and following days by more than 25°C.
-
Lagged temperature range check:
-
Identifies maximum temperatures that are at least 40°C warmer than the minimum temperatures on the preceding, current, and following days, as well as minimum temperatures that are at least 40°C colder than the maximum temperatures within the same three-day window.
-
Consistency check between evaporation pan temperatures and surface air temperatures (flags pan temperature only):
-
Checks for inconsistencies between:
- Maximum surface air temperature and minimum evaporation pan temperature;
- Maximum evaporation pan temperature and minimum surface air temperature;
- Maximum evaporation pan temperature and maximum surface air temperature plus 10°C
- Minimum evaporation pan temperature and minimum surface air temperature minus 10°C.
-
Snow-temperature consistency (warm) check:
-
Checks for non-zero snowfall totals that occur when daily minimum temperatures at the same station are equal to or warmer than 7°C
-
Snowfall to snow depth increase consistency check:
-
Checks for days on which the increase in snow depth from the previous day to the current day exceeds the current+previous and current+following days' snowfall total by more than 25 mm.
-
Snowfall (or snow depth increase) to precipitation ratio check:
-
Checks for cases in which snowfall (or snow depth increase) is excessively large compared to precipitation. If so, the current day's precipitation and snowfall (or snow depth increase) totals fail the check on the preceding, current, and following days.
-
Spatial consistency check (regression):
-
Checks for temperatures that differ greatly from a predicted value generated from a linear-regression-based estimate generated from neighboring values. Flagging of a target temperature is when the regression-based predicted value differs by more than 8°C from the observed value, and the standardized residual of the predicted value exceeds four standard deviations on the target day.
-
Spatial consistency check (corroboration of anomalies):
-
Checks for temperatures that anomalies differ by more than 10°C from the anomalies at neighboring stations on the preceding, current, and following days.
-
Spatial consistency check (corroboration of precipitation amounts and percentiles):
-
Checks for precipitation totals that differ significantly from totals (and percentiles) reported at neighboring stations on the preceding, current, and following days.
-
Spatial consistency check (snow to minimum temperatures):
-
Checks for snowfall or snow depth increases when all neighboring stations reported a minimum temperature greater than 7°C on the preceding, current, and following days.
-
Mega consistency check:
-
Flags:
- daily maximum surface air temperatures that are less than the lowest minimum surface air temperature for the respective station and calendar month;
- daily minimum temperatures that are greater than the highest maximum temperature for the station and calendar month;
- observation-time temperatures that are higher than the highest maximum temperature or lower than the lowest minimum temperature for the station and calendar month;
- daily maximum evaporation pan temperatures that are less than the lowest minimum evaporation pan temperature for the respective station and calendar month, less than the lowest minimum surface air temperature for the respective station and calendar month, or more than 10°C above the highest surface air temperature for the respective station and calendar month;
- daily maximum evaporation pan temperatures that are less than the lowest minimum temperature for the respective station and calendar month;
- daily minimum evaporation pan temperatures that are greater than the highest maximum evaporation pan temperature, greater than the highest maximum surface air temperature, or 10°C below the lowest minimum surface air temperature for the station and calendar month;
- daily maximum soil temperatures that are less than the lowest minimum soil temperature for the station, calendar month, ground cover, and depth;
- daily minimum soil temperatures that are greater than the highest maximum soil temperature for the station, calendar month, ground cover, and depth;
- flags non-zero snowfall and snow depth values for stations in calendar months whose lowest reported minimum temperature is 7°C or warmer. The check is applied only if there are at least 140 daily minimum temperatures for the station and calendar month;
- warm season non-zero snowfall totals at stations where no valid cold season snowfall was ever reported;
- warm season non-zero snow depths at stations where no valid cold season snow depth was ever reported. (The definition of warm season is May-September in the Northern Hemisphere and October-April in the Southern Hemisphere. The remaining months of the year are the cold season).
-
Date-based climatological outlier check for snowfall and snow depth:
-
Flags snowfall and snow depth values that fall outside their respective plausible seasons as determined from observations at the station and neighboring stations within 1° latitude of the station. The design of this check is to remove non-zero observations in locations/seasons where snow is not plausible but not flagged by any other check. Note this check has a higher false positive rate (50% for snowfall and 75% for snow depth) than the GHCN-D standard of less than 20%. The intent is to improve this check in the future.
Bias Adjustment
Unlike GHCNm , GHCNd does not contain adjustments for biases resulting from historical changes in instrumentation and observing practices. It should be noted that historically (and in general), the deployed stations providing daily summaries for the dataset were not designed to meet all of the desired standards for climate monitoring. Rather, the deployment of the stations was to meet the demands of agriculture, hydrology, weather forecasting, aviation, etc. Because GHCNd has not been homogenized to account for artifacts associated with the various eras in reporting practice at any particular station (i.e., for changes in systematic bias), users should consider whether or not the potential for changes in systematic bias might be important to their application. In addition, GHCNd and GHCNm are not internally consistent (i.e., GHCNm is not necessarily derived from the data in GHCNd) until the release of GHCNm version 4.
Journal Articles
- Menne, M.J., I. Durre, R.S. Vose, B.E. Gleason, and T.G. Houston, 2012: An overview of the Global Historical Climatology Network-Daily Database. Journal of Atmospheric and Oceanic Technology, 29, 897-910, doi.10.1175/JTECH-D-11-00103.1.
- Durre I., M. J. B.E. Gleason, T. G. Houston, and R. S. Vose, 2010: Comprehensive automated quality assurance of daily surface observations. Journal of Applied Meteorology and Climatology., 49, 1615-1633, doi.10.1175/2010JAMC2375.1.
- Durre, I., M.J. Menne, and R.S. Vose, 2008: Strategies for evaluating quality assurance procedures. Journal of Applied Meteorology and Climatology, 47, 1785–1791, doi: 10.1175/2007JAMC1706.1.
Related Projects
-
GHCN-D served as the initial baseline for world records collected by the World Meteorological Organization's Rapporteur on Climate Extremes as part of an effort to create an archive for verifying, certifying, and storing weather extremes.
Contact
For technical questions regarding GHCNd data, please contact ncdc.ghcnd@noaa.gov. To determine off-line availability of any country's data, please contact NCEI at ncei.orders@noaa.gov or 828-271-4800.


