 |
U.S. Drought |

 National Drought Overview
| The year began
drier than average across a broad swath of the country from the
Southwest to the Great Plains, across much of the Gulf
Coast, and into the coastal Southeast. Above average
precipitation continued to erode the drought areas in the
Pacific Northwest. This pattern continued throughout the spring and
into the summer. By
fall,
drought was concentrated in the Plains, especially in Texas and
Oklahoma. By the end of the
year, drought subsided in much of the Southeast, but was
prominent across parts of the Plains. The U.S. Drought
Monitor depicts conditions at the end of the year. Several short-lived dry episodes occurred in other regions throughout the year, notably in the mid-Atlantic in February and March, the Northeast coast in March, the Pacific Northwest in July and August, and Florida for much of the year. The percent area* of the contiguous U.S. experiencing moderate to extreme drought grew steadily from 20 percent in January to a peak of about 52 percent by July, then declined during the second half of the year. |
  |
*This drought statistic is based on the Palmer Drought Index, a widely used measure of drought. The Palmer Drought Index uses numerical values derived from weather and climate data to classify moisture conditions throughout the contiguous United States and includes drought categories on a scale from mild to moderate, severe and extreme. |
| The most extensive national drought coverage during the past 100 years (the period of widespread reliable instrumental records) occurred in July 1934 when 80 percent of the contiguous U.S. was in moderate to extreme drought. Although the current drought and others of the 20th century have been widespread and of lengthy duration, tree ring records indicate that the severity of these droughts was likely surpassed by other droughts including that of the 1570s and 1580s over much of the western U.S. and northern Mexico. |
Regional Drought Overview
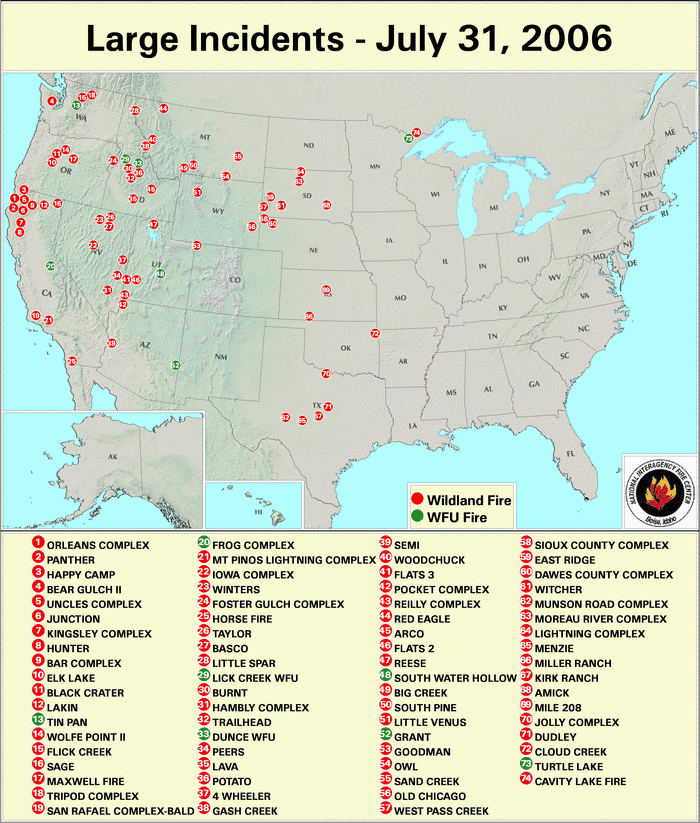
| Impacts from this year's drought were felt especially hard by the agricultural and hydrological communities. Low streams, reservoirs, and stock ponds and depleted soil moisture ravaged pastures and rangeland throughout the Plains, and numerous wildfires prompted governors and the USDA to declare drought disasters in parts or all of several states in the middle of the country. The South Platte River was nearly dry during the summer, low water levels in the Mississippi and Missouri Rivers forced an early end to barge transportation, several municipalities imposed water use restrictions, livestock was prematurely sold, crops died before harvest. In many areas, such as in South Dakota and Nebraska, recovery of grazing lands from drought is not expected for at least two years. |  |
| The long drought in the Southwest was alleviated by monsoon precipitation, but hydrologic effects (such as low reservoir levels) persisted through the end of the year. |
 |
| In the Southeast summer drought impacted agriculture and water supplies. The pecan crop was small, but of higher quality, corn and soybean yields dropped by about 10 percent from 2005, shallow rooted ornamental trees such as dogwoods suffered, forage decreased, hydropower production was reduced, and water use restrictions were imposed. By the end of the year, Florida had experienced the second driest December-November in the 111-year record. |  |
 |
 |
| The western Great Lakes region experienced low grass seed production because of drought and high temperatures, dying fish in the Minnesota lakes, decreased forage production, dying of Christmas tree saplings and wildfire hazards. Minnesota had the fifth driest May-July in the 112-year record. A positive impact of the drought was increased business by repair facilities caused by boats that sustained damage while in lakes with low water levels. |  |
 |
 |
| The year ended with back-to-back major winter storms across the Great Plains. Heavy December snow and rain brought drought relief to the central High Plains and adjacent Colorado Rockies. Dry conditions prevailed during the month across the central Appalachians and parts of the Southwest. By the end of the year, mountain snowpack was below normal across much of the Southwest and central Rockies. |  |
Pre-instrumental Drought Perspective
| Tree ring records
provide a useful paleoclimatic index that extends our historical
perspective of droughts centuries beyond the approximately 100-year
instrumental record. Several paleoclimatic studies have shown that
droughts as severe or worse, both in magnitude and duration, than
the major 20th century droughts have occurred in the U.S. during
the last thousand years. The following paleodrought reports have
been prepared by the NOAA/NCDC Paleoclimatology
and Climate
Monitoring branches during 2006: |