Issued 12 January 2023
Please note that the values presented in this report are based on preliminary data. They will change when the final data are processed, but will not be replaced on these pages.
National Drought Overview
(Very warm and very wet are defined as temperatures or precipitation in the upper tenth percentile of the historical record. Very cold and very dry are defined as temperatures or precipitation in the lowest tenth percentile of the historical record.)
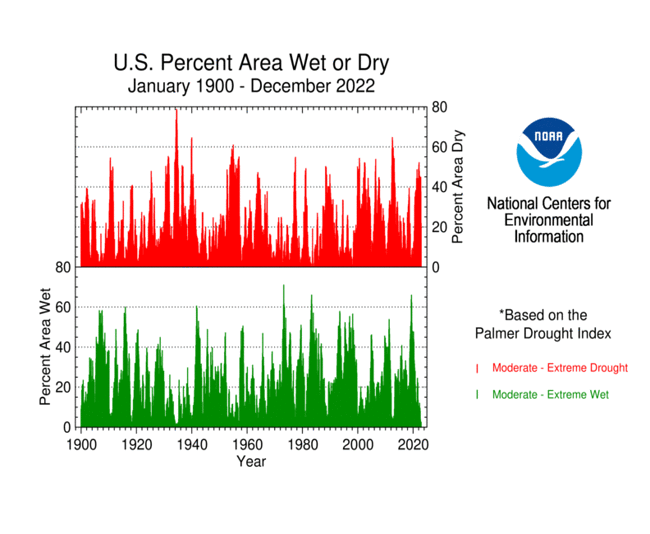
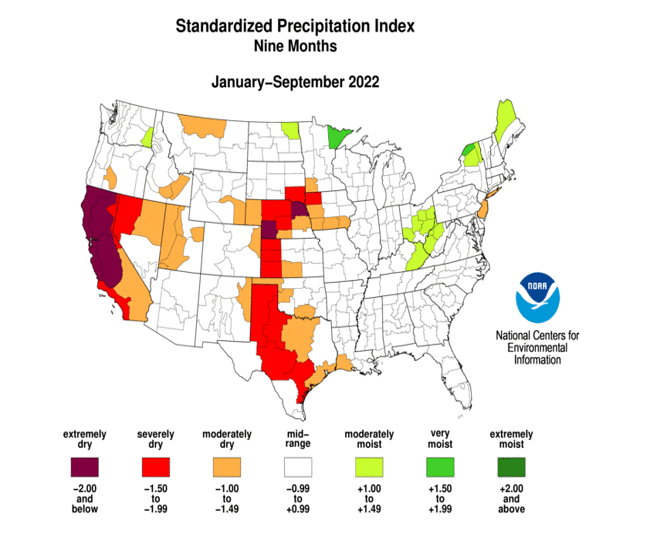
Overall, when integrated across the nation and across the entire year, 2022 was a warm and dry year. The annual nationwide ranks were 18th warmest and 27th driest), based on data for 1895-2022. But this was a year of extremes as considerable variation occurred throughout the year and across the country. On balance, the year was unusually wet from the central Appalachians to northern New England, and across parts of the northern Plains to western Great Lakes, Southwest (Four Corners states), and interior Pacific Northwest. The year ended up unusually dry across much of the West Coast to Great Basin, much of the Great Plains, and parts of the coastal Southeast, with Nebraska having the fourth driest year on record, California ninth driest, and Texas 13th driest. Unusually warm temperatures characterized much of the year across the West, East Coast, and southern tier states, with seven states ranking in the top ten warmest category, including Florida and Rhode Island at fifth warmest.
Weather conditions varied across the country from month to month during 2022, with short-term very dry conditions and unusual anomalous warmth frequently occurring. Some areas were excessively dry during one part of the year and excessively wet during another part:
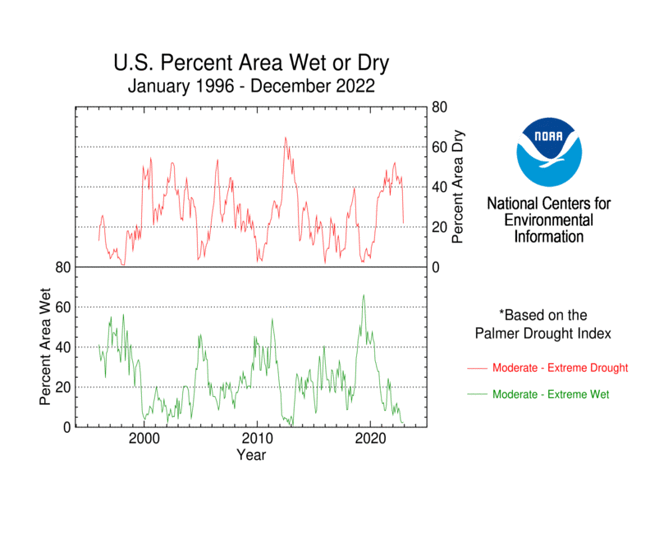
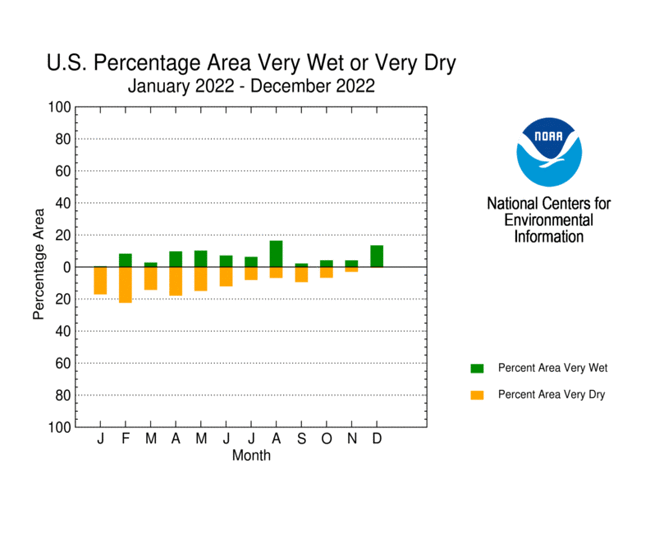
- About five percent or more of the contiguous U.S. (CONUS) was very dry during every month except November and December, with ten percent or more very dry in January (16.9%), February (22.1%), March (14.1%), April (17.6%), May (14.7%), and June (11.9%). Nationwide, February was driest with more than a fifth of the CONUS very dry. Expansive very wet conditions balanced the large dry areas (on a national basis) during July and November, but the actual amounts during those two months were still below ten percent. Five percent or more of the CONUS was very wet during February, April, May, June, July, August, and December, with ten percent or more very wet during only August (16.2%) and December (13.3%). During January to July and September to October, more of the country was very dry than very wet, but in August and November to December more of the country was very wet than very dry.
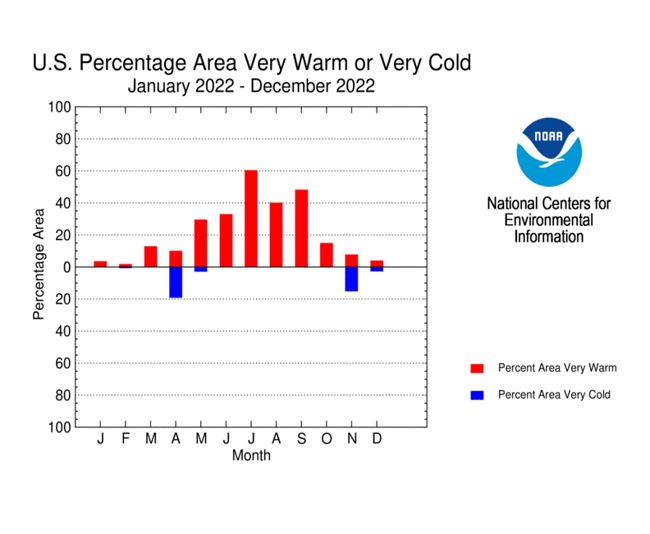
- Unusually warm temperatures dominated much of the country during most months, especially beginning in May. At least ten percent of the CONUS was very warm in March and every month from May to October. About a third (33%) or more was very warm in June (32.8%), July (60.2%), August (39.9%), and September (48.0%). Above-normal temperatures enhance evapotranspiration which worsens drought conditions. This was especially a problem during May-September for areas east of the Rockies and July-October in the Far West. Only two months had more than three percent of the CONUS very cold — April (19.0%) and November (14.9%).
-
Several areas that were very dry during one part of the year and very wet during another part include:
- the Southwest (Four Corners states) (generally dry during January-May and December; wet during June-October)
- California-Nevada (dry January-May and October; wet August-September and December)
- the northern Plains (dry January-March, June, and August-September; wet April-May and December)
- the southern Plains (dry January-February, April, June-July, and September; wet August and November)
- southern New England (dry May, July-August; wet February, September, and December)
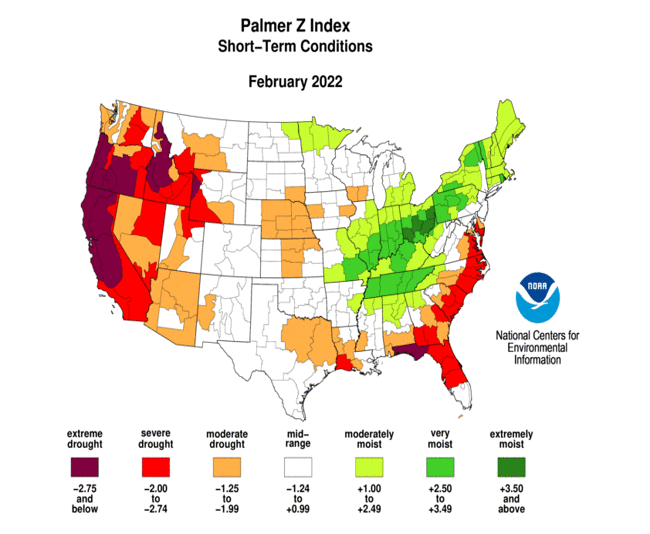
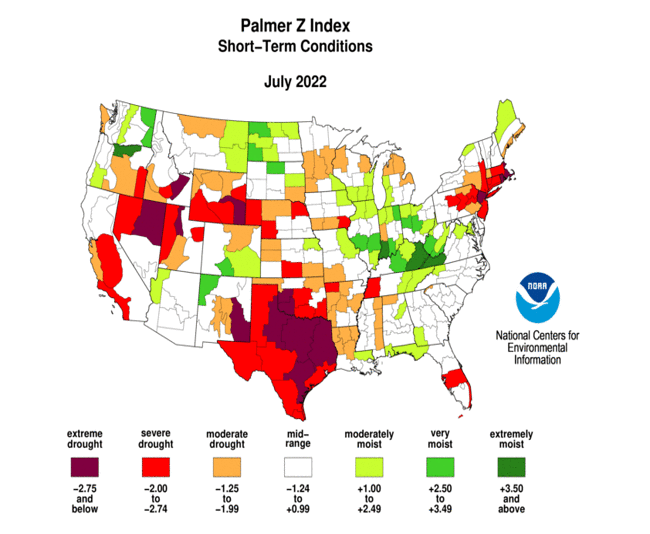
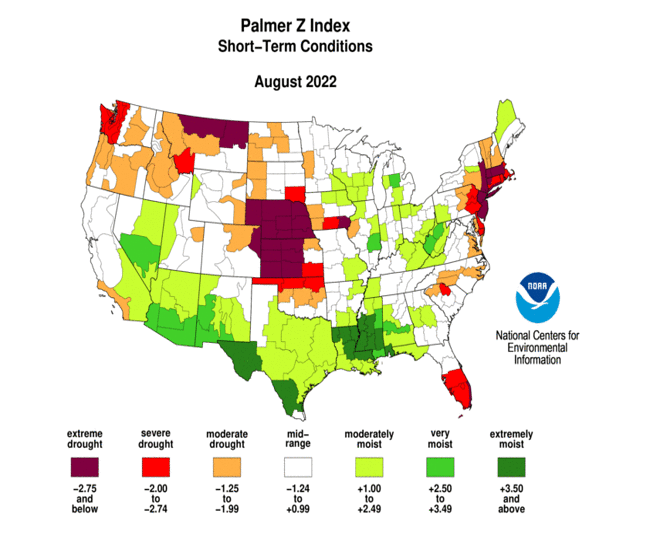
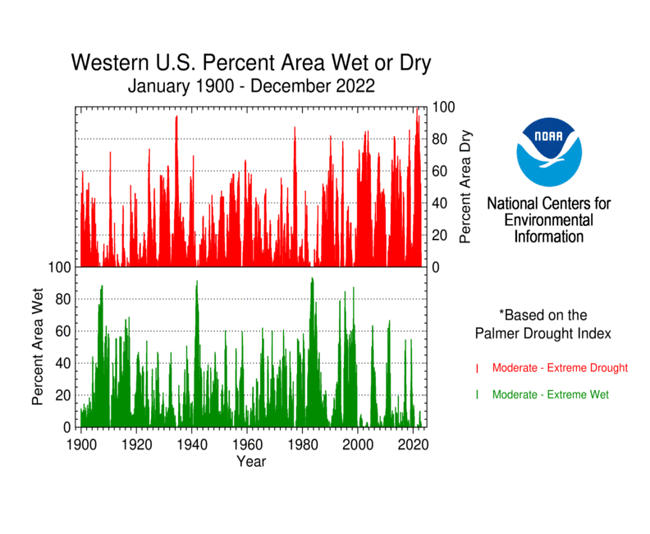
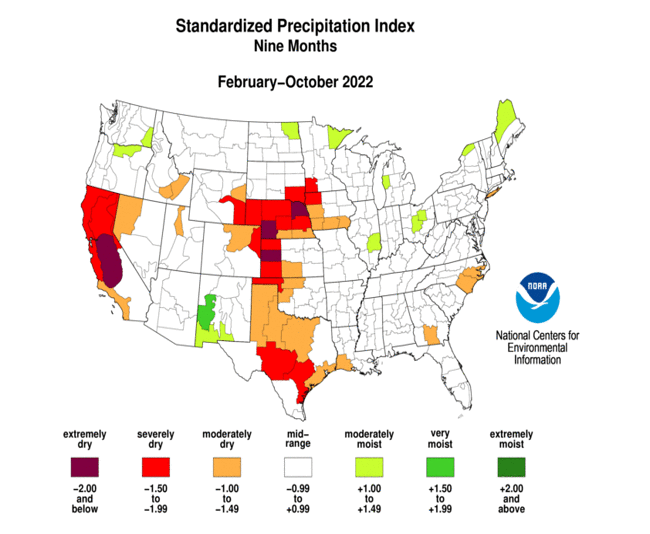
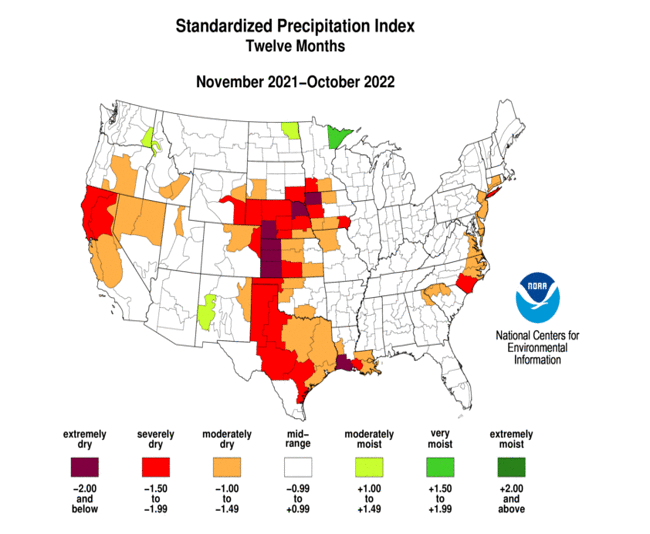
The Palmer Z Index incorporates moisture supply (precipitation) and moisture demand (evapotranspiration) to depict the total moisture status each month. The Palmer Z Index maps below show the monthly moisture status for each month in 2022:
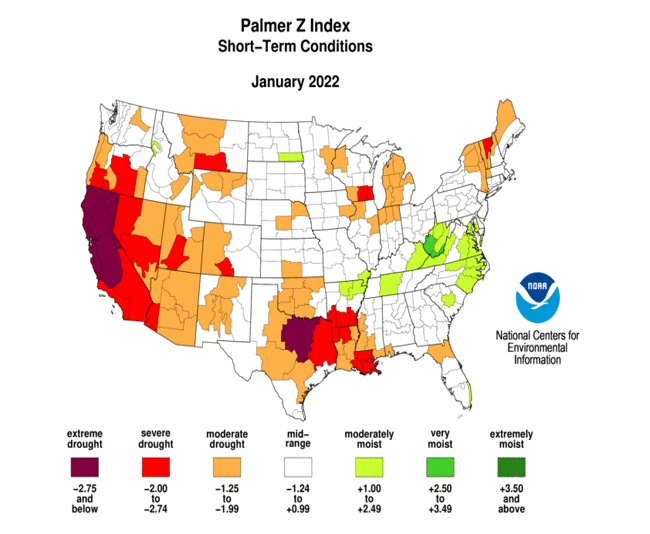


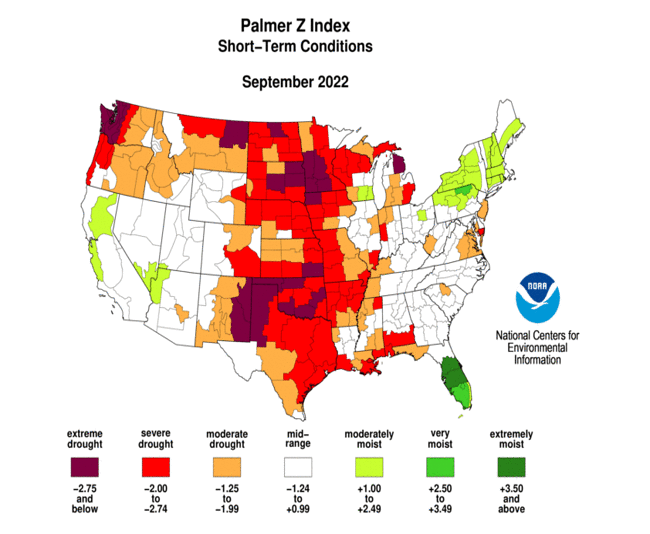
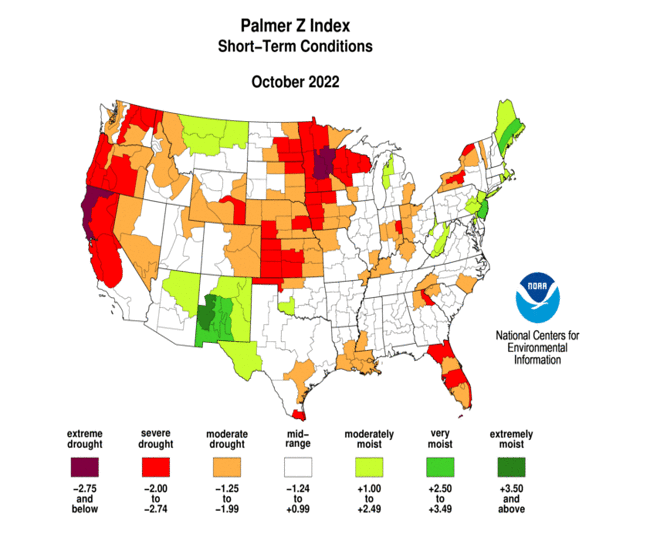

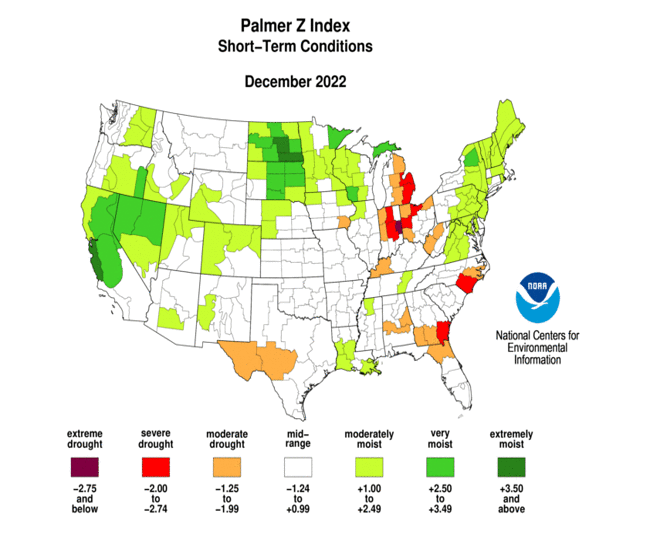
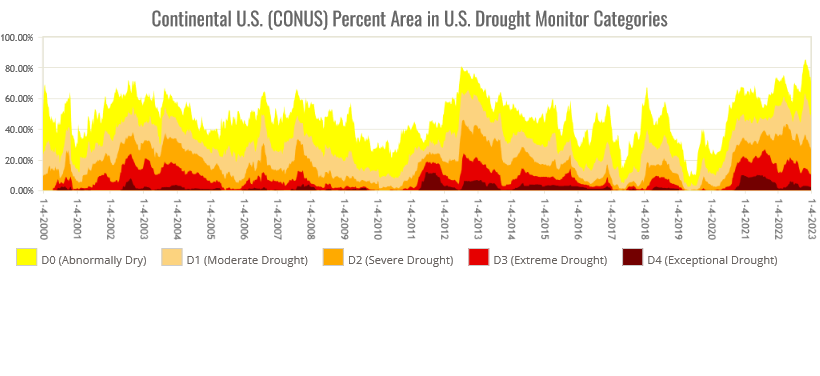
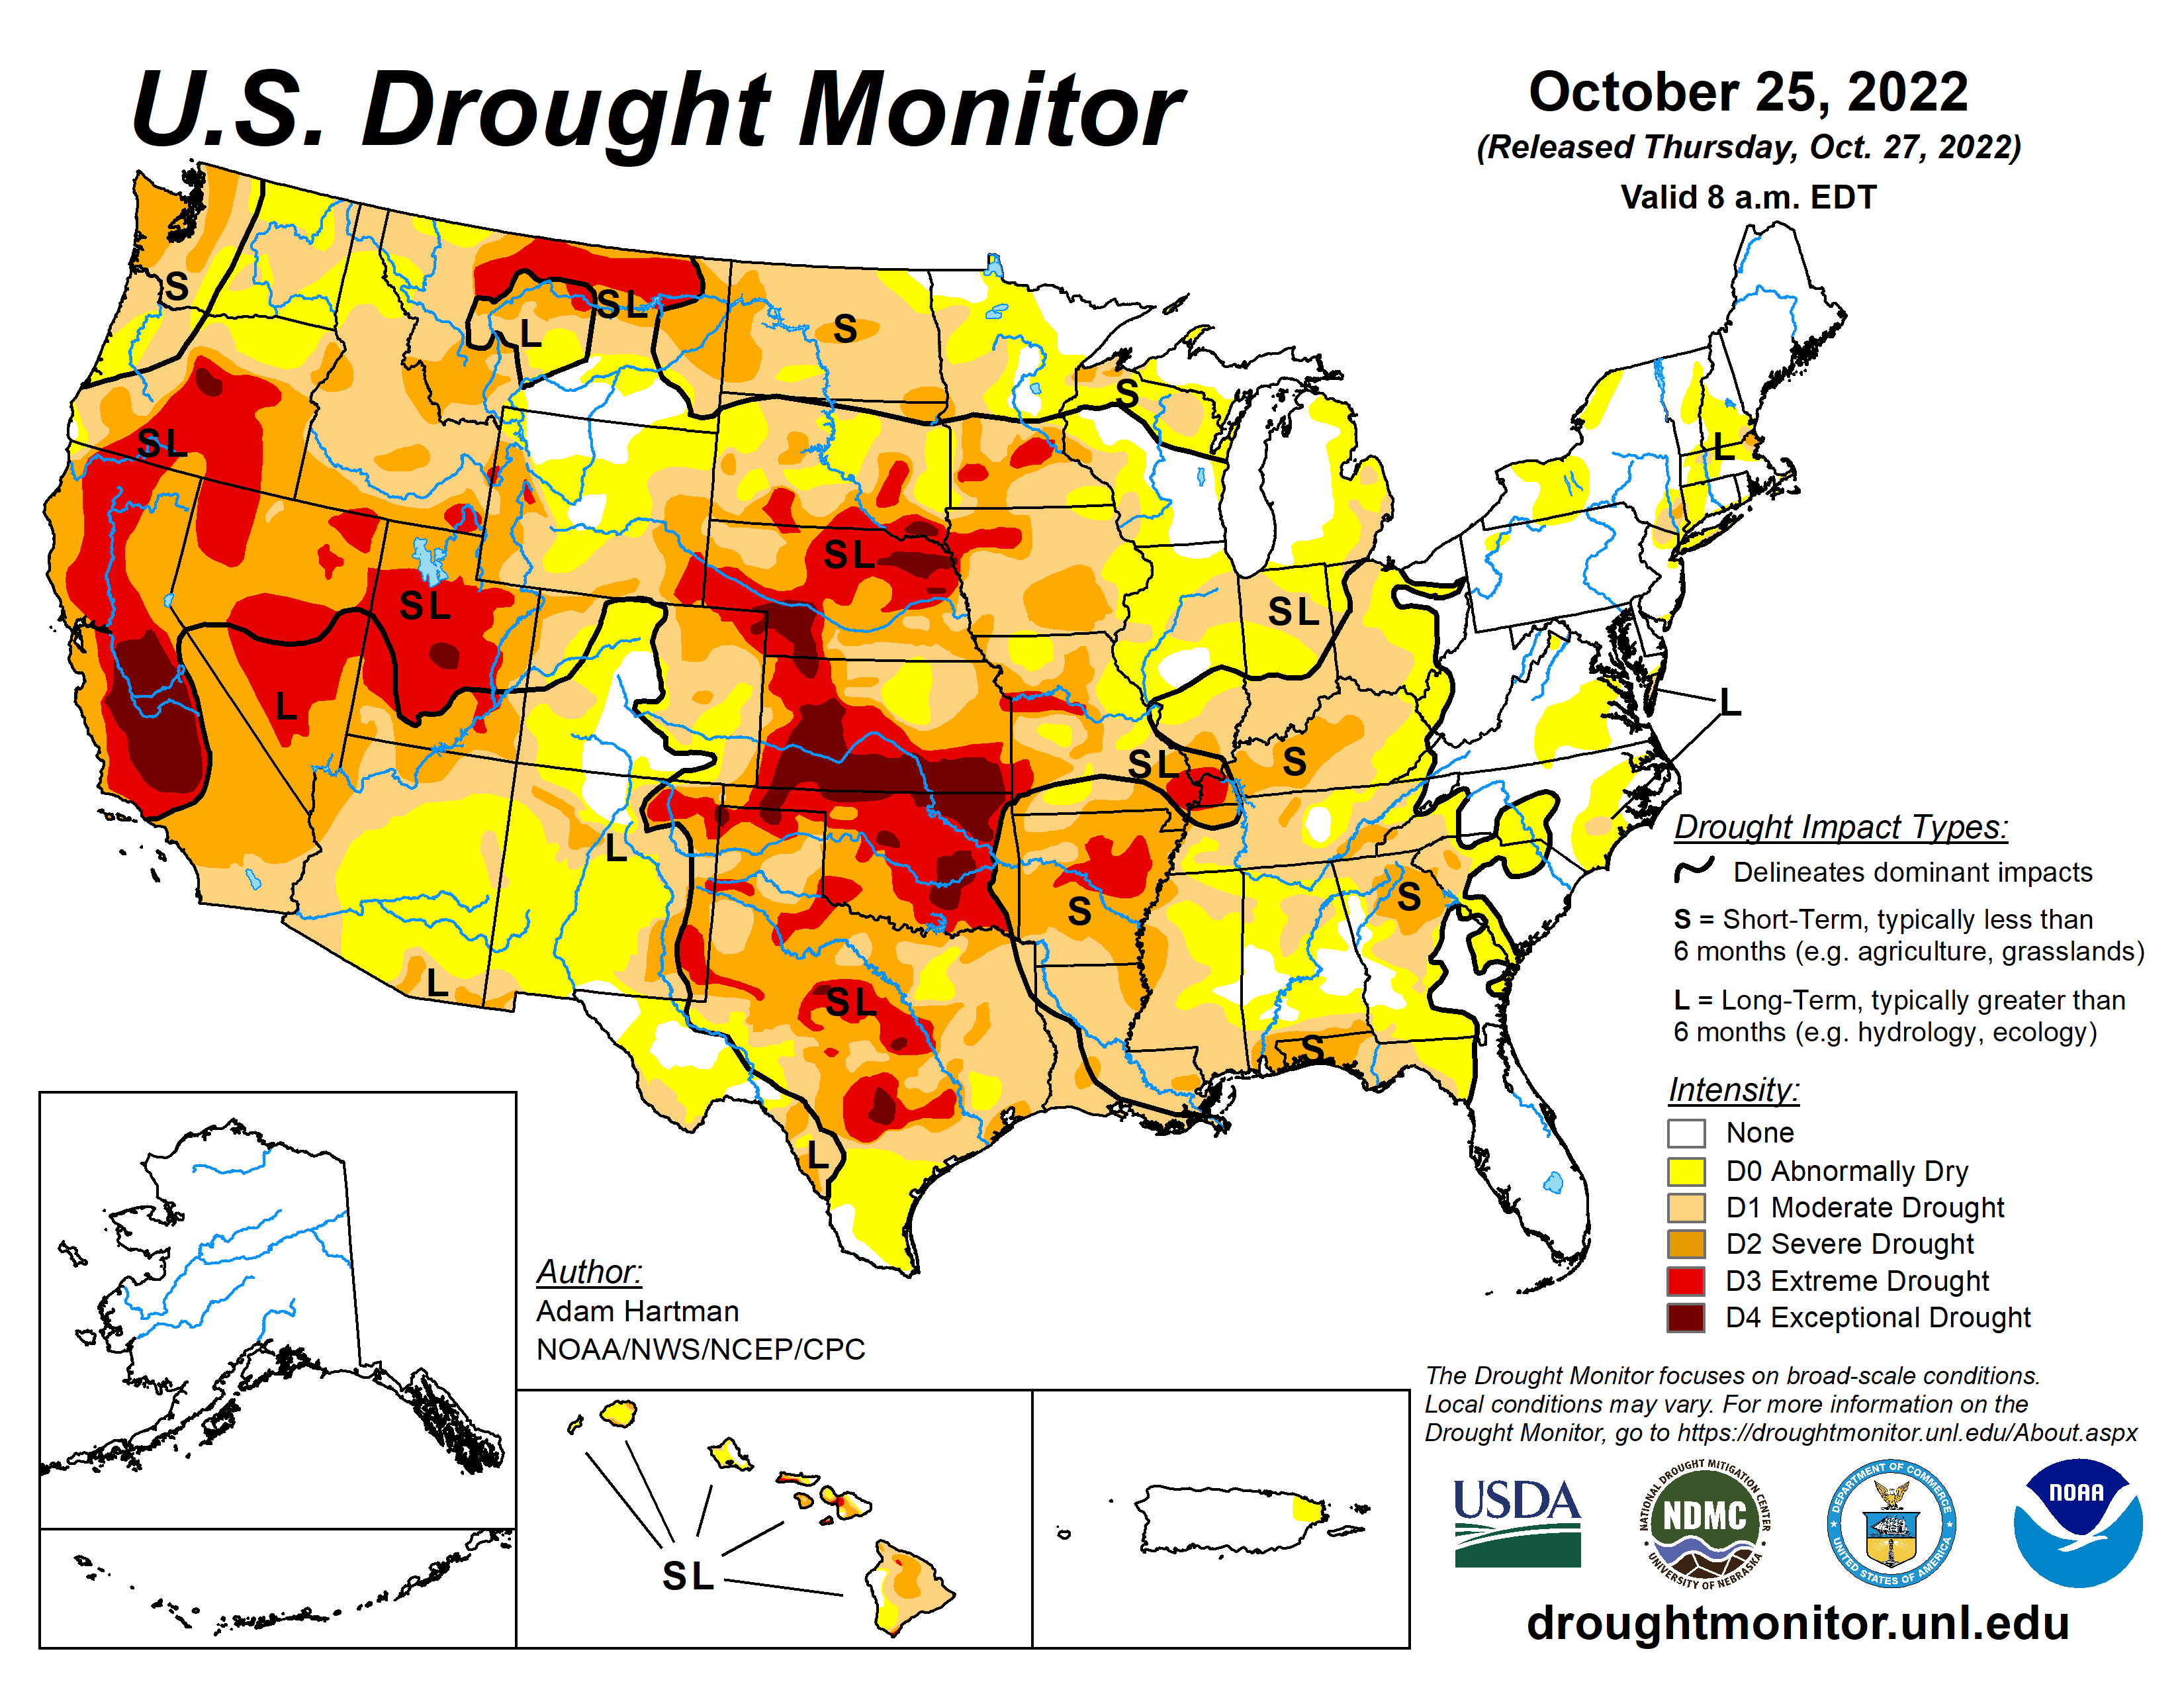
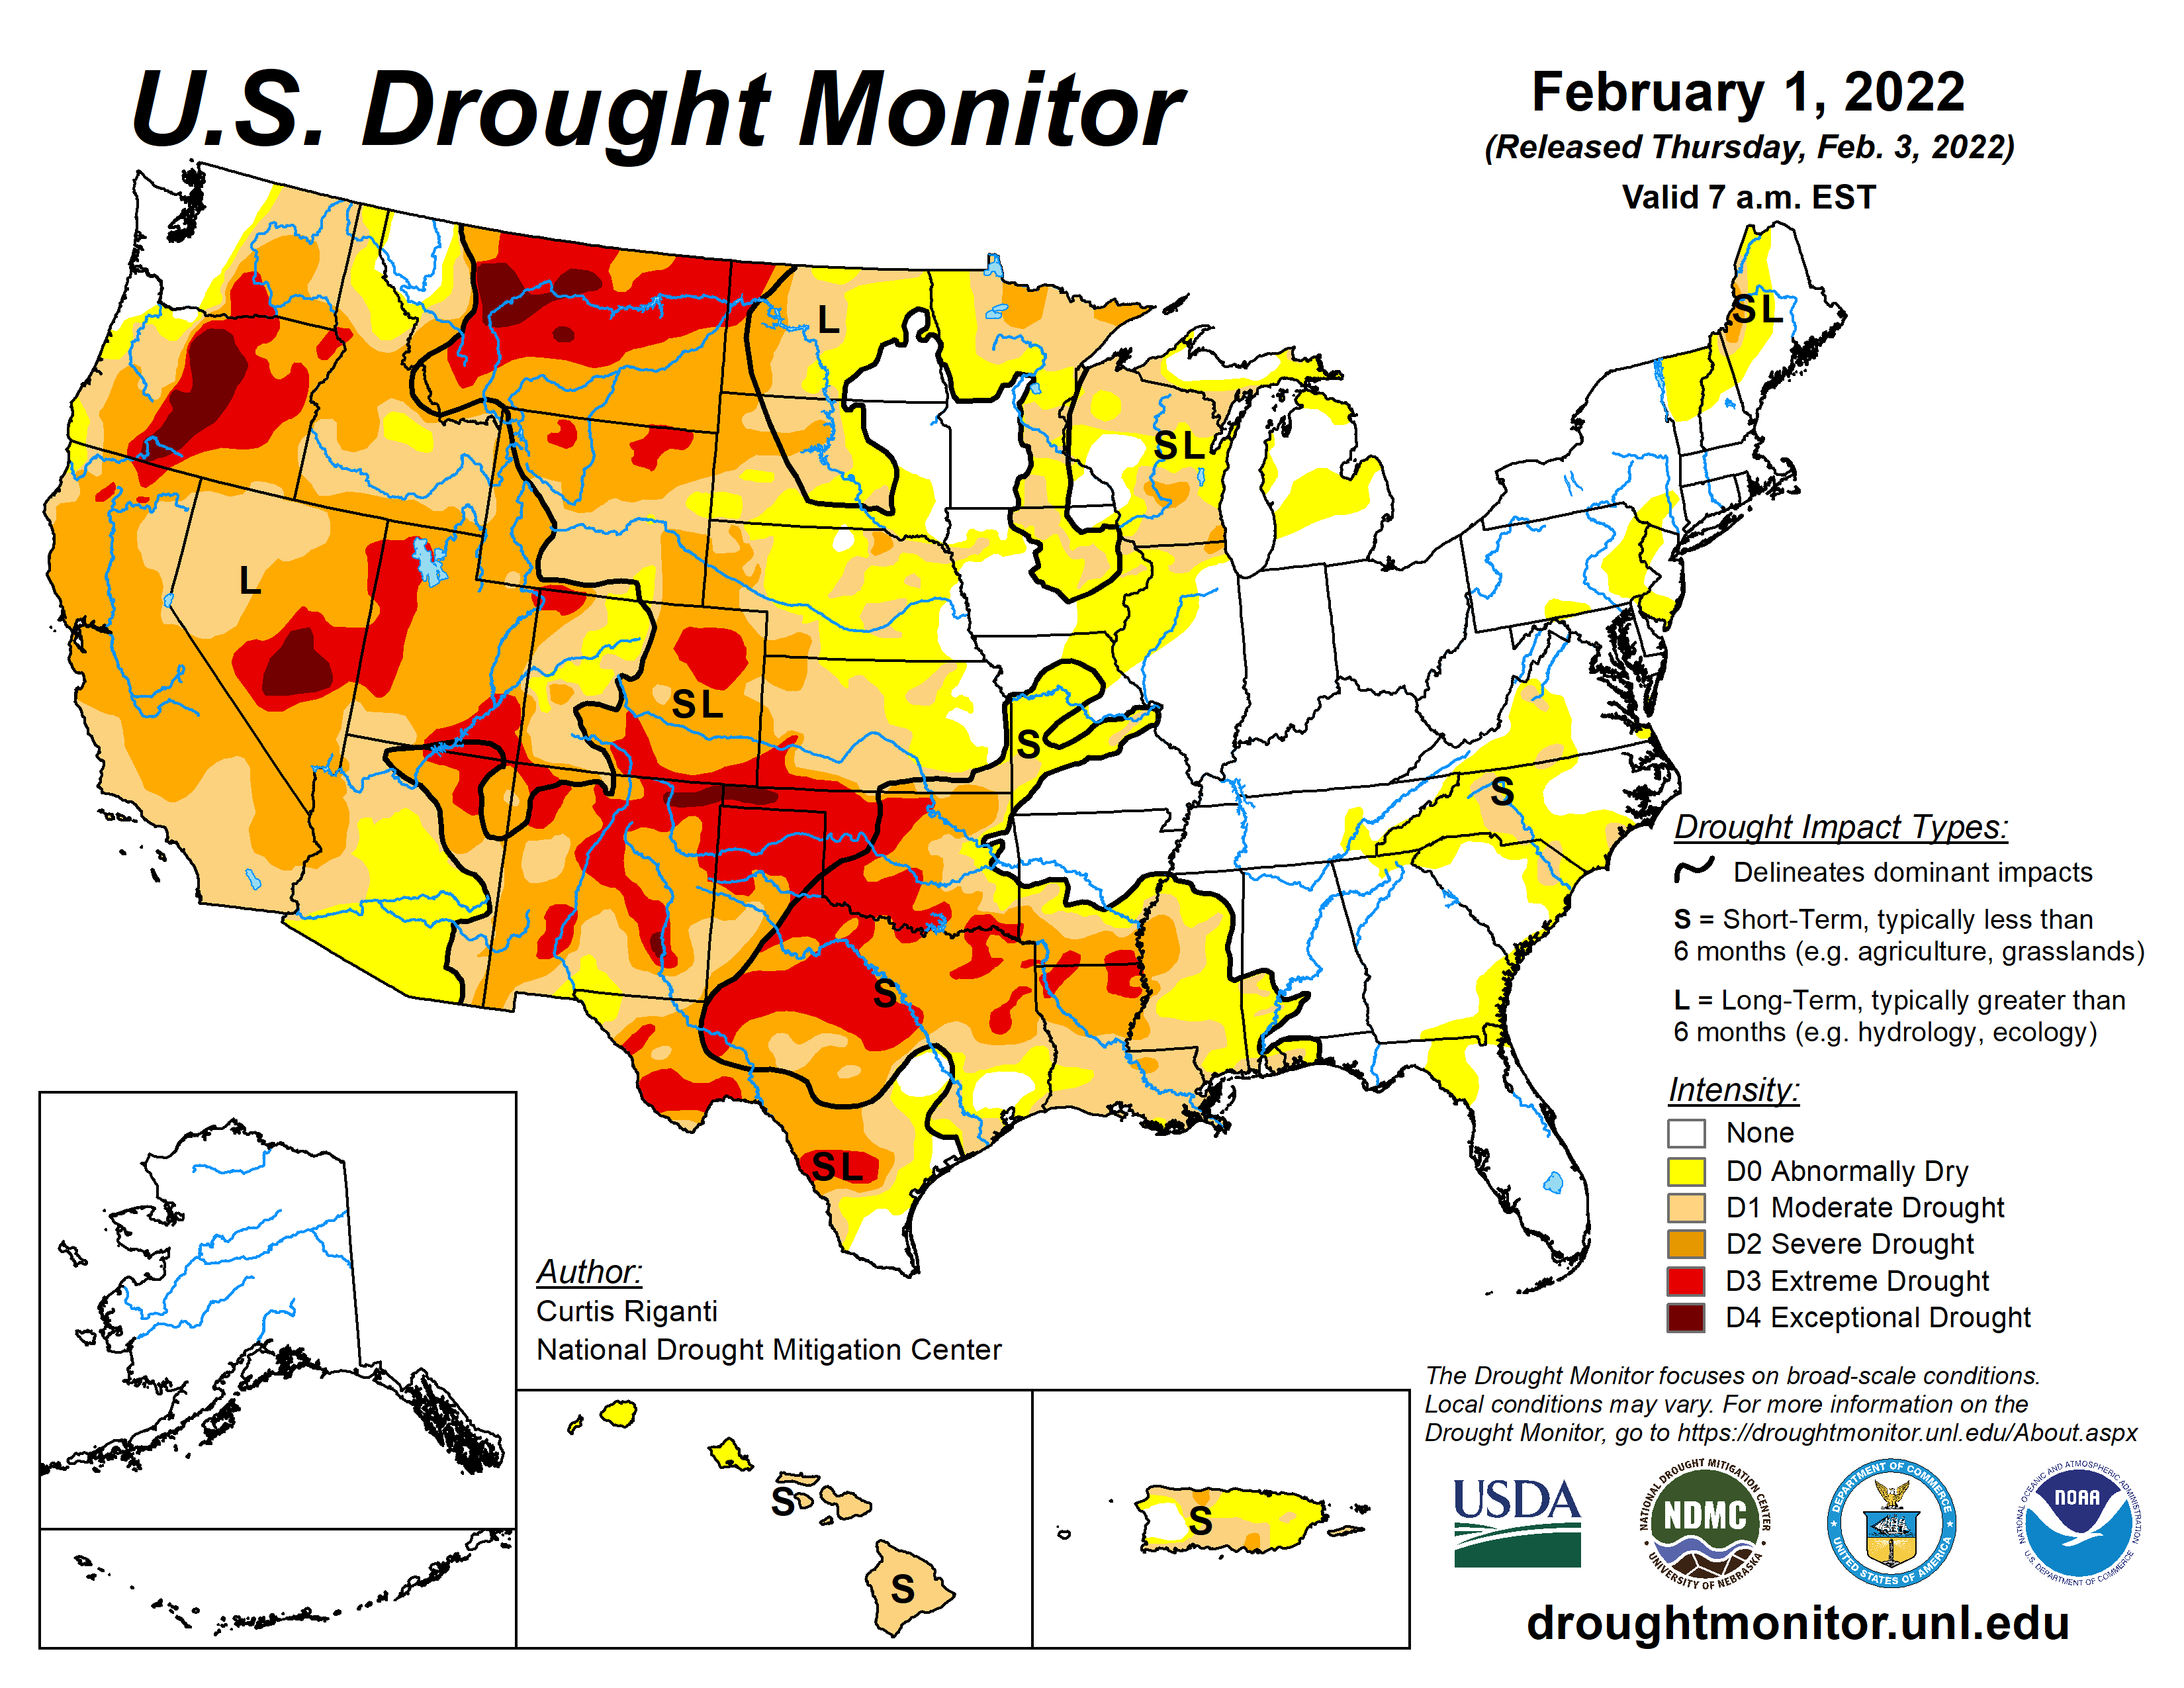
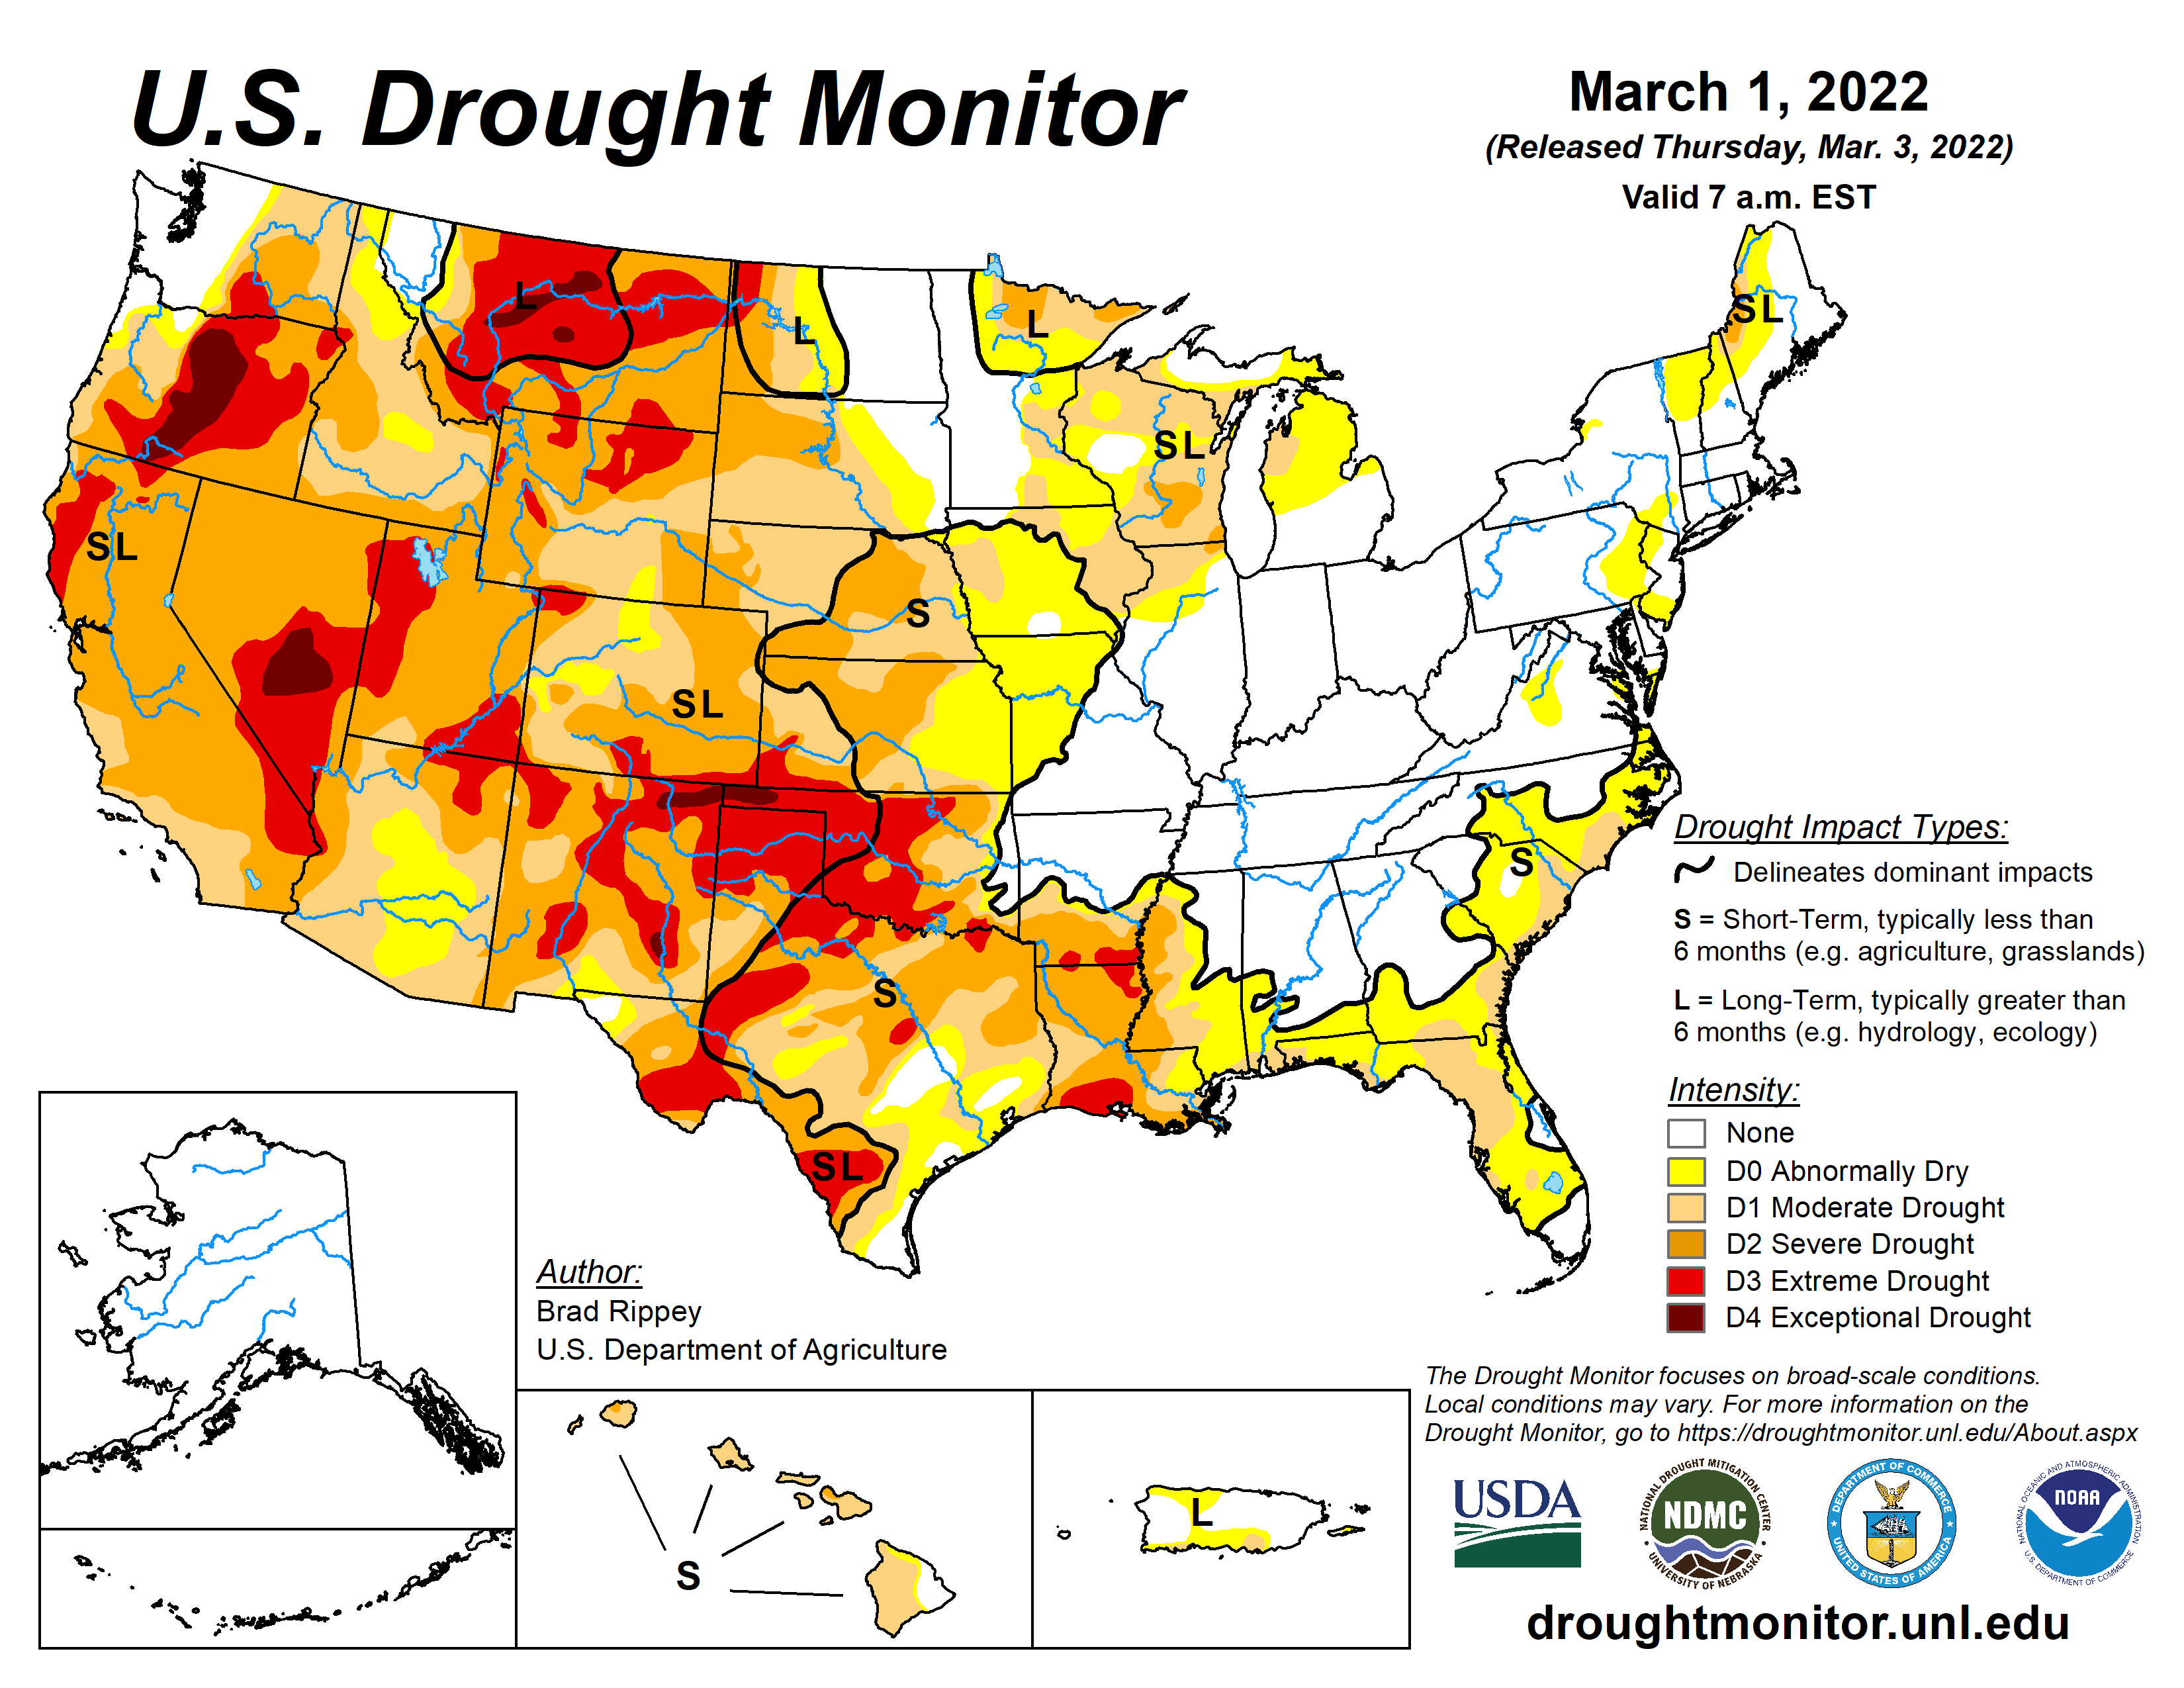
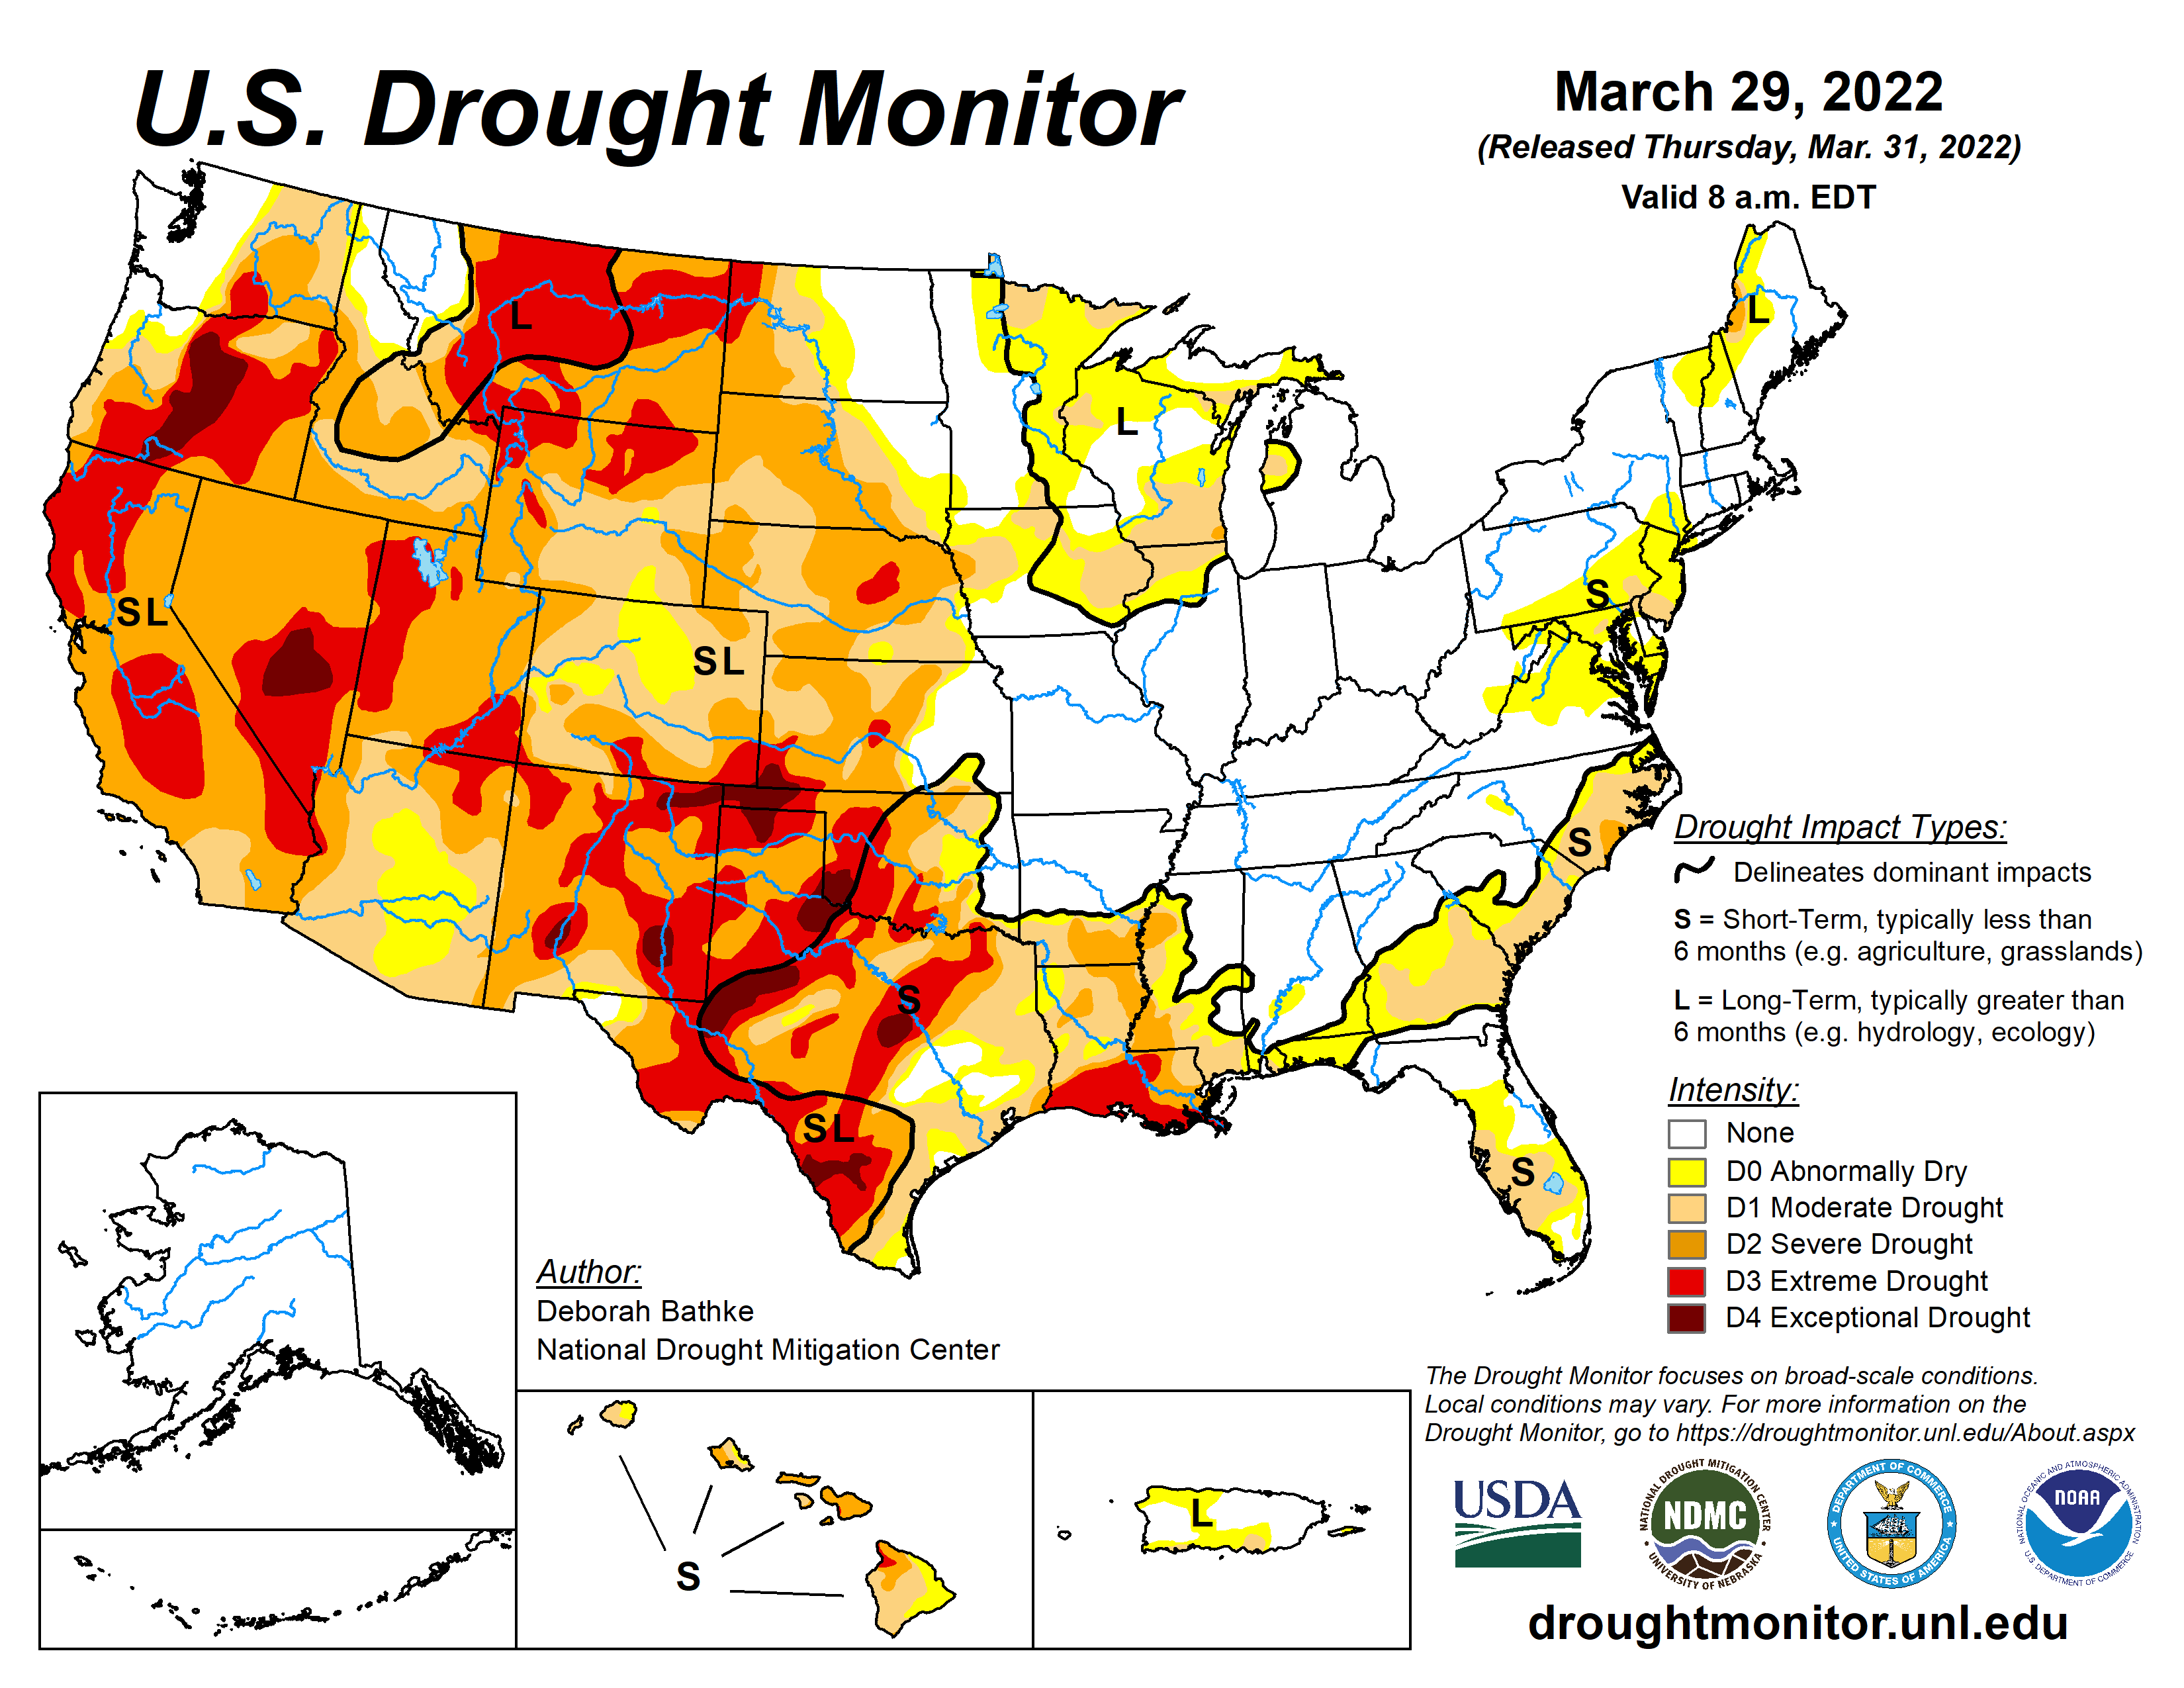
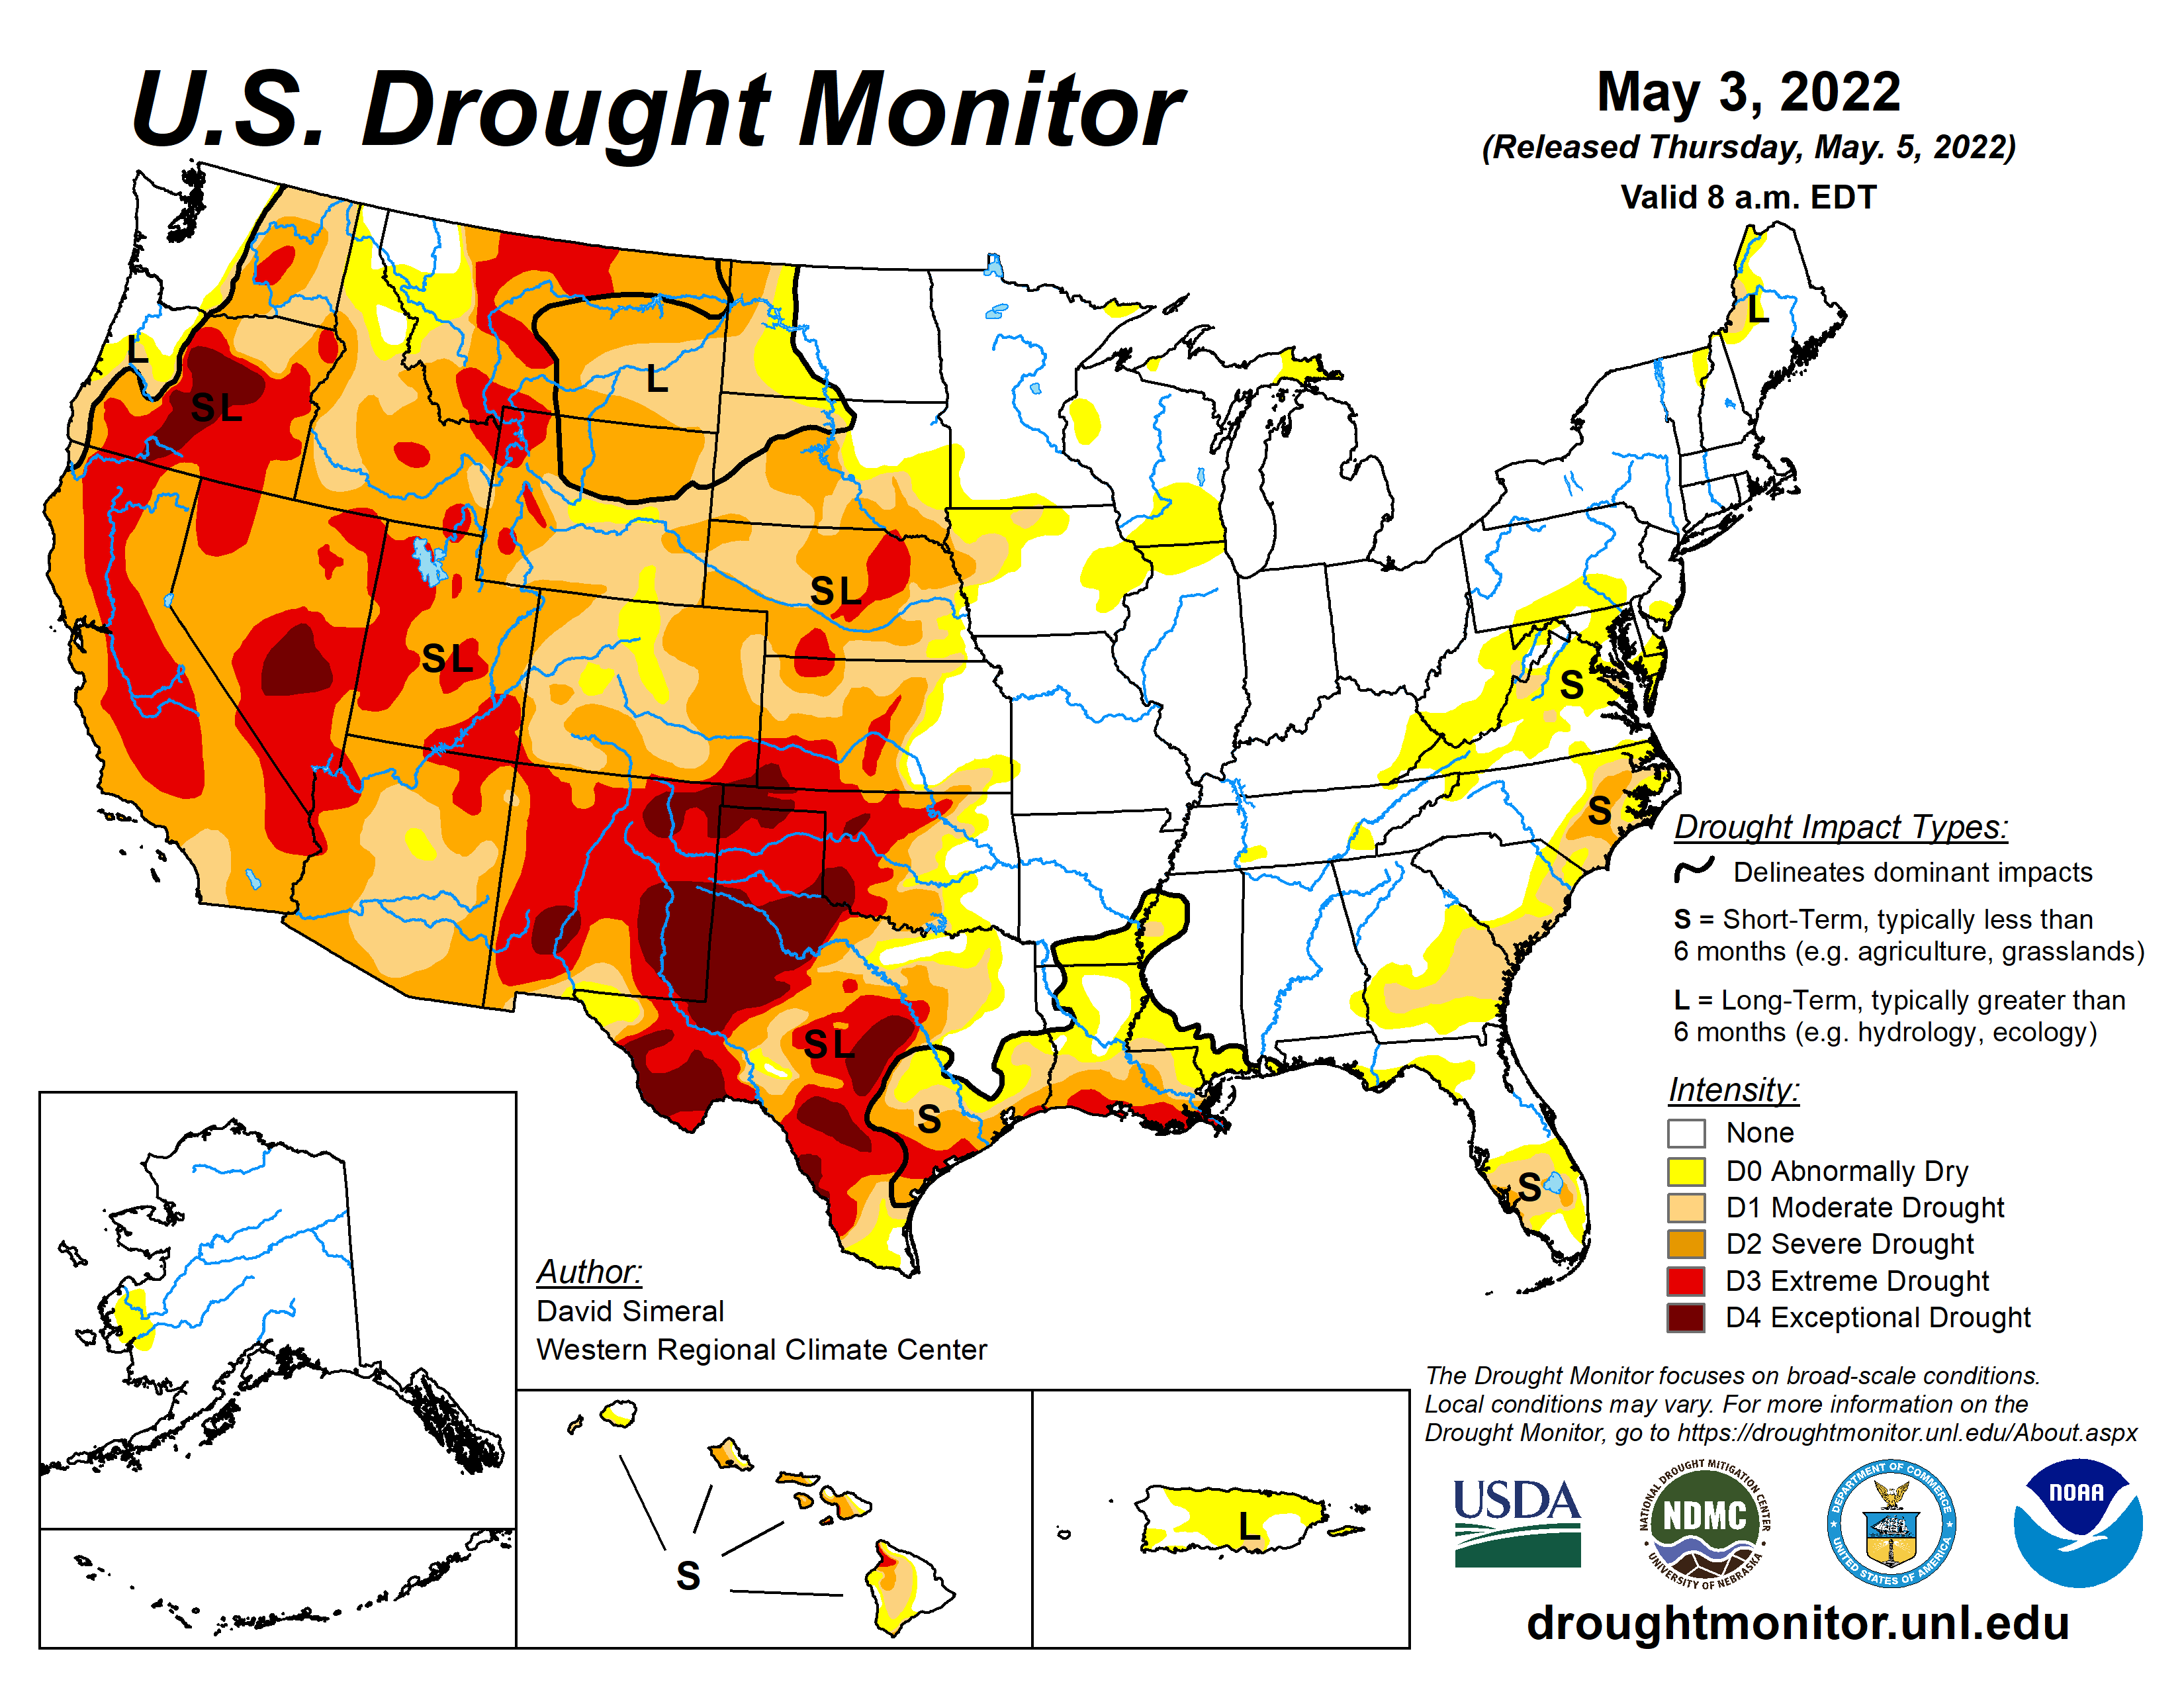
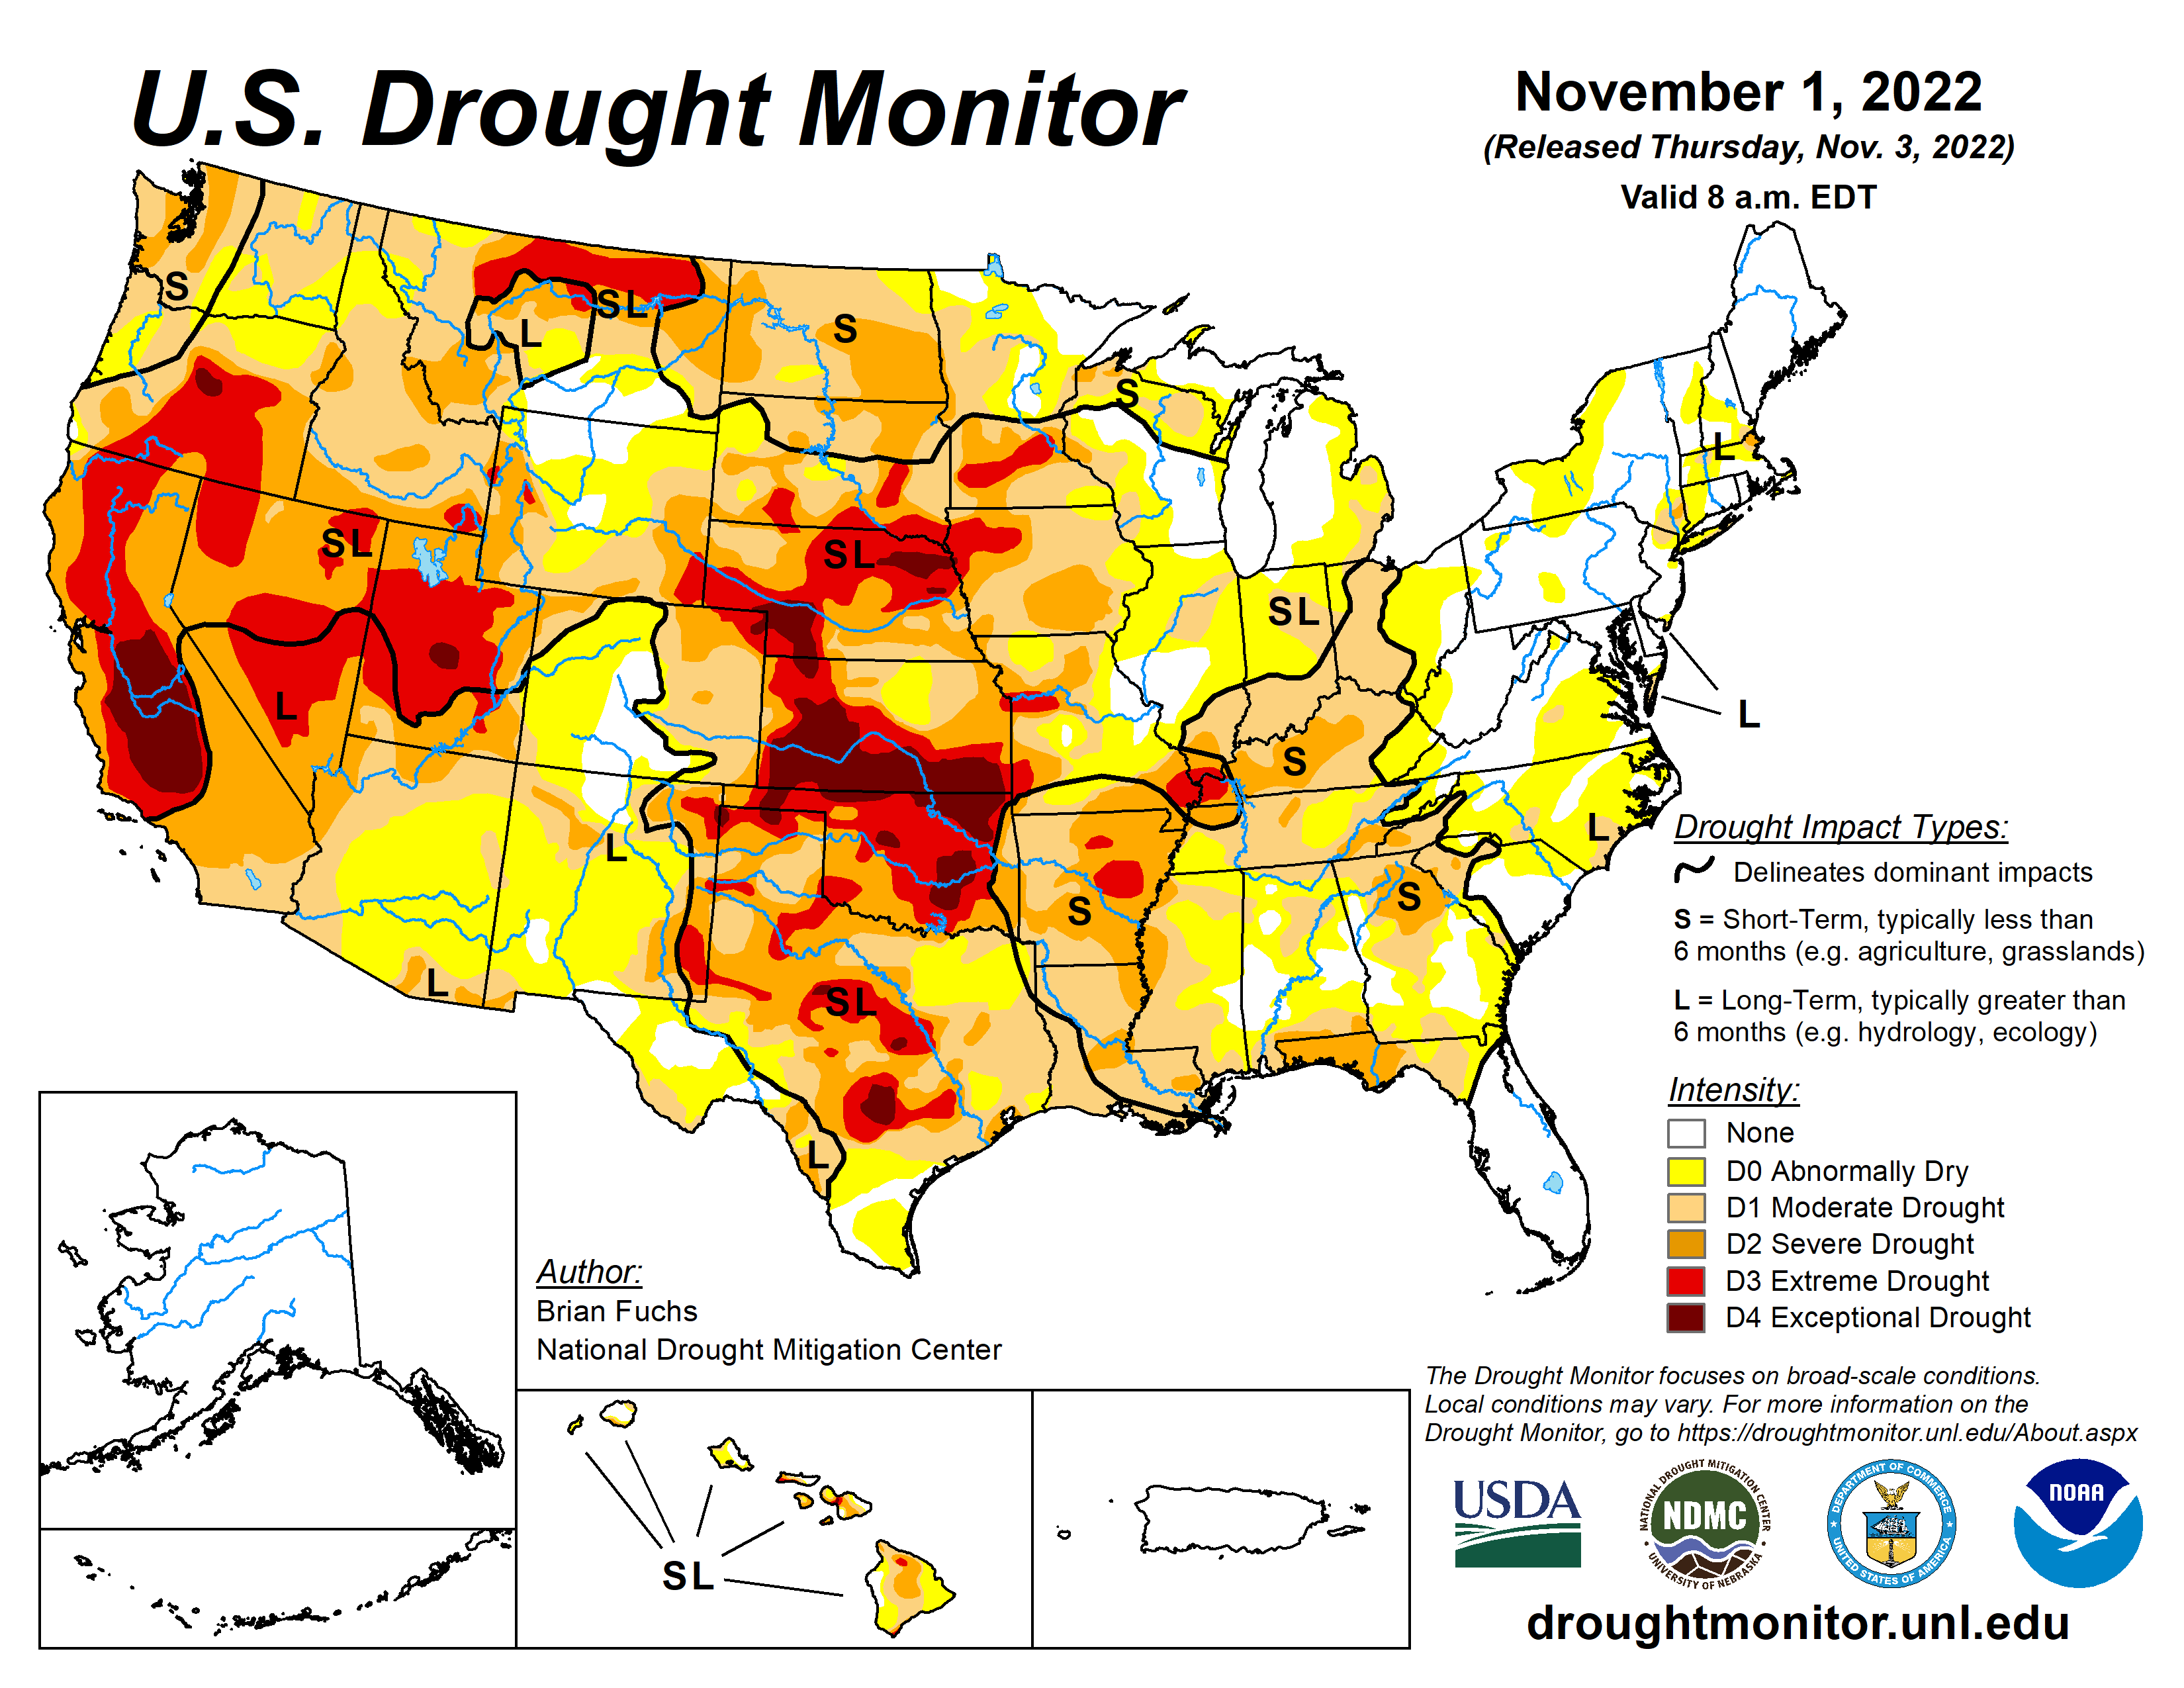
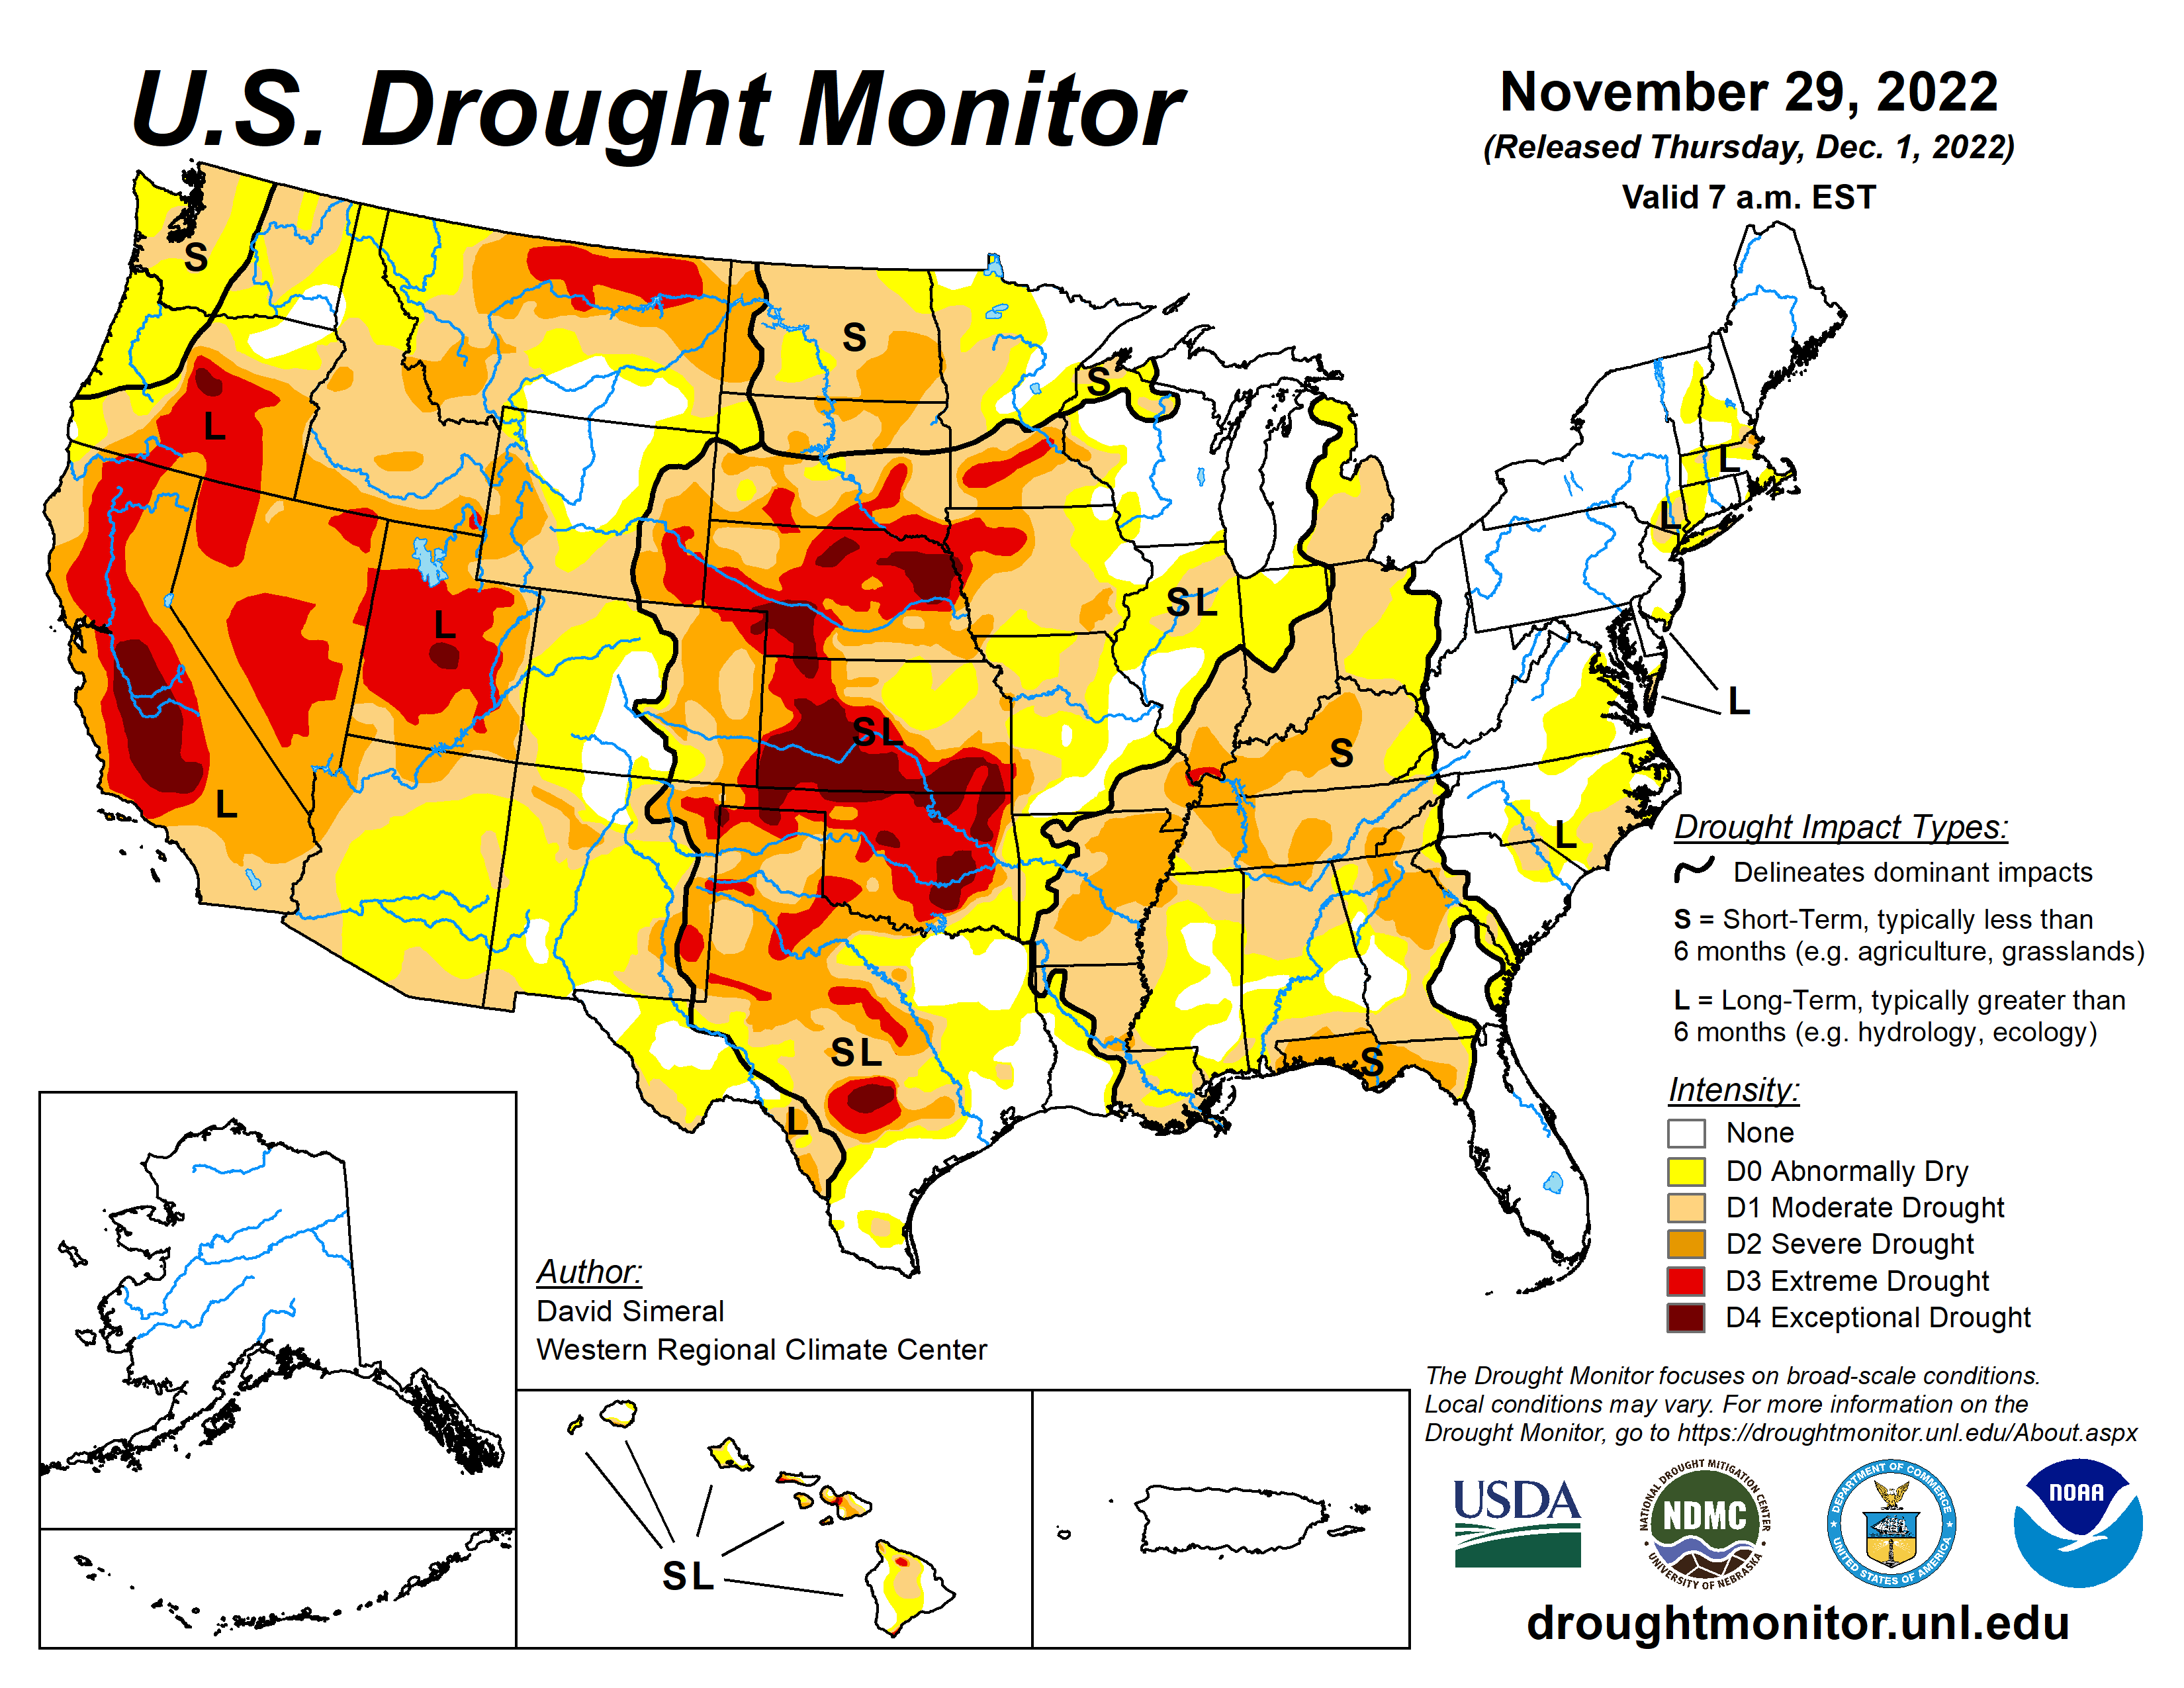
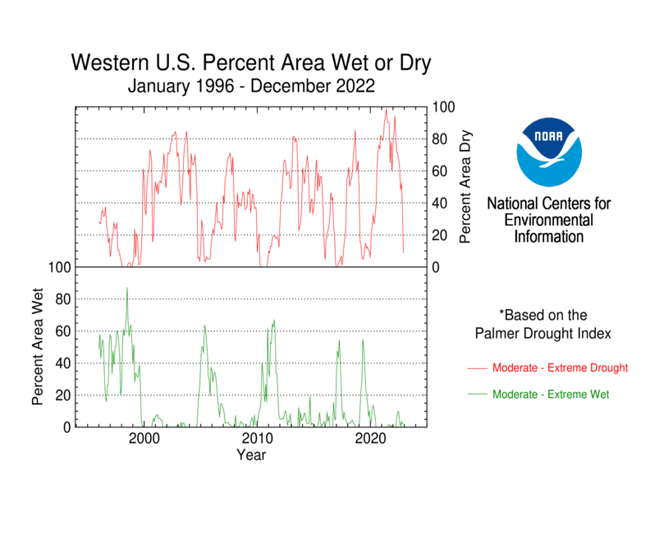
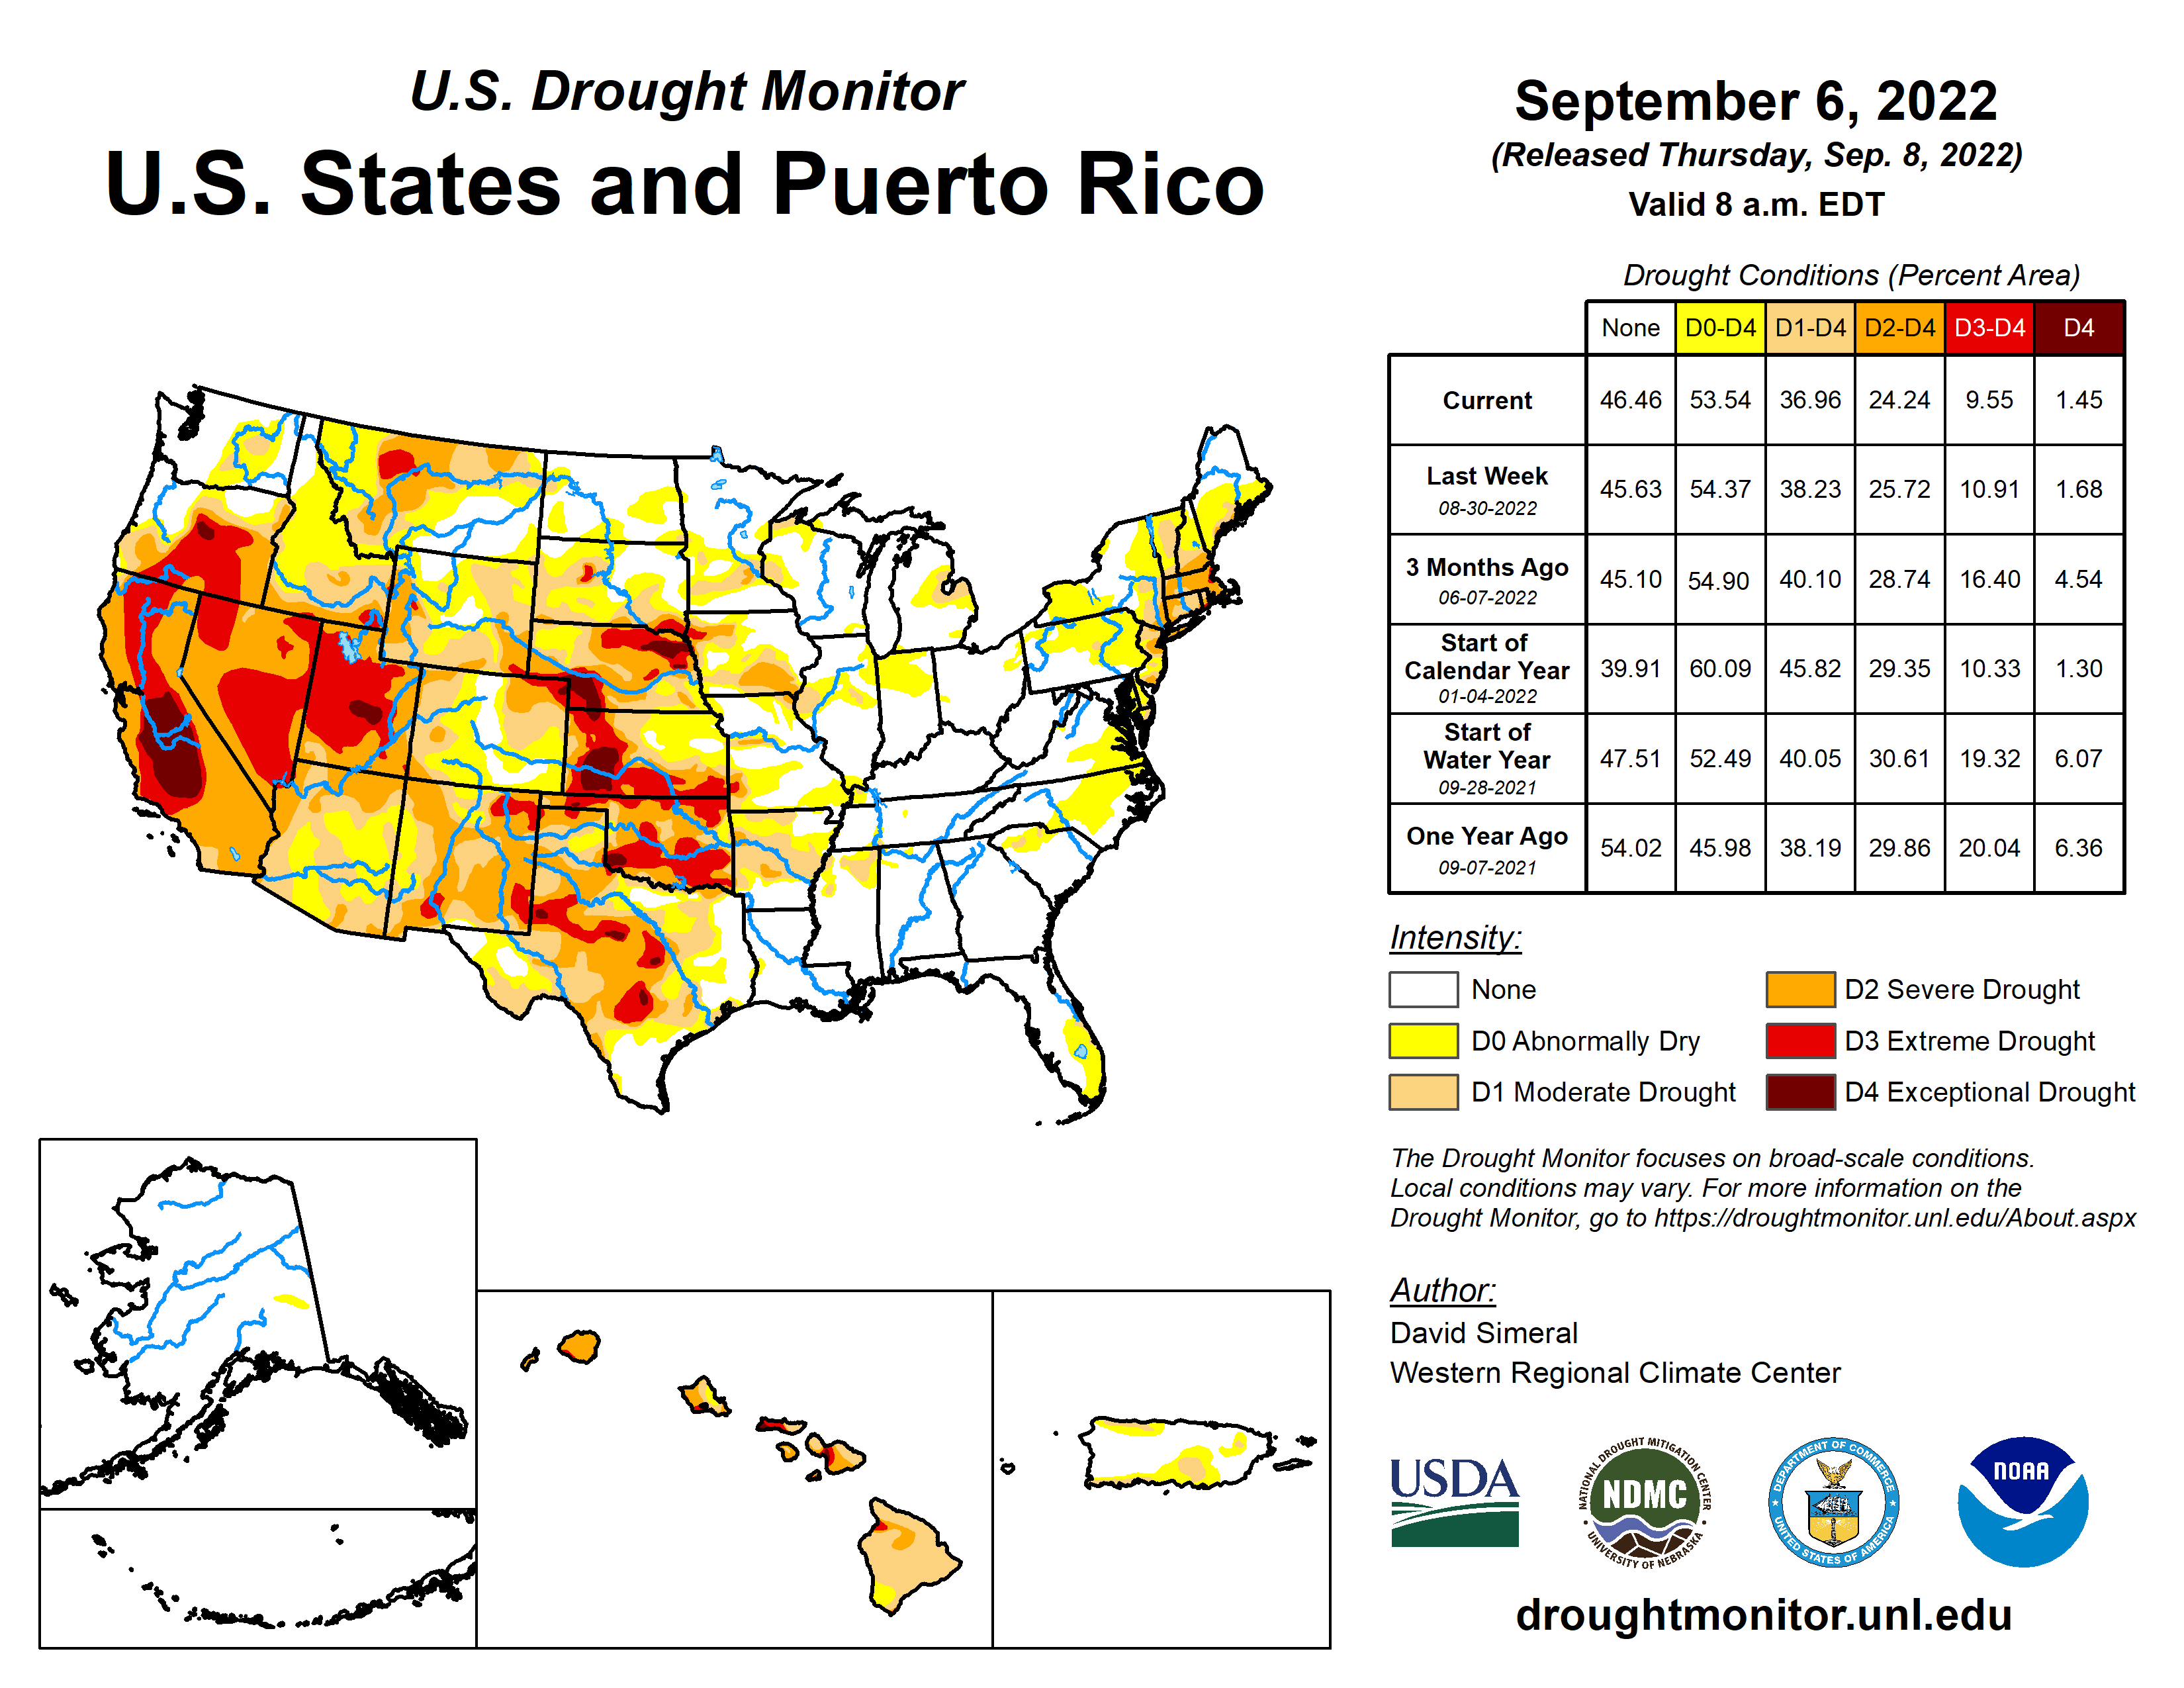
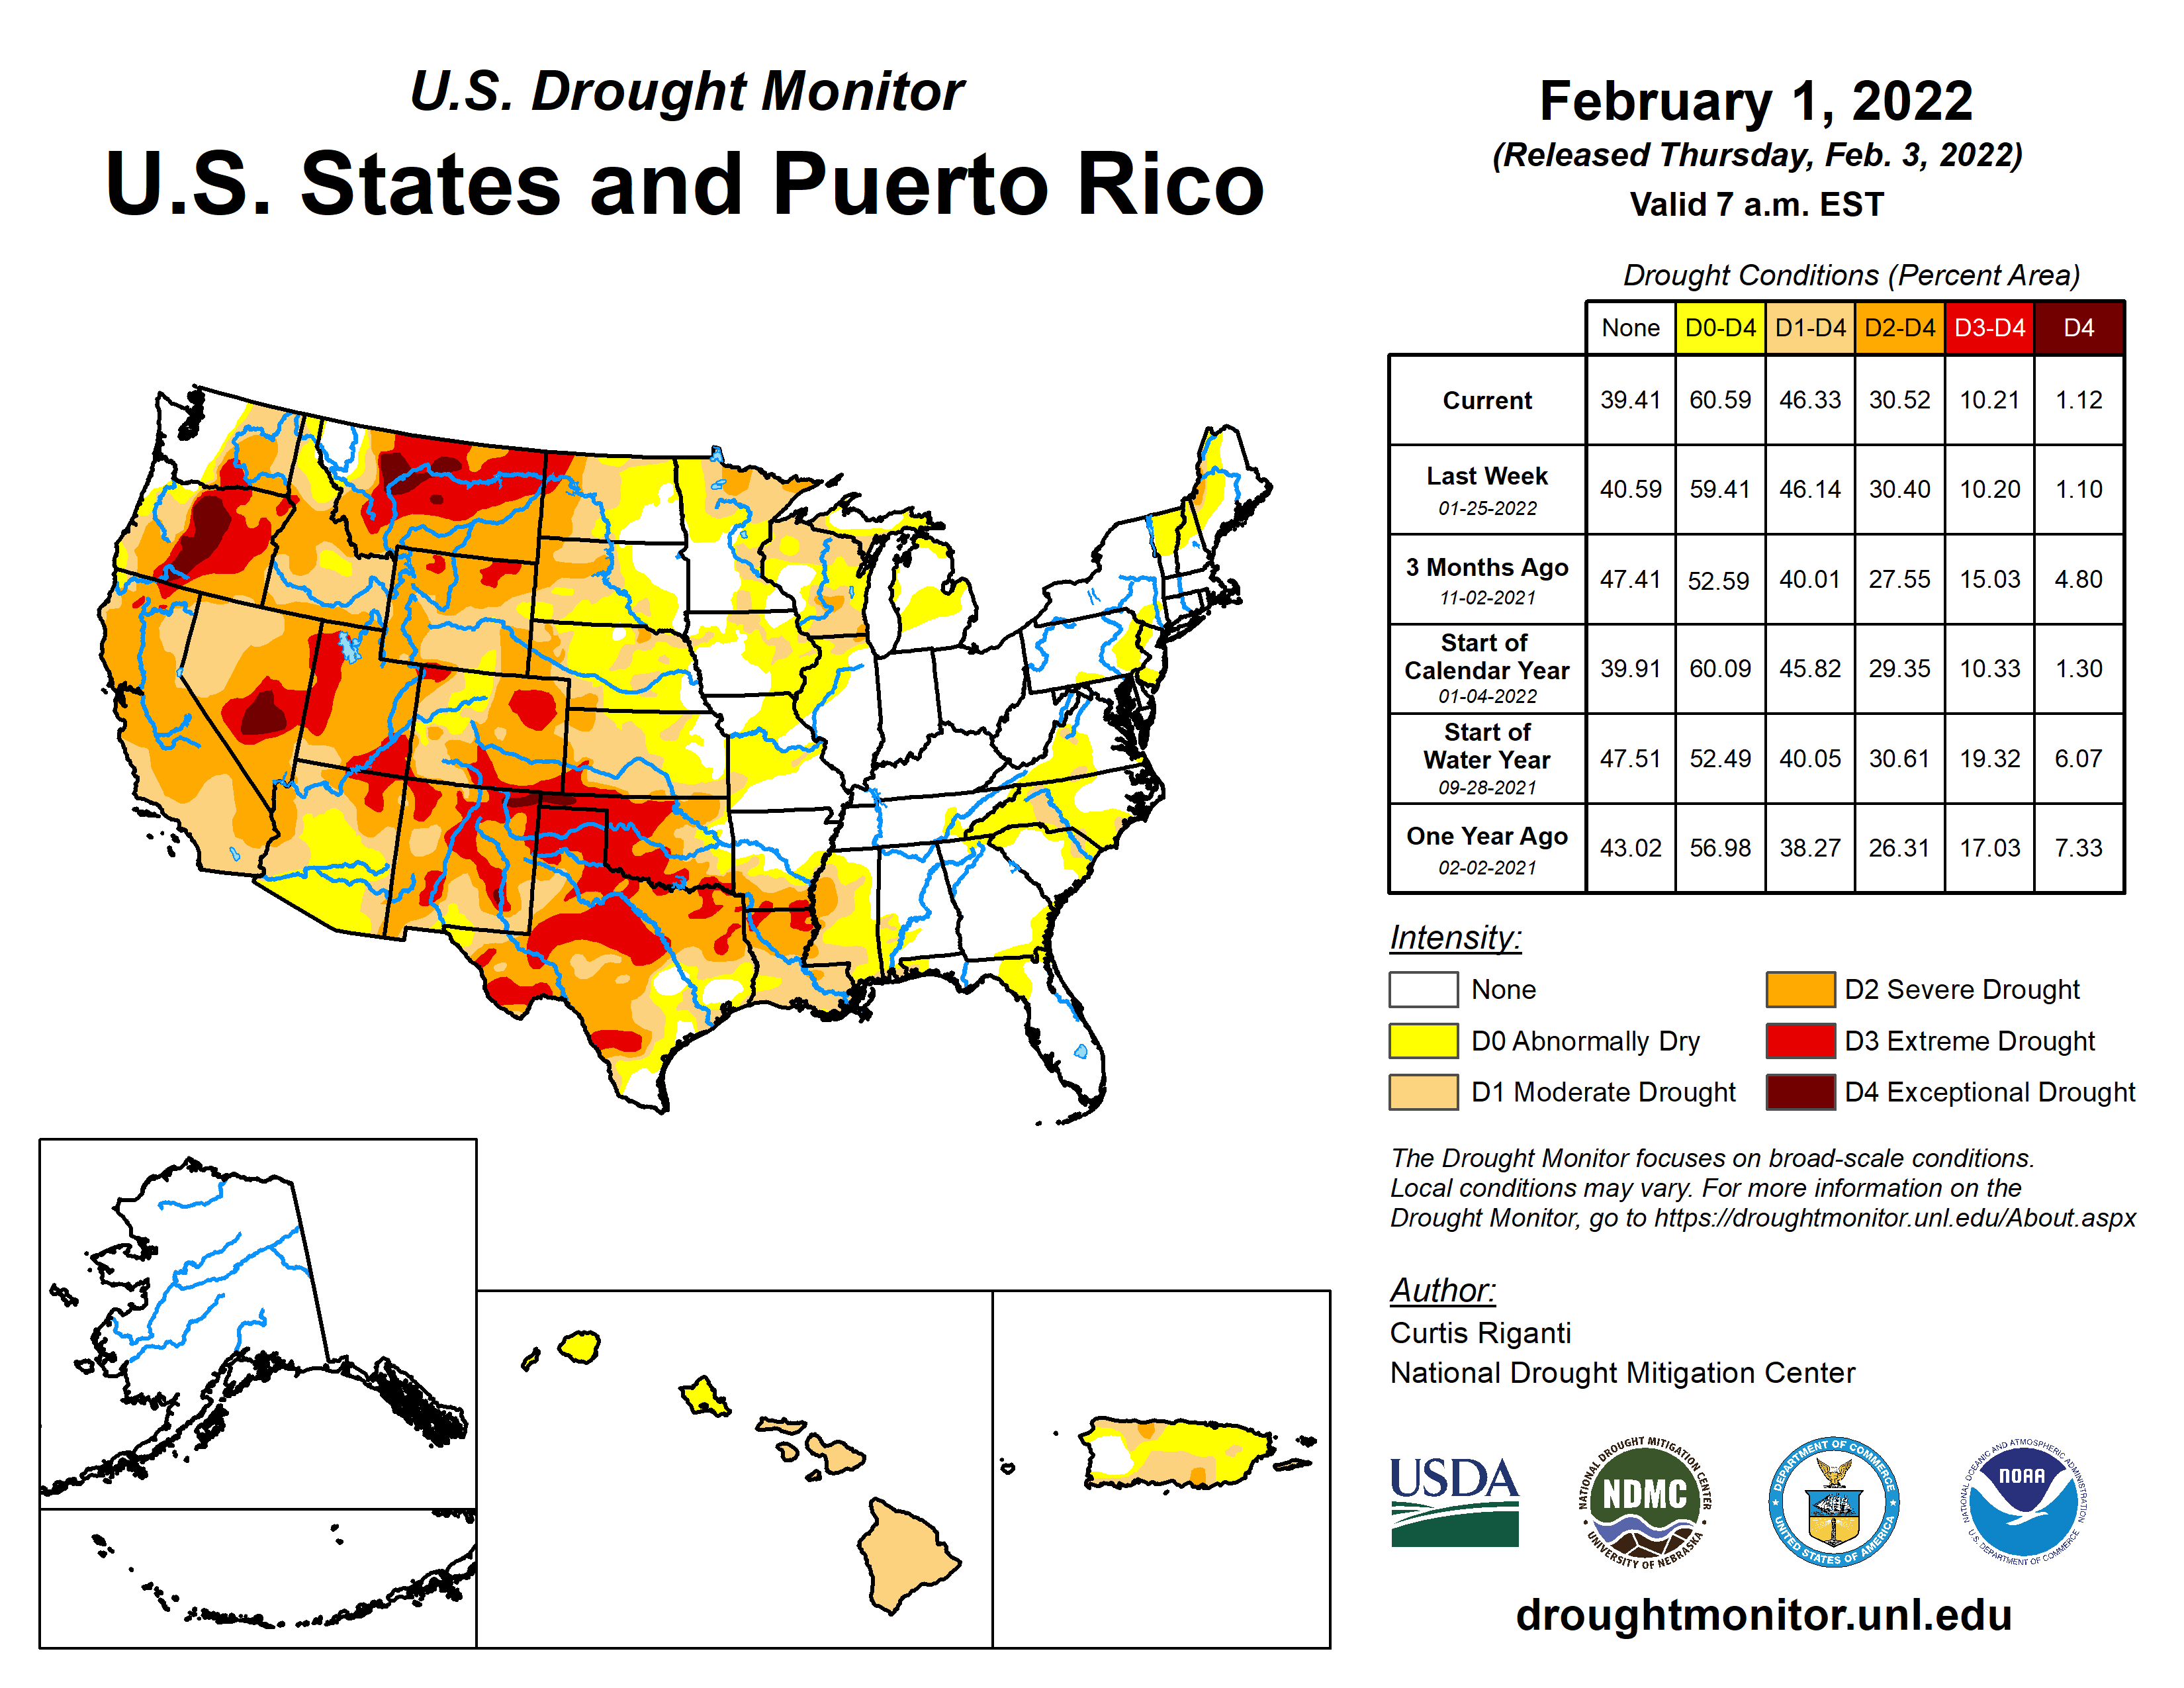
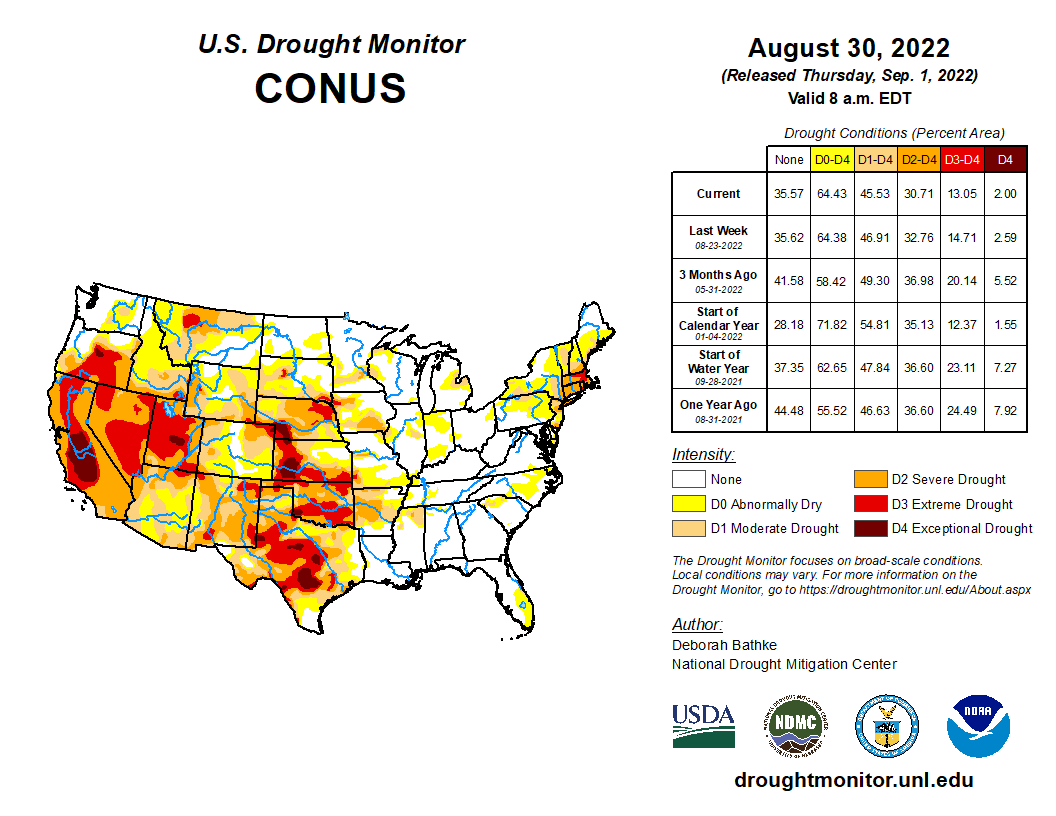
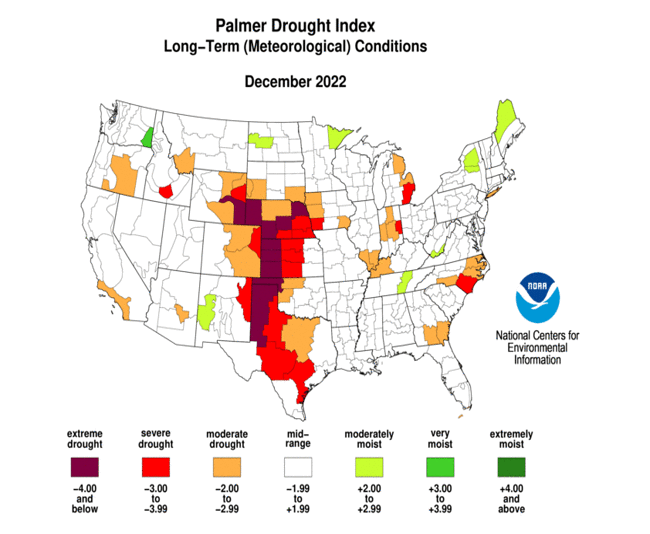
On a national scale, large areas of drought affected the country throughout 2022. The year began (January 4) with drought and abnormal dryness in most of the West and Plains, and parts of the Mississippi Valley, northern New England, Mid-Atlantic coast, and Puerto Rico, with moderate to exceptional drought covering about 54.8 percent of the CONUS (45.8 percent of the 50 States and Puerto Rico) according to U.S. Drought Monitor (USDM) statistics. The drought area expanded then slightly contracted then expanded again through a few such cycles throughout the year, reaching a minimum area of 44.0% of the CONUS (37.0% of the 50 States and Puerto Rico) on September 6 and a maximum of 63.0% of the CONUS (52.7% of the 50 States and Puerto Rico) on October 25. Drought touched every state at some point in 2022. The areas least affected by drought included the interior Northeast to central Appalachians, parts of the Great Lakes, and much of Alaska.
Drought in Hawaii during December 2021 ended by the beginning of January 2022, but dry conditions during January brought a rapid and expansive return of drought by the beginning of February; the drought area persisted at varying extents throughout the year. A wet December 2021 across much of the western CONUS was followed by very dry conditions for the rest of the 2021-2022 winter and into the spring. Wet conditions returned to the Pacific Northwest in April but continued across southern parts of the West throughout the spring. Summer monsoon rains brought short-term drought relief to the Southwest during the summer into the fall, while dry conditions returned to the Pacific Northwest. January-March was mostly dry for much of the Great Plains. Southern New England experienced dry conditions alternating with wet weather early in the year, with dry weather returning in May and persisting through August. The Southeast coast was hit with dryness in February-March and June. April brought wet conditions to the northern Plains (and much of the northern tier states) and dry conditions to the central to southern Plains. Dryness stayed in the southern Plains through July and was accompanied by a severe heat wave. Unusually hot conditions extended into the Pacific Northwest during July, beginning a heat wave that lasted through October, accompanied by very dry conditions and dozens of large wildfires. Much of the Great Plains and Mississippi Valley was parched in September and October. This convergence of drought resulted in the lowest water levels in a decade of the Mississippi River near Memphis, Tennessee and Vicksburg, Mississippi, closing off a vital channel to barge traffic at a crucial time of the year for transport of crops from the nation's heartland. Flash drought caused by the heat and dryness during the summer in America's breadbasket dried soils and significantly impacted agricultural production. At the end of October, 35% of the nation's winter wheat crop and 48% of the nation's pasture and rangeland were in poor to very poor condition, and 64% of the nation's topsoil and 66% of the subsoil were short or very short of moisture (dry or very dry). According to the U.S. Department of Agriculture (USDA), the overall U.S. winter wheat condition was the worst it has been in the last 20 years for this early in the season. Precipitation in November and December gave California some drought relief, but it was not enough to make up for several years of deficits. Puerto Rico and the U.S. Virgin Islands began the year in drought. The drought decreased during the spring but returned with a vengeance during the summer. It abruptly ended in September when Hurricane Fiona drenched the islands.
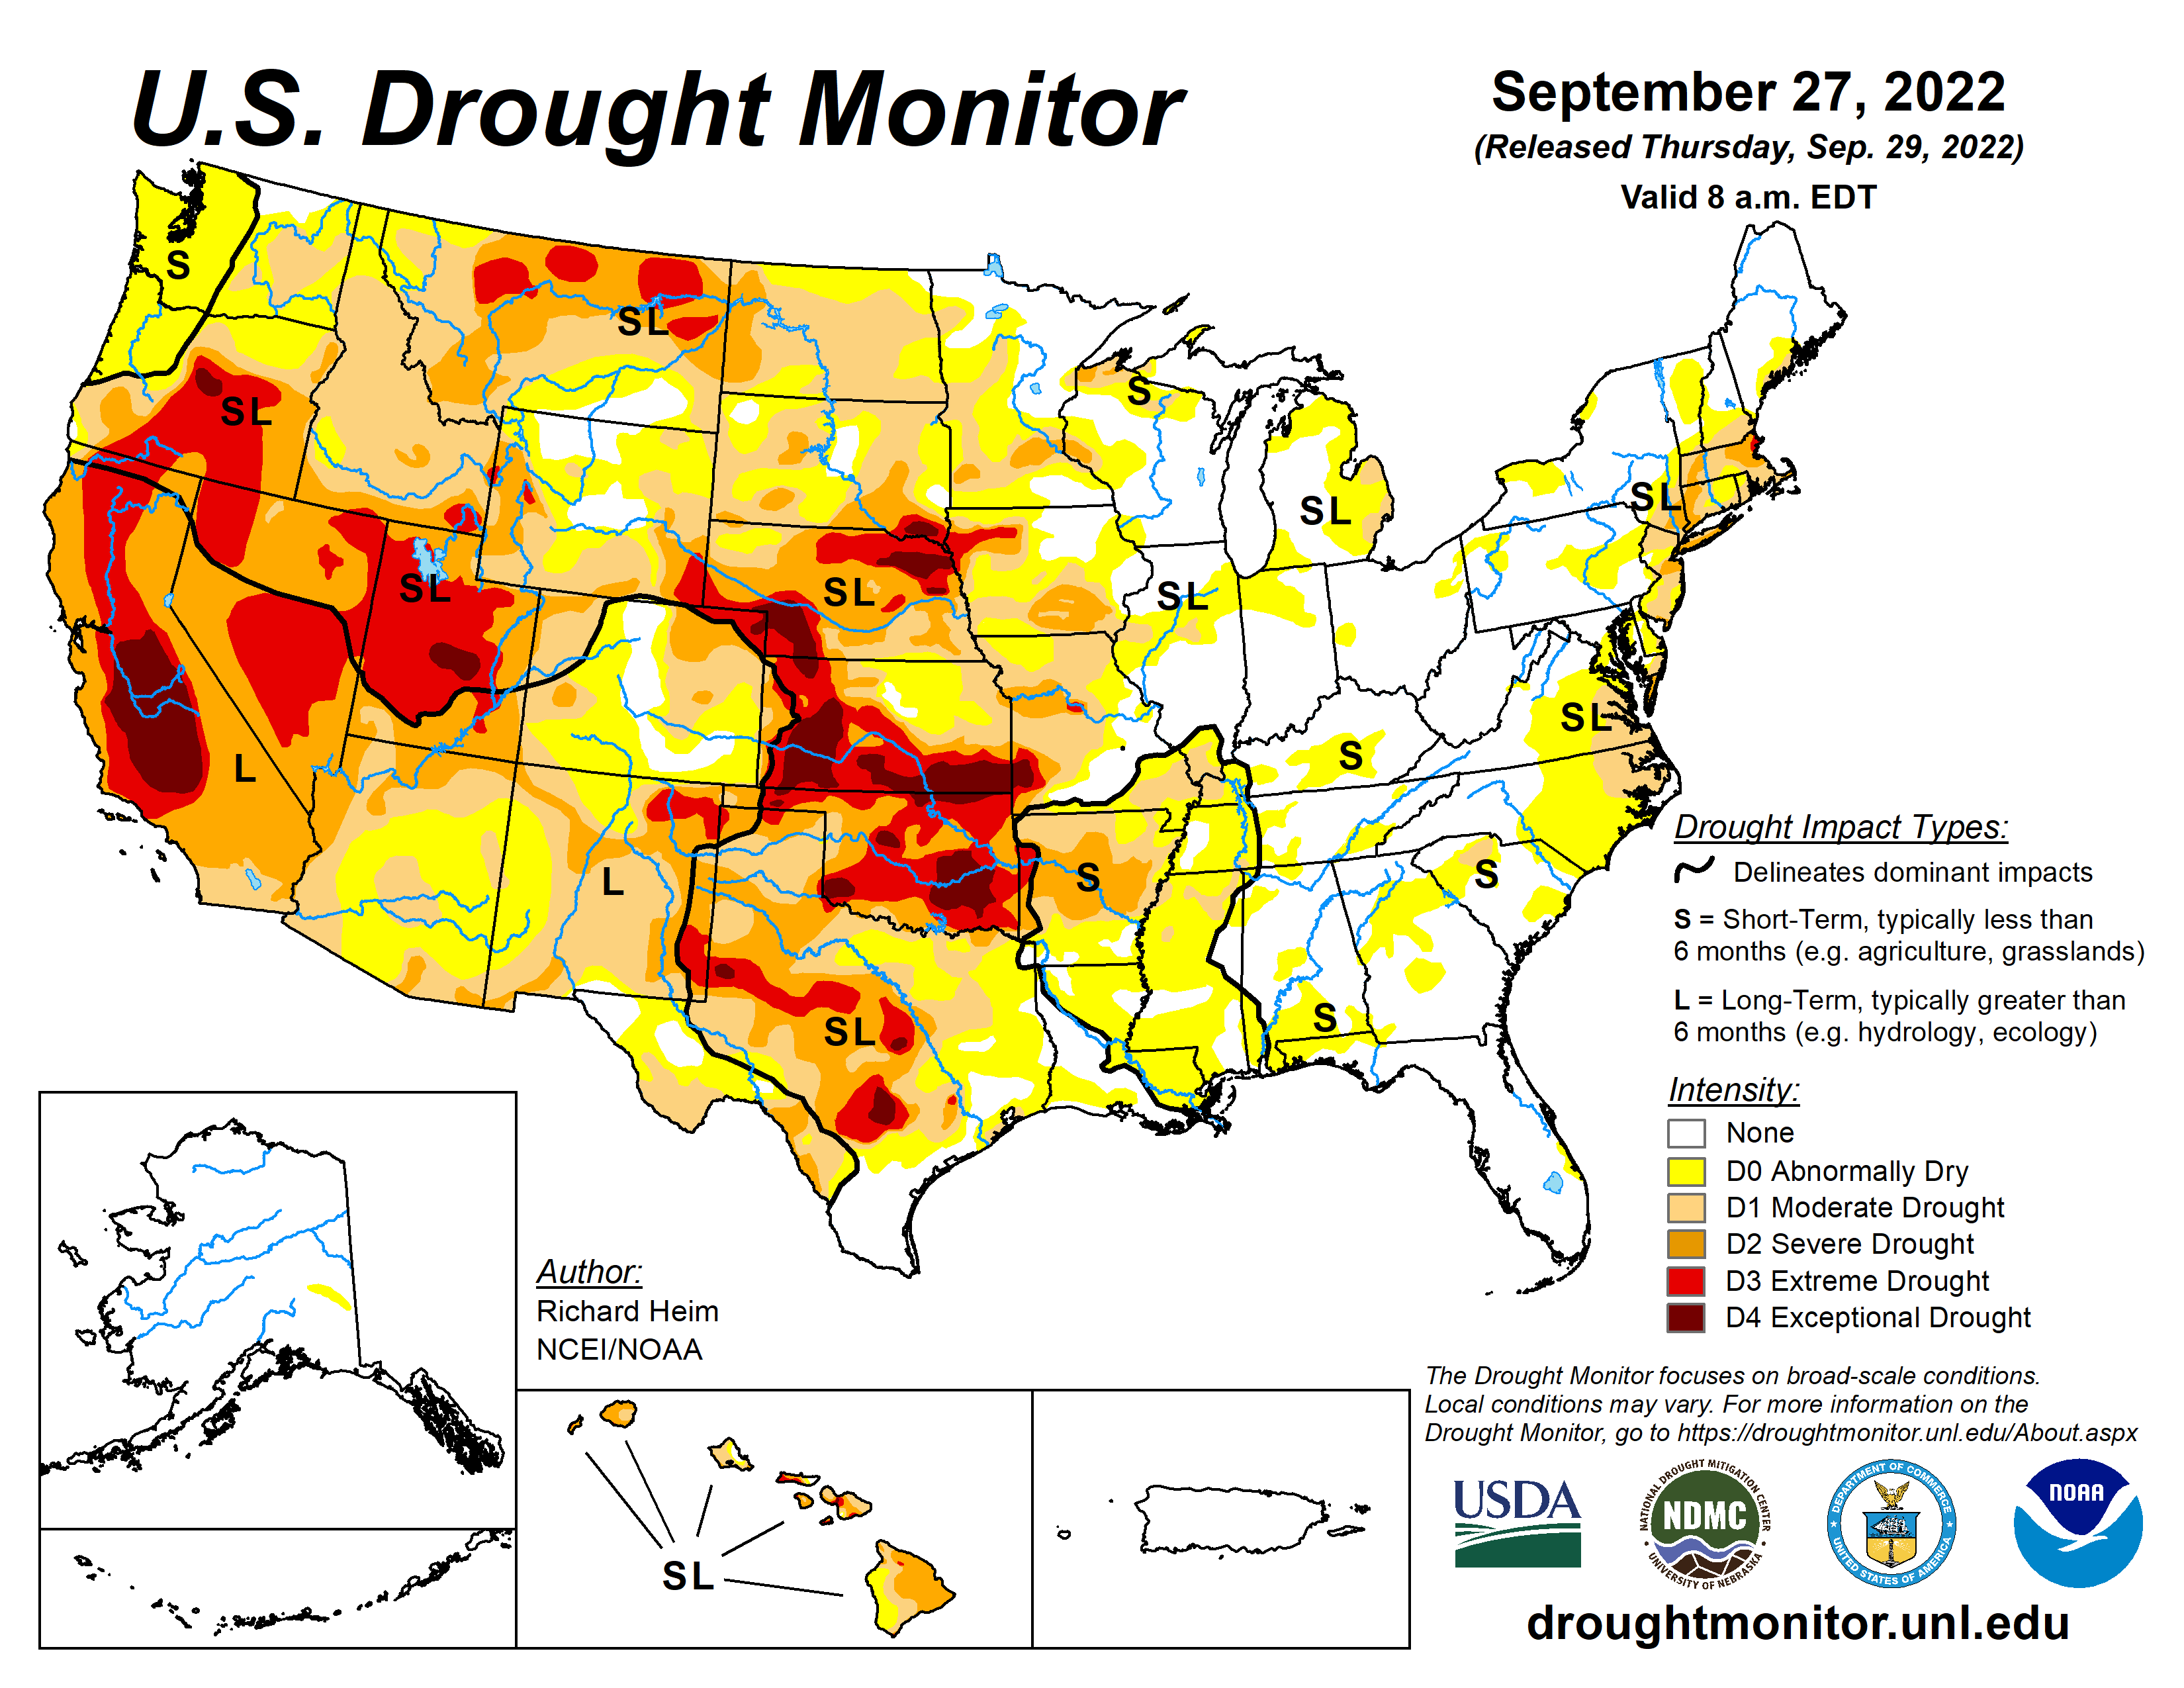
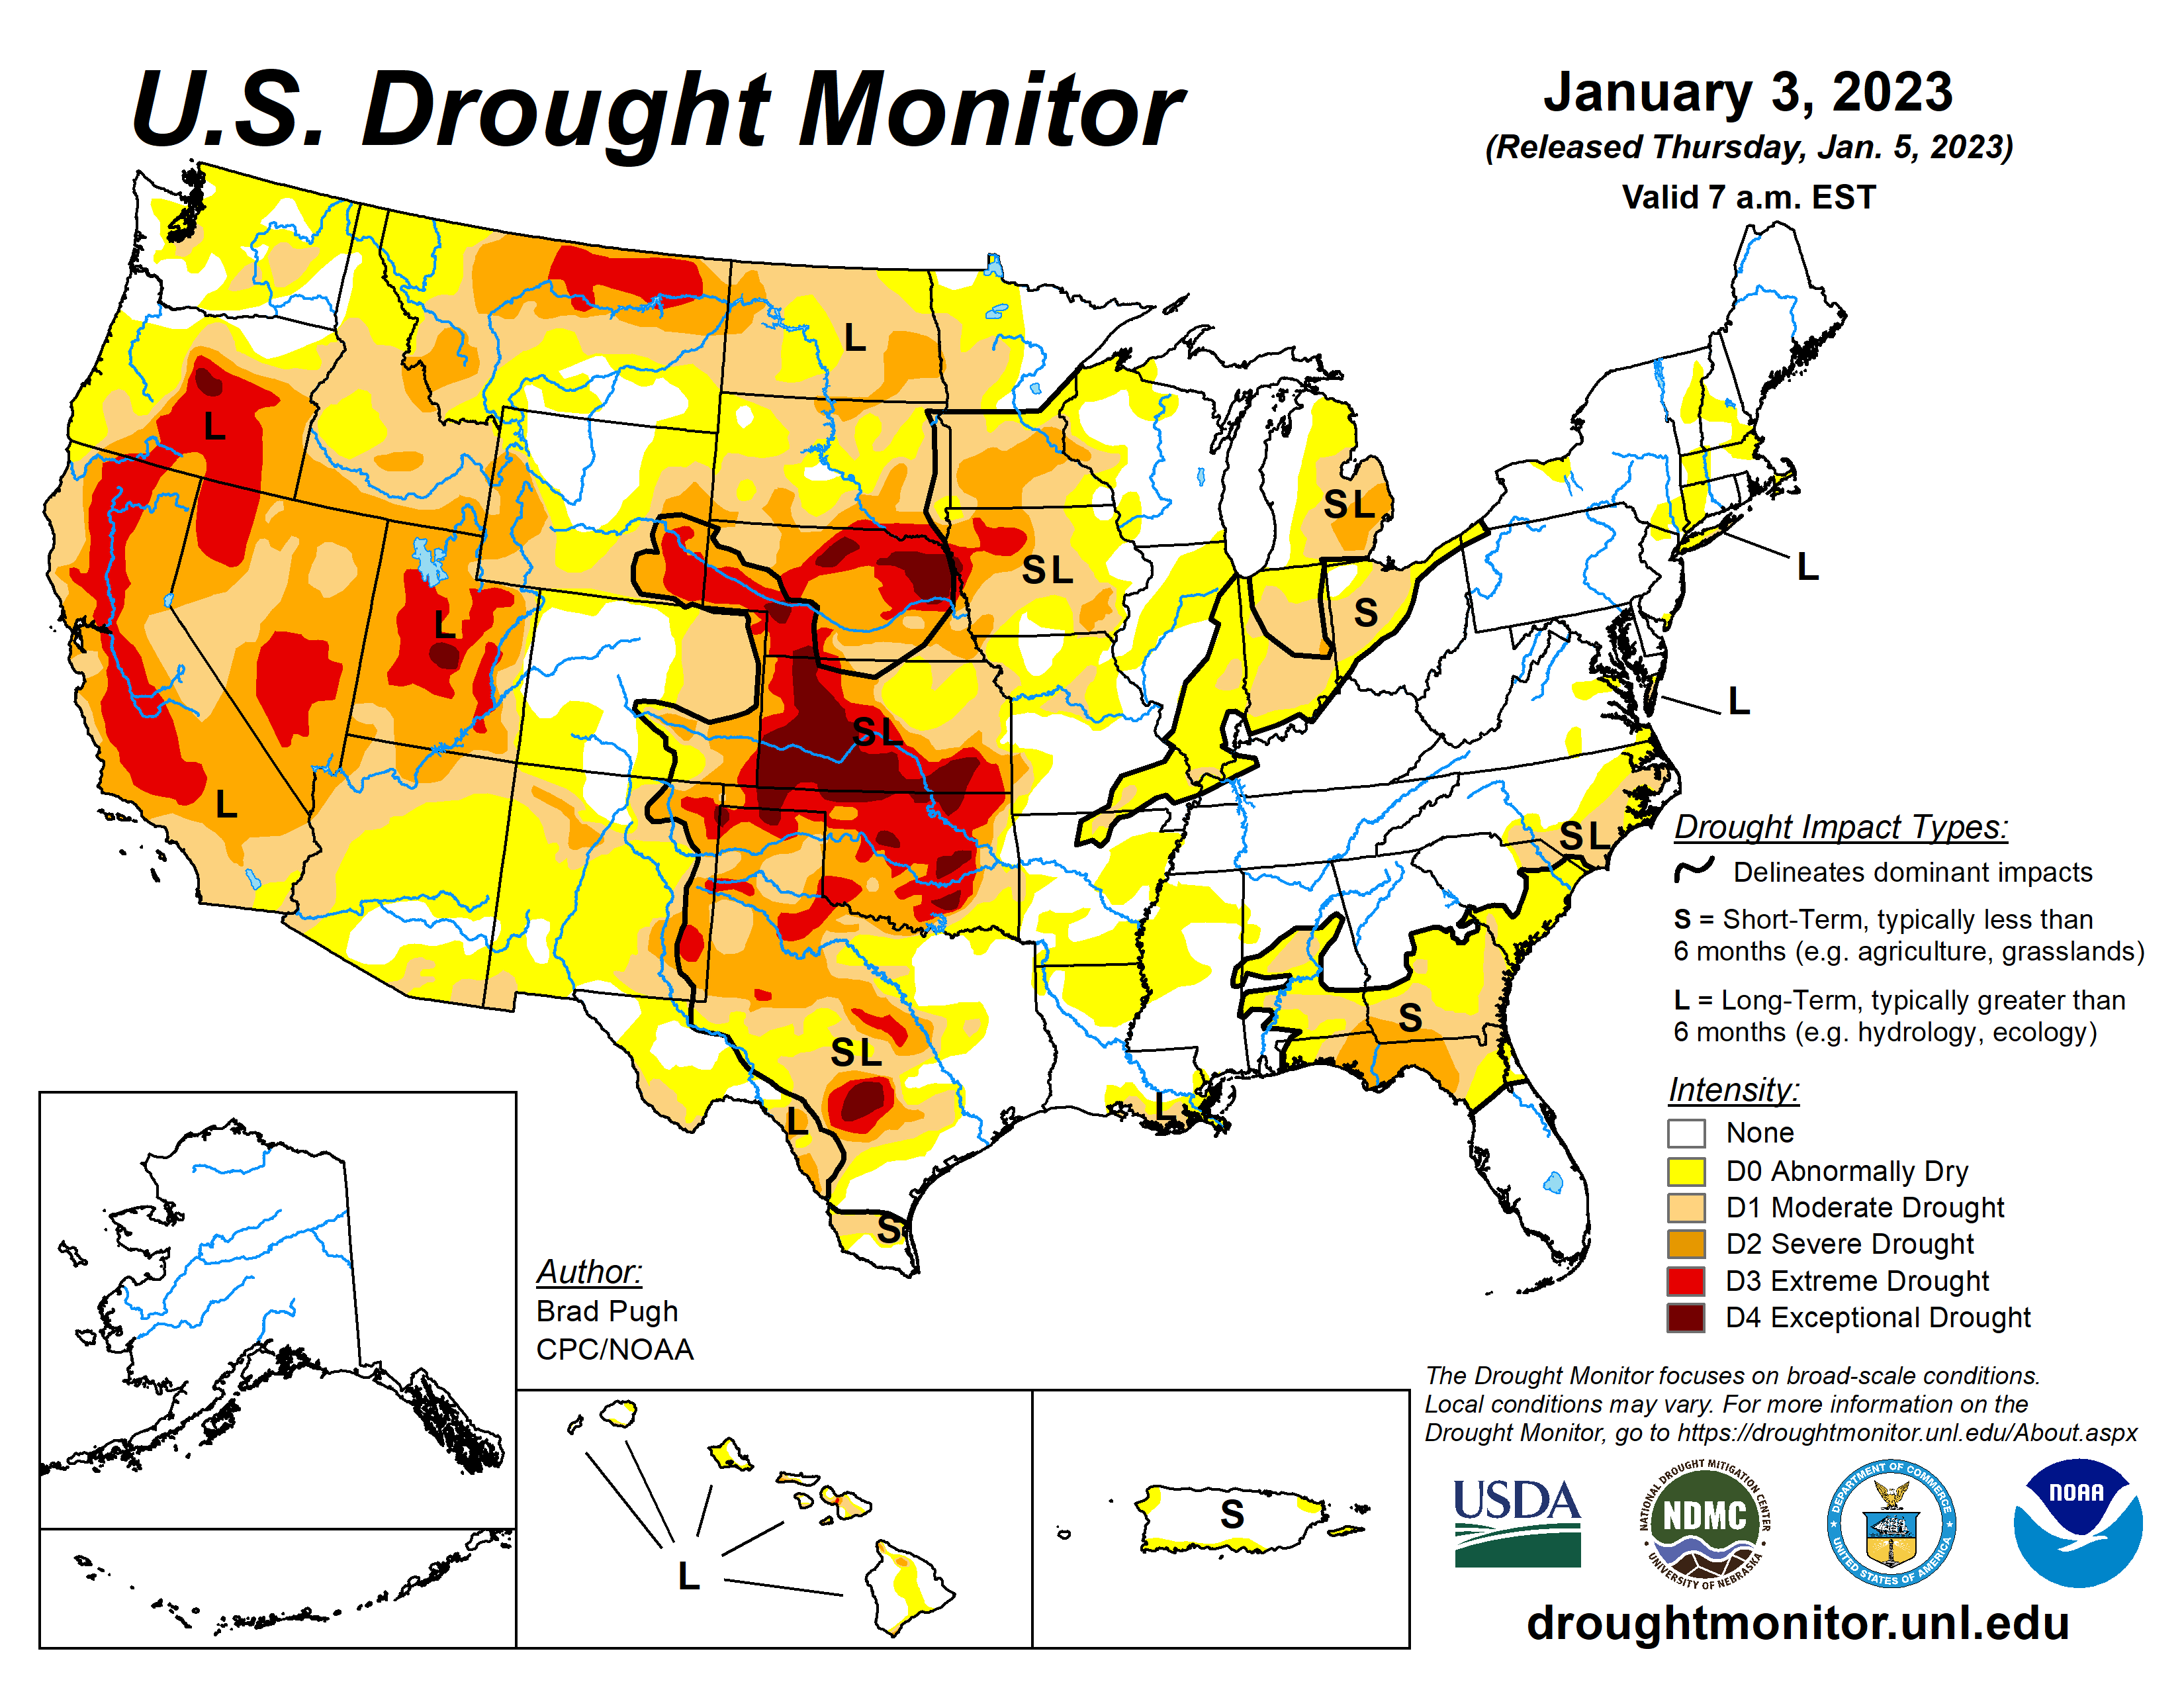
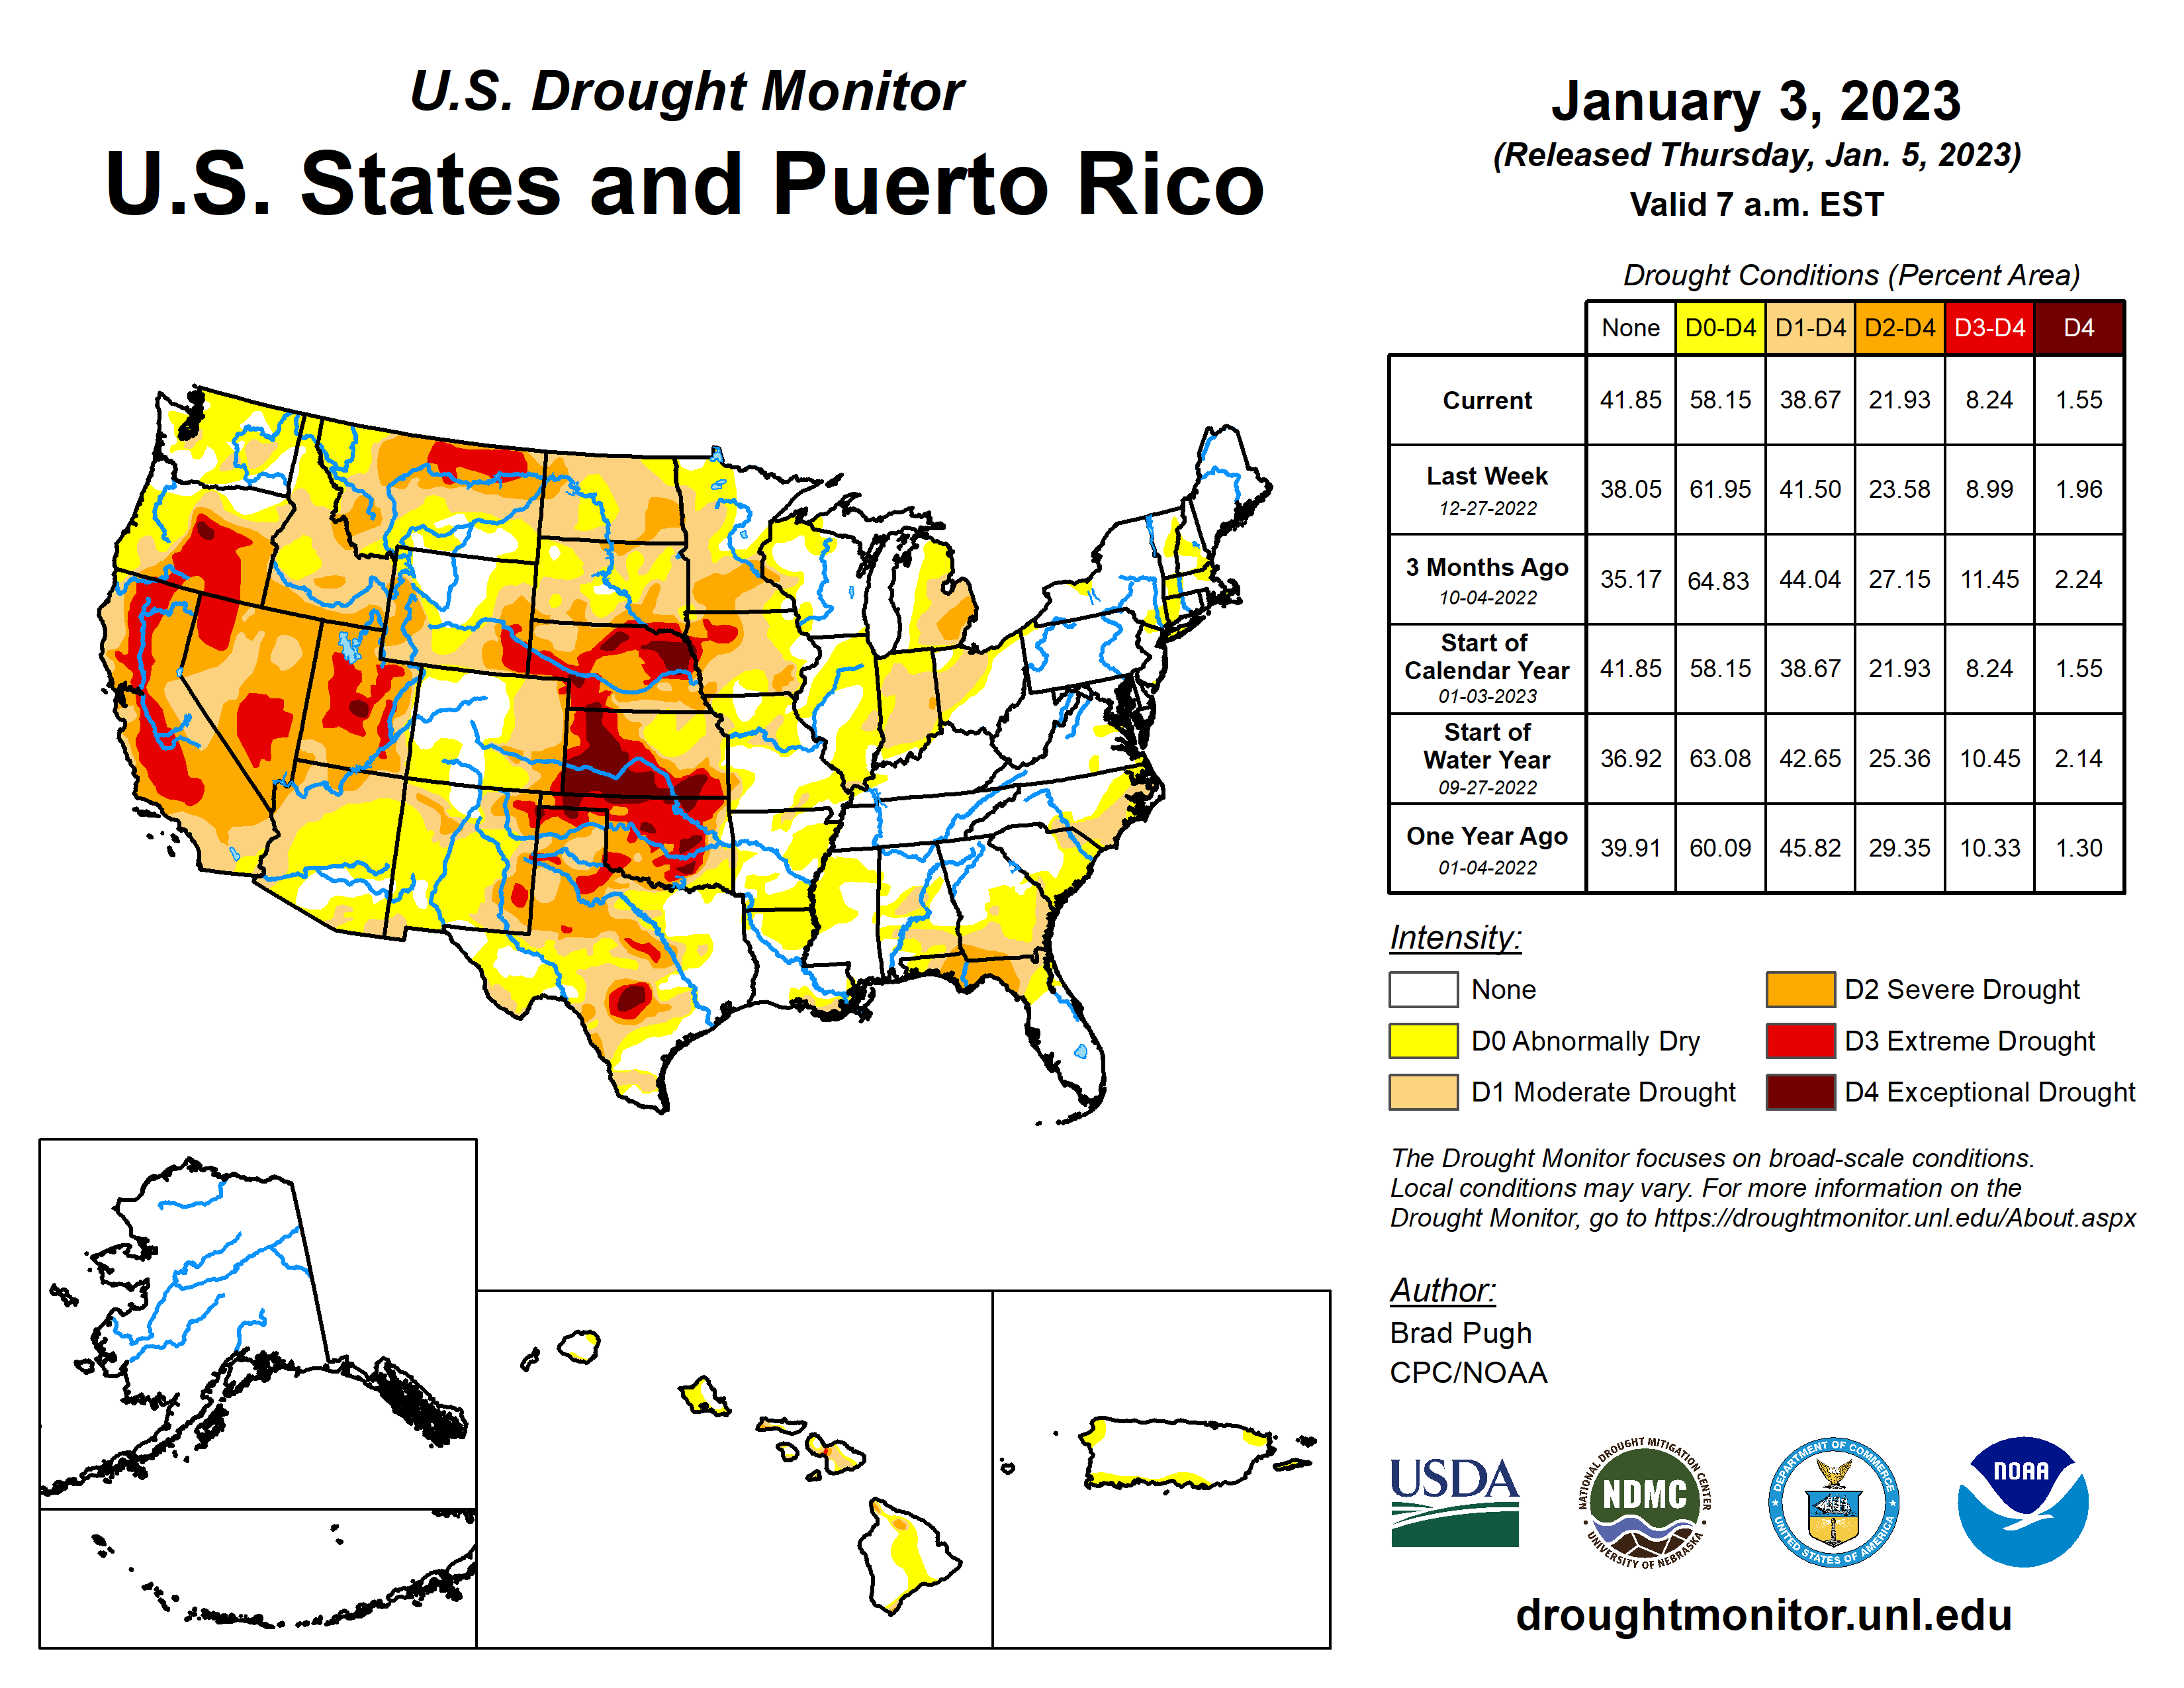
The year ended (based on the USDM map for January 3, 2023) with a little less than half of the CONUS in drought (46.3% of the CONUS and 38.7% of the U.S. including Puerto Rico). The October 25 maximum was the largest CONUS drought footprint since the drought of 2012. If abnormal dryness and drought are considered, the CONUS experienced the largest extent of abnormal dryness and drought (85.3%) on November 1, which is a record in the 23-year USDM history. The previous record was 80.8% on July 17, 2012. Forty percent or more of the CONUS has been in drought for the last 119 weeks. This is also a record in the USDM history. The previous record was 68 consecutive weeks (June 2012-October 2013).
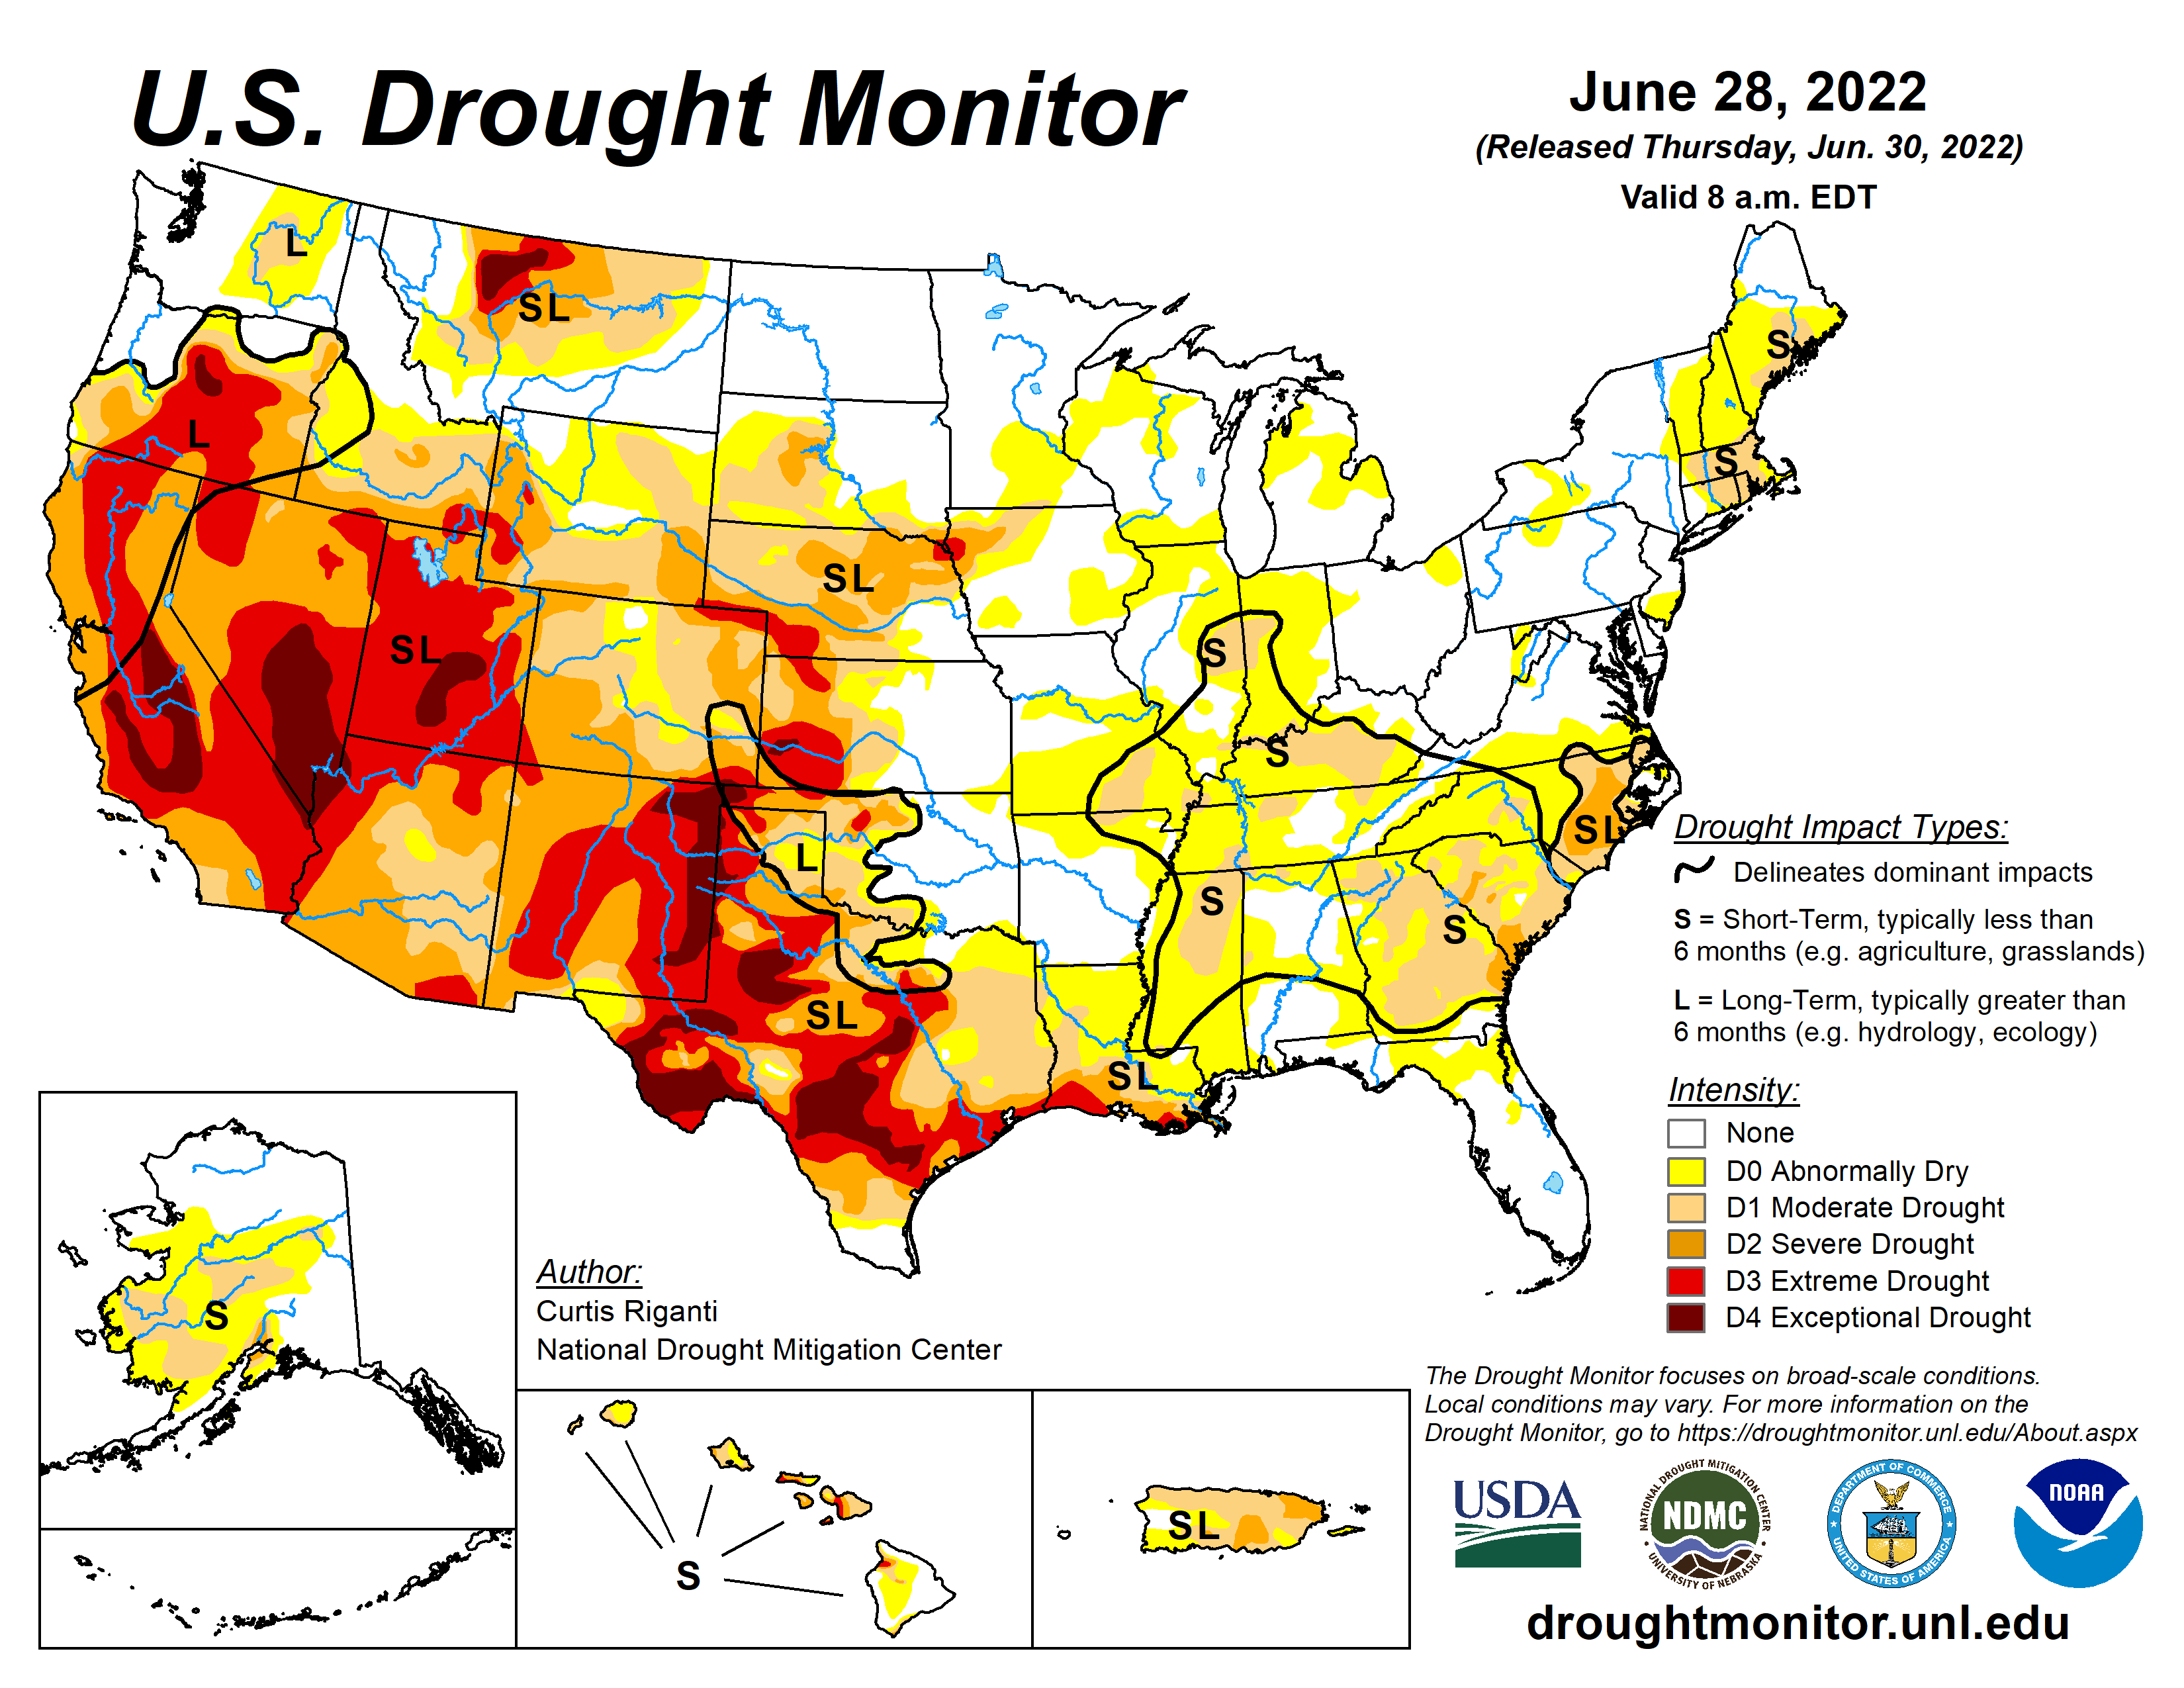
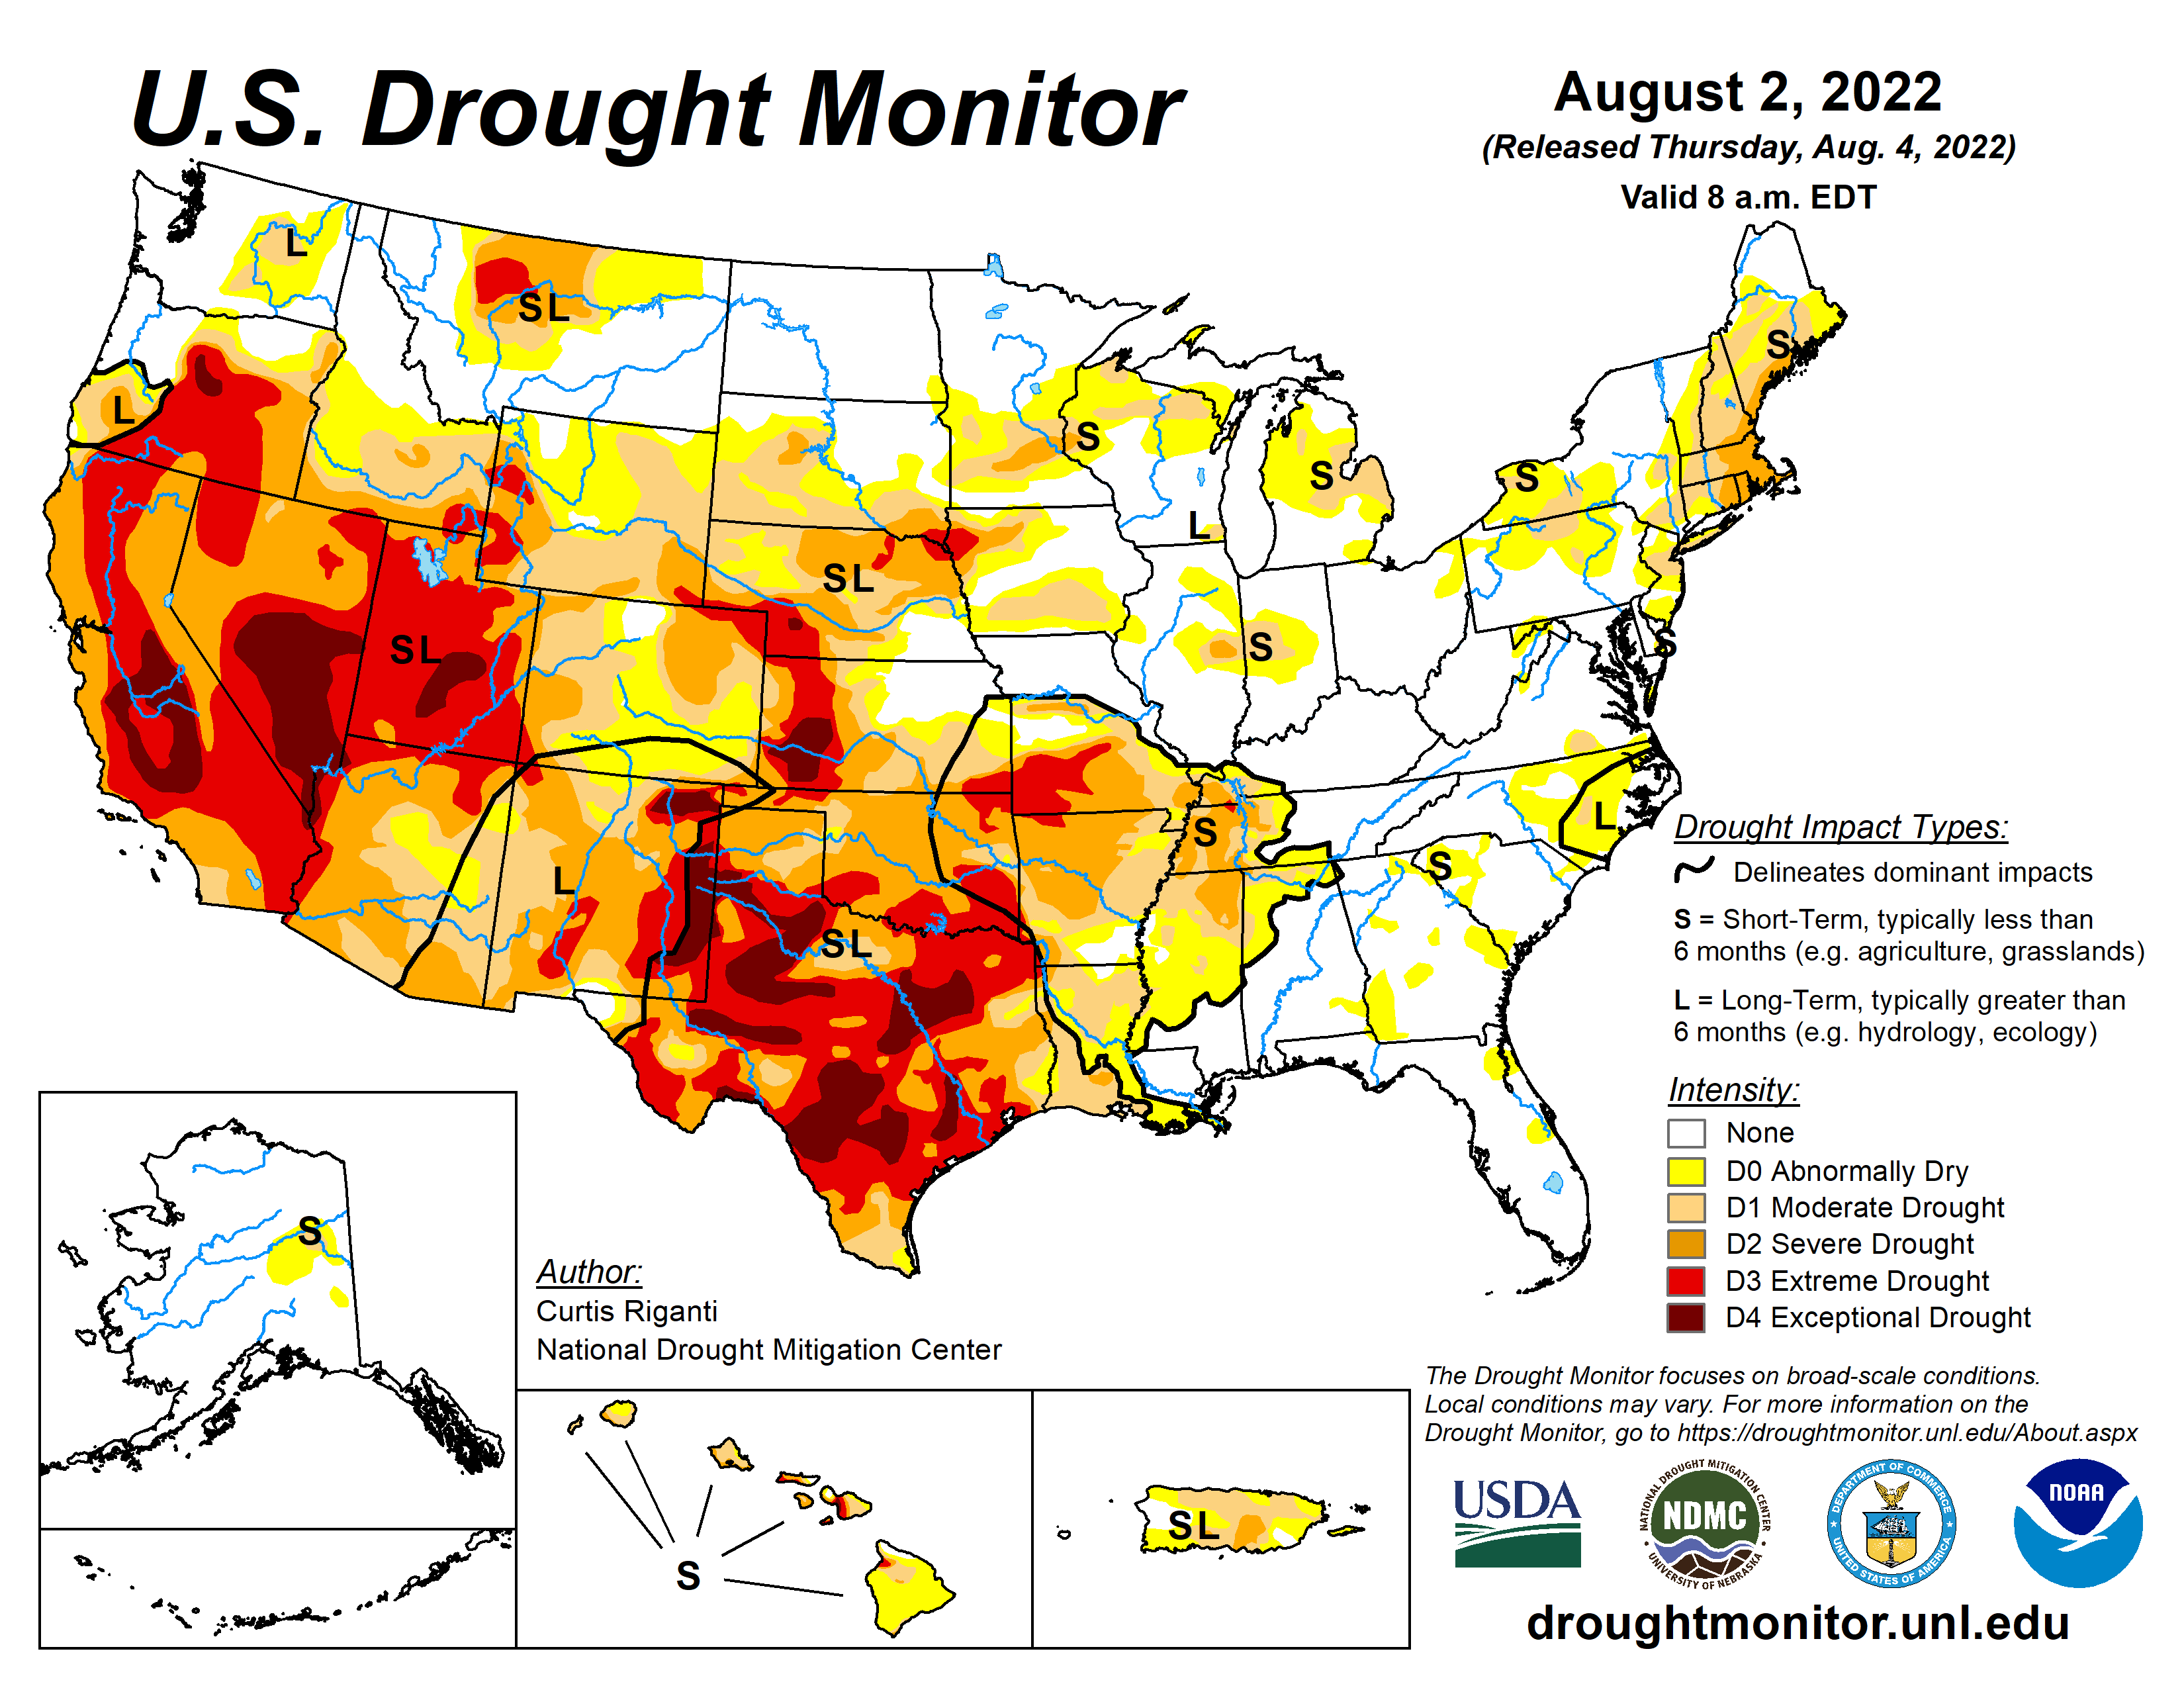
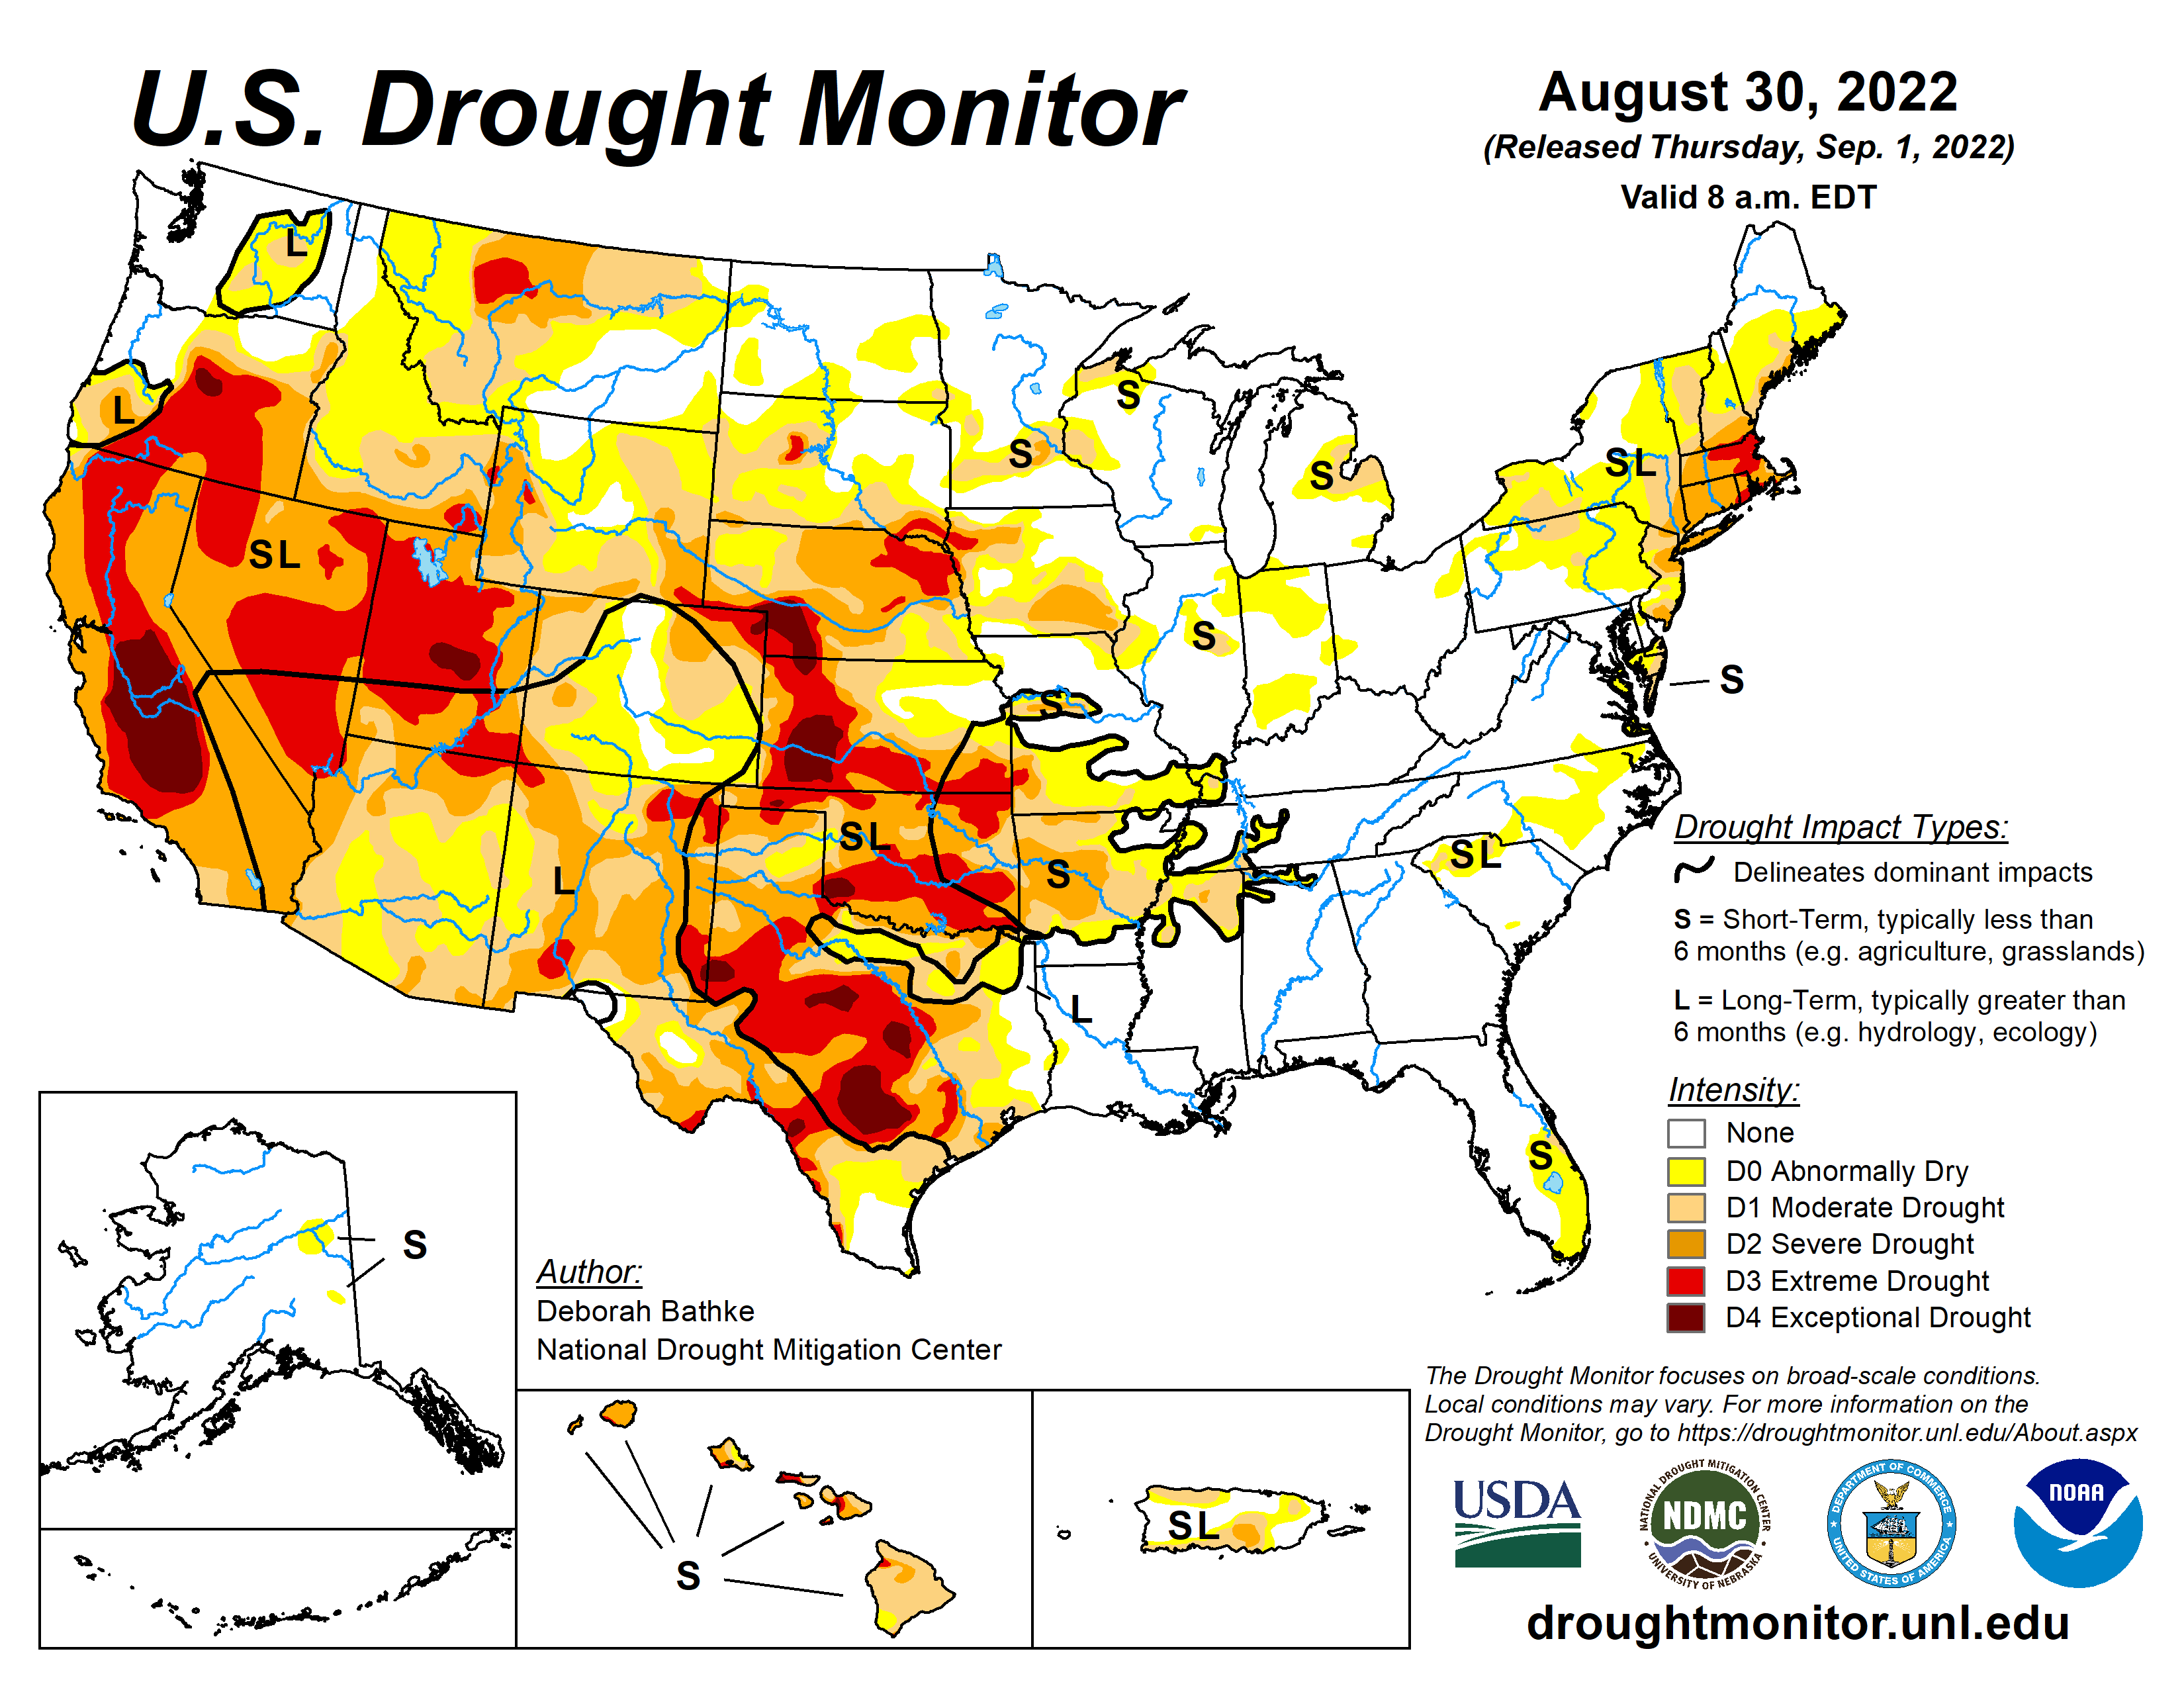
The USDM maps for the end of each month in 2022:

Palmer Drought Index* monthly statistics, which go back to the beginning of the 20th century, indicate that 48.8% of the CONUS was in moderate to extreme drought at the beginning of 2022 (end of January). Like the USDM statistics, the Palmer percentage experienced ups and downs throughout the year, reaching a peak of 52.1% at the end of March and ending the year at 21.8%.
| Month | USDM CONUS |
USDM all of US |
Palmer CONUS |
Very Dry |
Very Warm |
|---|---|---|---|---|---|
| Jan | 55.2 | 46.3 | 48.8 | 16.9 | 3.4 |
| Feb | 59.2 | 49.6 | 51.0 | 22.1 | 1.6 |
| Mar | 58.0 | 48.6 | 52.1 | 14.1 | 12.7 |
| Apr | 53.8 | 45.0 | 47.8 | 17.6 | 9.8 |
| May | 49.3 | 41.4 | 43.3 | 14.7 | 29.4 |
| Jun | 47.7 | 42.5 | 45.3 | 11.9 | 32.8 |
| Jul | 51.4 | 43.2 | 44.2 | 7.9 | 60.2 |
| Aug | 45.5 | 38.2 | 41.4 | 6.6 | 39.9 |
| Sep | 50.9 | 42.7 | 42.5 | 9.2 | 48.0 |
| Oct | 62.8 | 52.5 | 44.8 | 6.5 | 14.7 |
| Nov | 57.5 | 48.1 | 37.6 | 2.8 | 7.6 |
| Dec | 46.3 | 38.7 | 21.8 | 0.2 | 3.8 |
*This drought statistic is based on the Palmer Drought Index, a widely used measure of drought. The Palmer Drought Index uses numerical values derived from weather and climate data to classify moisture conditions throughout the contiguous United States and includes drought categories on a scale from mild to moderate, severe and extreme.
Regional Drought Overview
West Overview
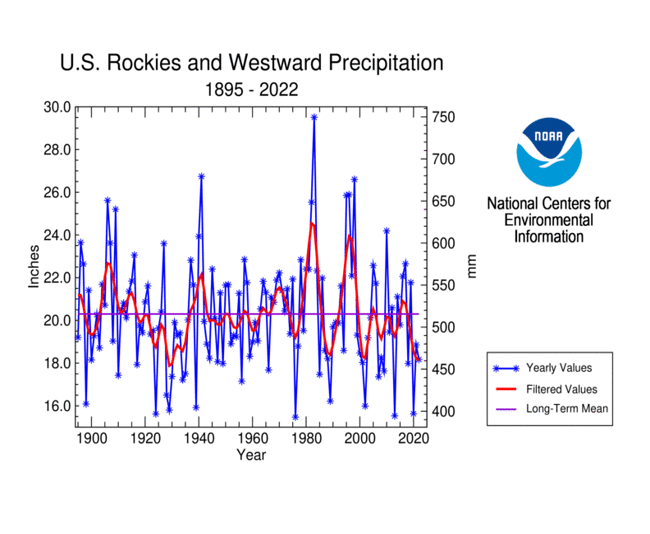
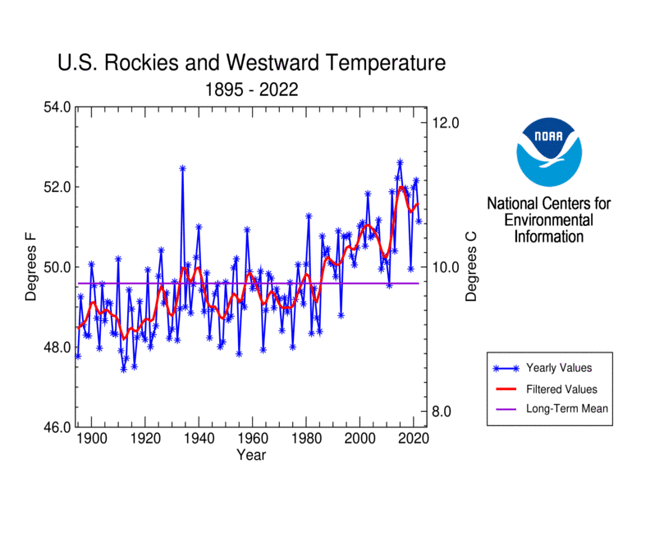
The West (Rocky Mountains to Pacific Coast) has been suffering from a multi-year drought characterized by years with low precipitation and persistent unusual warmth. Half or more of the last 22 years have been drier than the long-term average, with 2013 ranking as the second driest year regionwide in the 1895-2022 record, 2020 ranking as fourth driest, 2002 seventh driest, 2007 13th driest, and 2009 18th driest. Above-normal precipitation in the Pacific Northwest during April-June, summer monsoon rains in the Southwest, and the start of an atmospheric river that fed Pacific weather systems in December improved 2022's rank to 26th driest. The West has experienced a general and persistent increasing trend in temperatures for the last 40 years. Nine of the top ten warmest years have occurred since 2003 and 14 of the warmest 20 years have occurred since 2000. These include 2015 (warmest year in the 128-year record), 2014 (third warmest), 2021 (fourth warmest), and 2020 (fifth warmest). The only year in the top ten category that wasn't from the 21st century was 1934 (second warmest). Colder-than-normal temperatures in the Pacific Northwest in April-May, and across the West in November, weren't enough to keep 2022 out of the top 20 warmest category at 13th warmest.
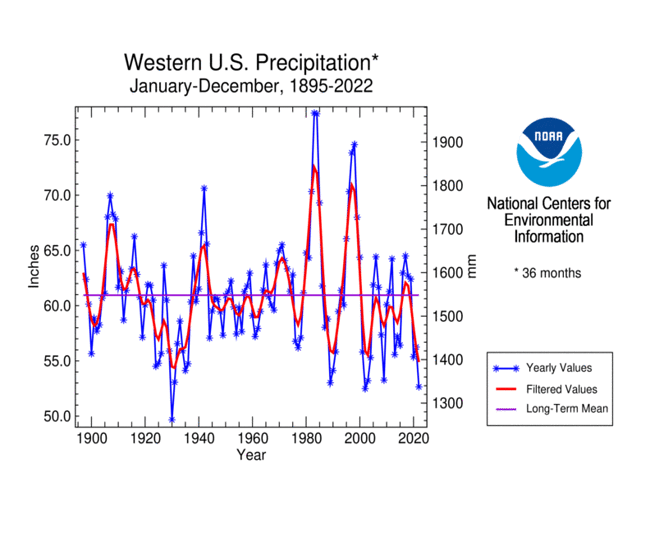
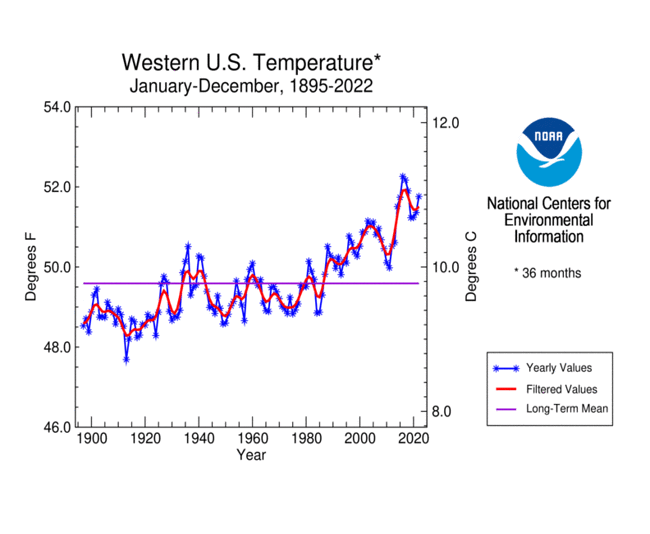
The last 23 years across the West, which have been described by some as a "megadrought", have seen frequent episodes of drought briefly interrupted by wetter spells. The last three years have been a period of persistently dry and hot conditions. Taken together, 2020-2022 ranks as the third driest and fourth warmest such 3-year period in the 1895-2022 historical record, regionwide.
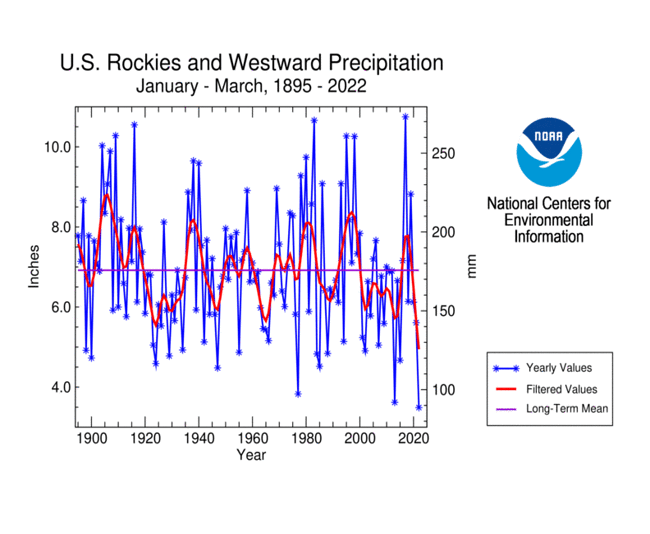
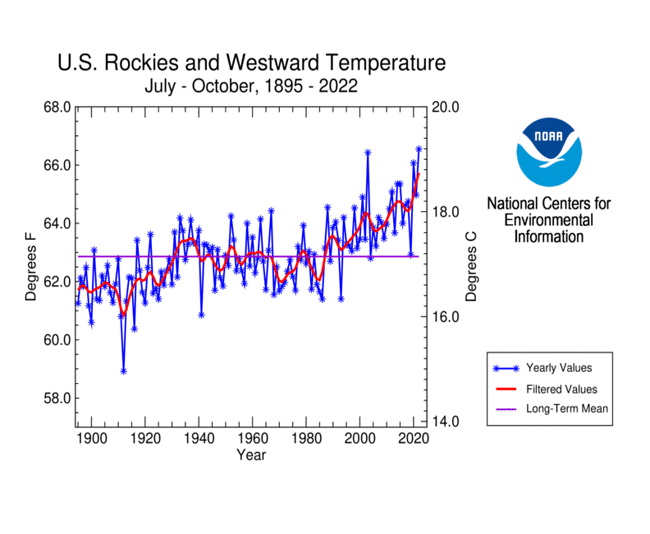
In 2022, the year started out warmer and drier than normal. Regionwide, January ranked as the 21st warmest January and March was the 20th warmest March, but January-March came in as the driest such 3-month period on record. The heat returned in the summer and fall, with July-October ranking as the warmest such 4-month period on record, regionwide. The last three July-October periods have been unusually hot. A wetter-than-normal monsoon season in the Southwest moderated the July-October regionwide precipitation rank.
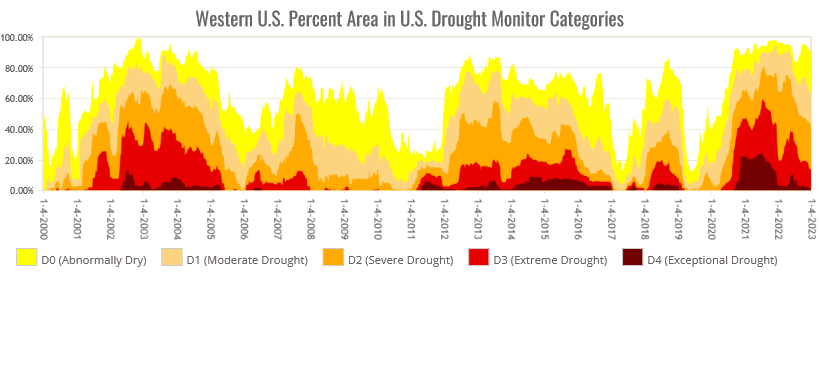
The West (defined here as the 11 western states) ended 2021 with 90.9% of the area covered by moderate to exceptional drought based on the USDM. The most intense areas of extreme to exceptional drought were in the Pacific Northwest to central Montana and from California into the Great Basin. The drought coverage continued at a high level through spring 2022, decreasing during the summer as monsoon rains contracted drought in the Southwest (especially the Four Corners states) and Pacific weather systems shrank drought in the Pacific Northwest. The drought area increased again in the fall before decreasing in November and December as winter weather systems brought above-normal precipitation to much of the West. The maximum drought extent of 91.3% of the region occurred on May 3, while the minimum extent of 62.4% occurred at the end of the year. As 2022 ended, the epicenter of the western drought stretched from California and Oregon to the Great Basin and north central Montana.
Based on the Palmer Drought Index, 2022 began with 59.4% of the West experiencing moderate to extreme drought. The percentage rose to 94.3% by the end of March, but then steadily declined through the summer. The drought area rose slightly to 52.1% in October, then plummeted in November and December as atmospheric river events brought widespread above-normal precipitation. The western drought area reached a 2022 minimum of 8.7% as December ended.
Pacific Northwest
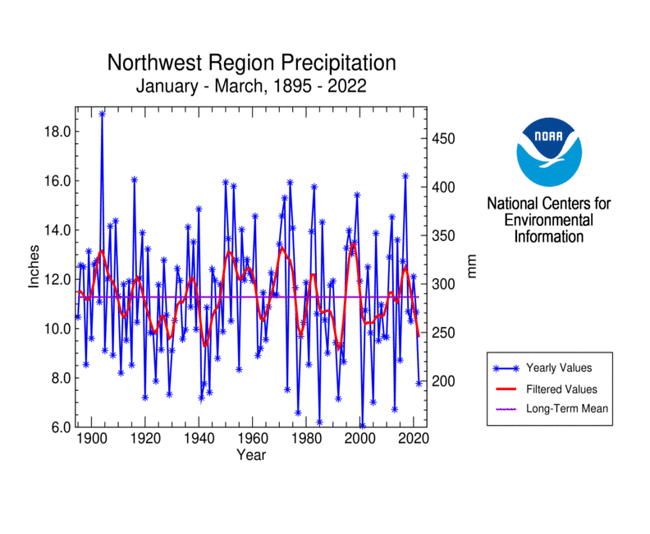
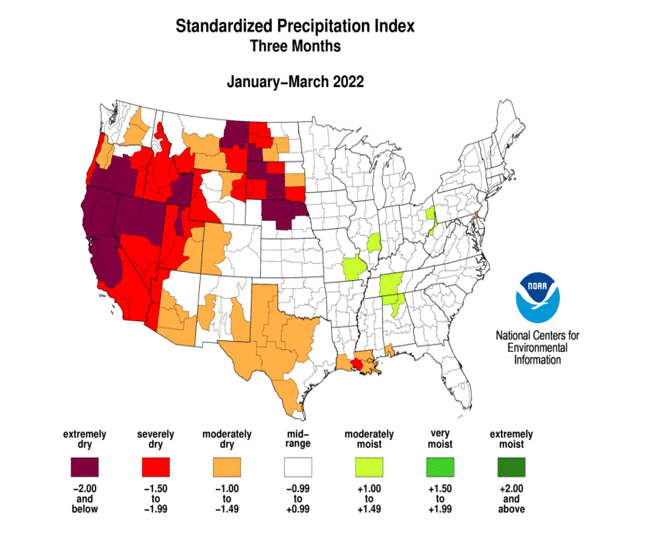
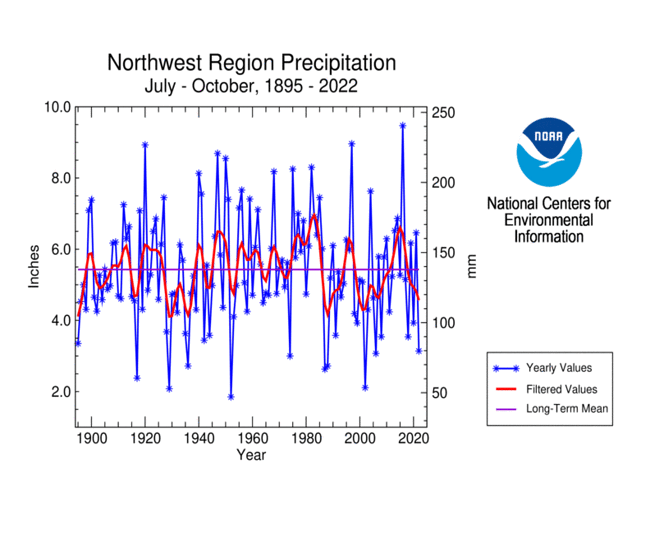

January-March 2022 was very dry for much of the Pacific Northwest, especially the southern portions. The region as a whole had the 13th driest January-March in the 1895-2022 record. Wet conditions dominated during April-June, but dry conditions returned mid-summer. July-October was drier than normal, especially along the coastal areas, with the period ranking tenth driest regionwide. The year began with 76.0% of the region in drought. The drought area decreased to a minimum of 38.0% on August 9, but expanded again to reach a maximum of 82.1% on November 1. Several years of drought have depleted the reservoirs, especially in Oregon, and they continued low during 2022.
California
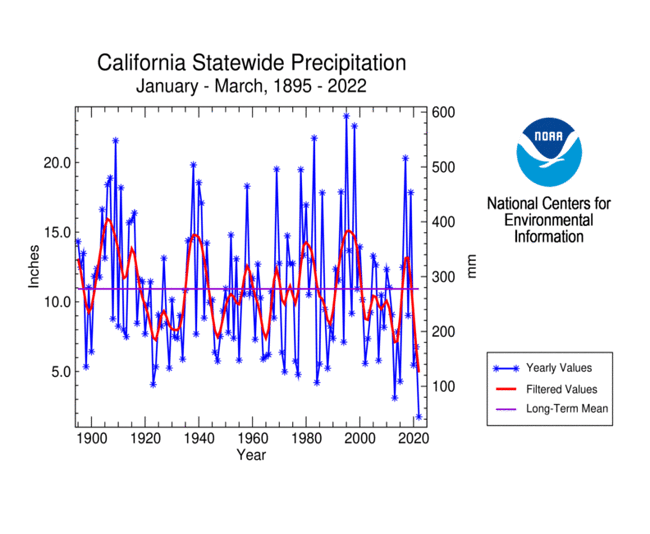
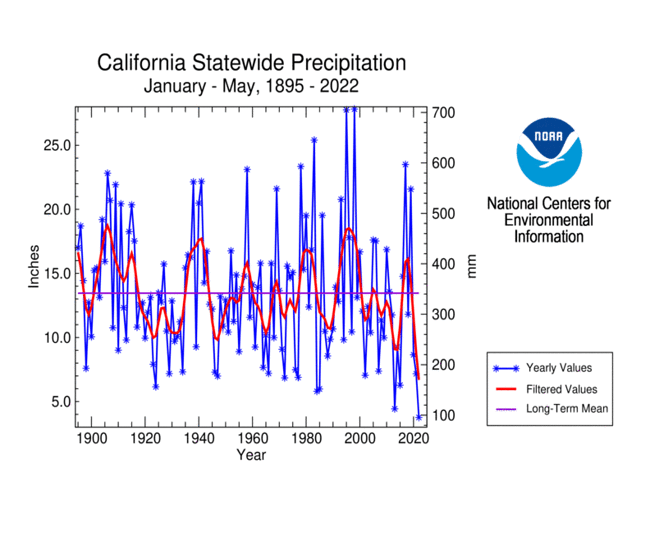
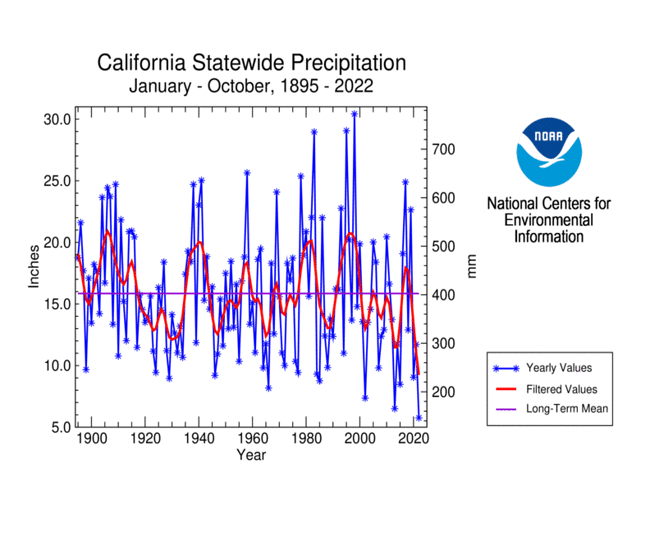
California has been the epicenter of the most recent 3-year western drought. The state ranked driest on record for much of 2022, including driest ever January-March, January-May, and January-October. August and September were wetter than normal, but it was the heavy precipitation in December that got the ranking out of the driest-on-record category. But for the year, California was still in the top ten category at ninth driest. While mountain snowpack was improved, the heavy precipitation of December did little to replenish the state's depleted reservoirs. The state began 2022 with a 99.3% coverage of drought. The drought area expanded to cover the entire state (100%) during spring, but reached a minimum of only 97.9% by the end of the year.
Southwest

The Southwest (Four Corners states) began 2022 on a dry note. Above-normal monsoon rains during the summer contributed to drought contraction, and a very wet December further contracted the drought area. But, while beneficial, this region is still suffering from deficits that have built up over six-plus years of drought.
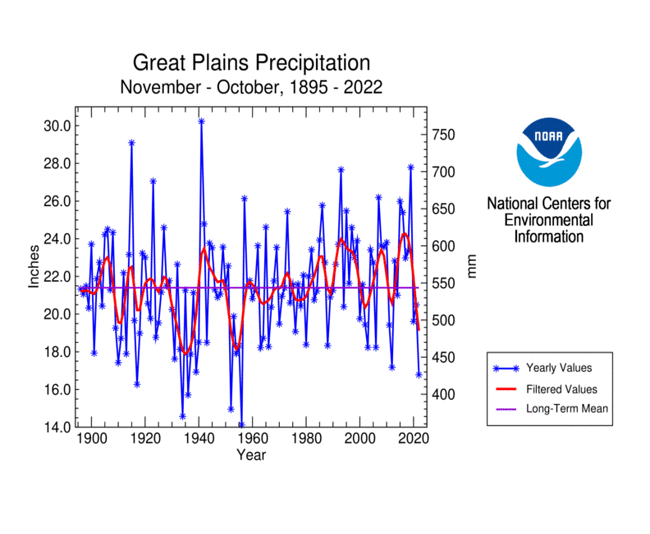
Great Plains Overview
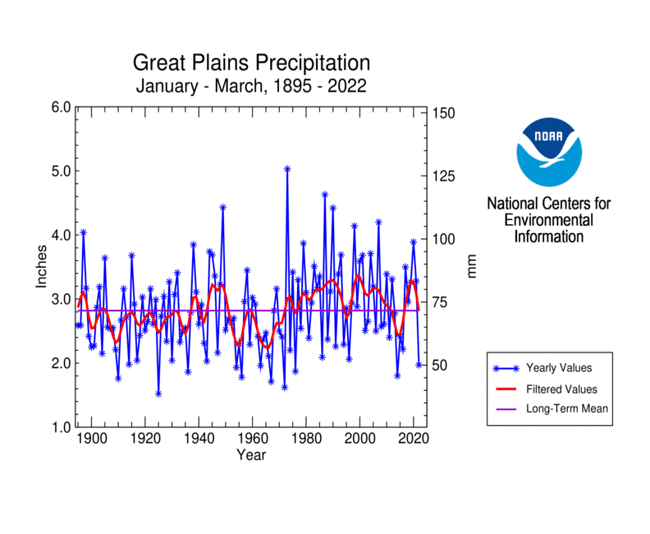
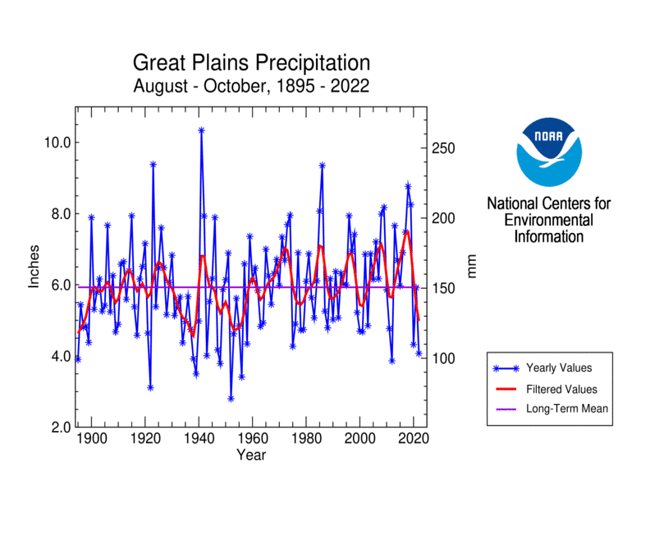
The Great Plains of the U.S. stretches from Montana and North Dakota to Texas. This large region experienced diverse weather anomalies during 2022:
- January, June, and September were dry across much of the region.
- The central Plains were dry during February.
- The northern and southern Plains were dry during March while parts of the central Plains were wet.
- It was wet in the north and dry in the central and southern Plains during April.
- May was wet in the north and central areas and dry across parts of Texas.
- July was wet in the north and dry in the south.
- August and October were wet in the south and dry in the northern and central areas.
- November was dry in the central areas and wet in the north and south.
- Wet conditions dominated the northern half of the Plains in December while parts of the south were dry.
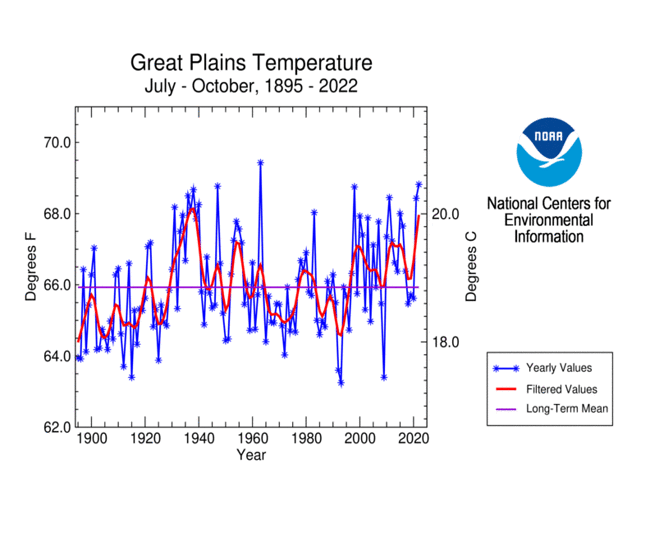
In spite of this diversity, regionwide the Great Plains was generally dry for much of the year. For the region as a whole, January-March ranked 11th driest, August-October was tenth driest, and November 2021-October 2022 came in as the sixth driest such 12-month period. The dry conditions were accompanied by excessive heat, especially during the summer and especially in the south. Regionwide, the Great Plains had the second hottest July-October and fourth hottest May-October.
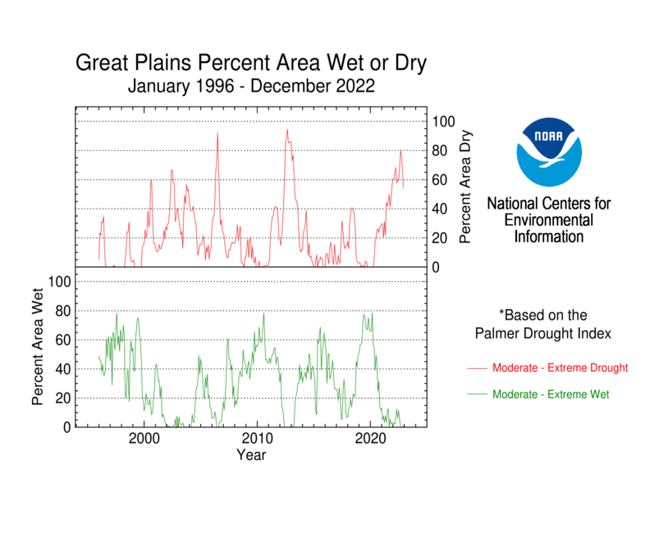
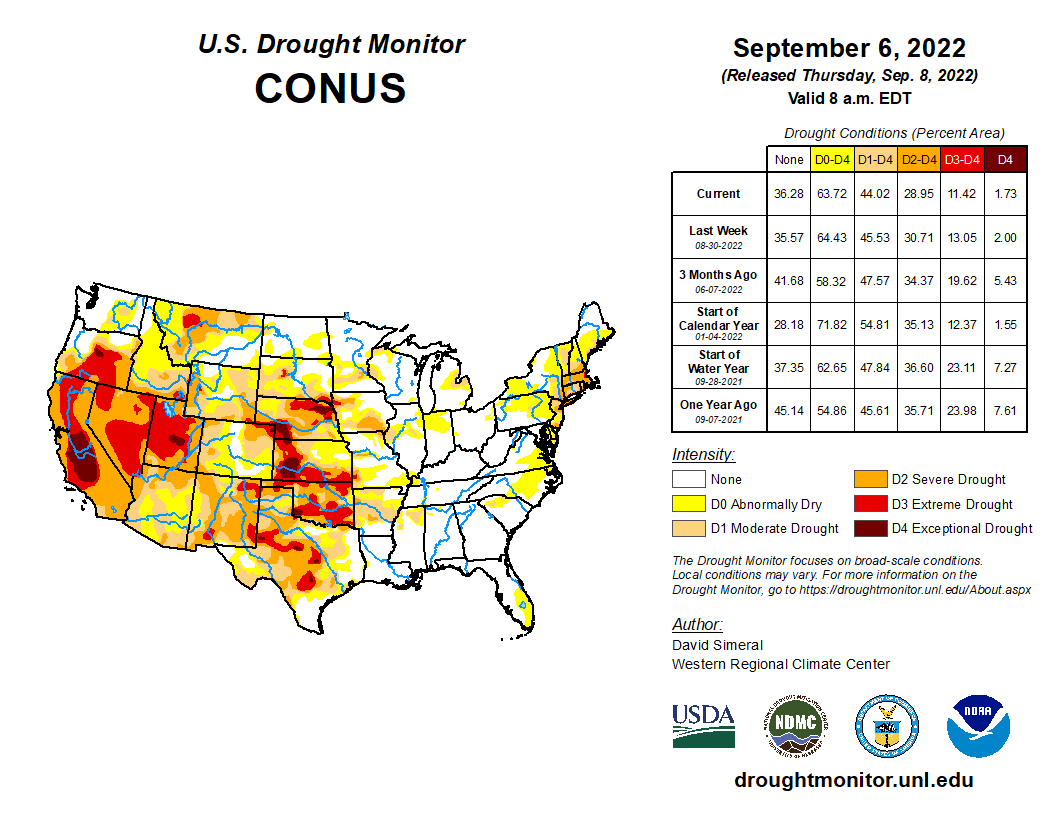
Based on the Palmer Drought Index, the most recent episode of drought in the Great Plains began in the summer of 2020 when over 20% of the region experienced moderate to extreme drought. The drought area expanded to over 40% of the region in 2021 and over 60% at the beginning of 2022. The drought area peaked at about 79.4% of the Great Plains in September 2022 before falling to about 54.4% by the end of December. The 2020-2022 drought episode's maximum extent is comparable to the maximum extent of the 1950s drought, but its duration is much less.
Central Plains
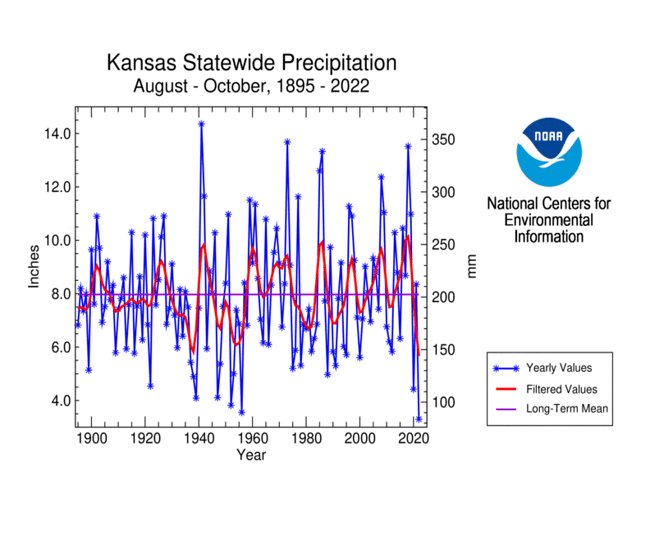
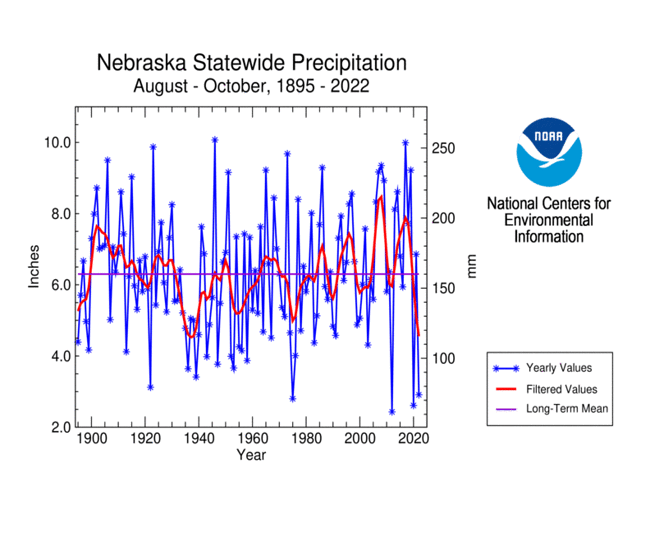
Late summer to early fall were especially dry in the central Plains. Kansas had the driest August-October in the 1895-2022 record and Nebraska ranked fourth driest for this period.
Southern Plains

Drought gained a major foothold in the southern Plains in late 2021, giving the start of 2022 a drought area of 81.7%. The drought area expanded to 90.1% by March 15 before contracting later in the spring. Hot and dry conditions during the summer led to rapid expansion, with the drought area peaking at 97.5% of the region on July 26. Beneficial rains in August and during the fall into early winter led to contraction of the drought area to a minimum of 60.1% as the year ended.
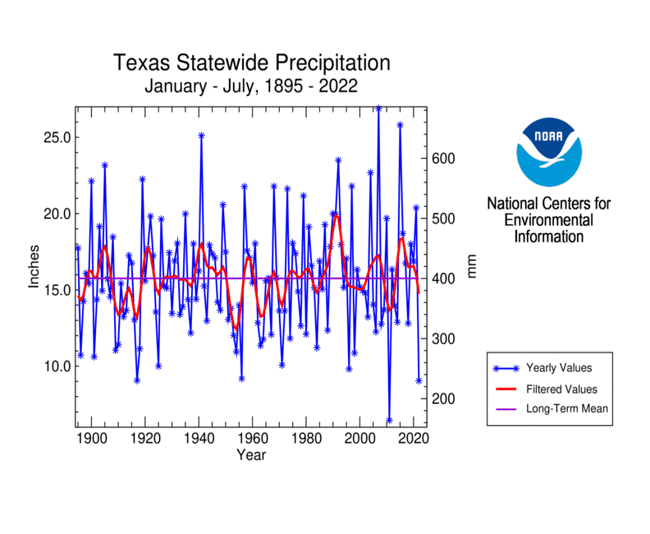
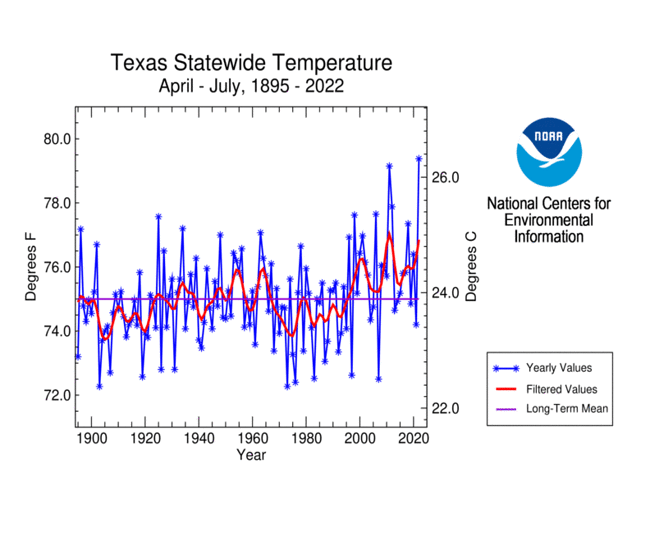
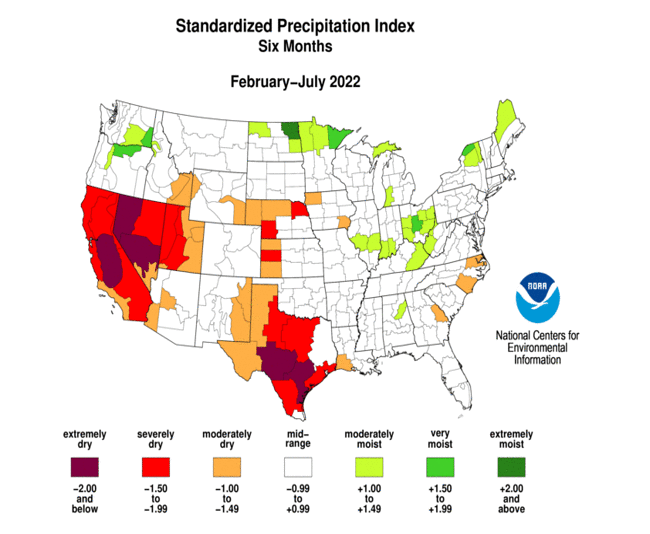
Texas was the epicenter of drought and heat in the southern Plains during 2022. The state had the second driest January-July and hottest April-July and May-July. The year began with 79.8% of the state in moderate to severe drought. The drought area peaked at 91.2% on March 15 before contracting slightly then peaking again at 97.4% of the state in moderate to exceptional drought on July 26. The year ended with 48.6% of the state in drought.
Mississippi River Basin
The Mississippi River experienced the lowest water levels in a decade near Memphis, Tennessee and Vicksburg, Mississippi in October, closing off a vital channel to barge traffic at a crucial time of the year for transport of crops from the nation's heartland. This resulted from the development and intensification of drought in some of the river's tributaries in the summer and fall of 2022 (Ohio and Upper Mississippi basins), and persistence and expansion of a multi-year drought in other of its tributaries (Missouri and Arkansas-White-Red basins).
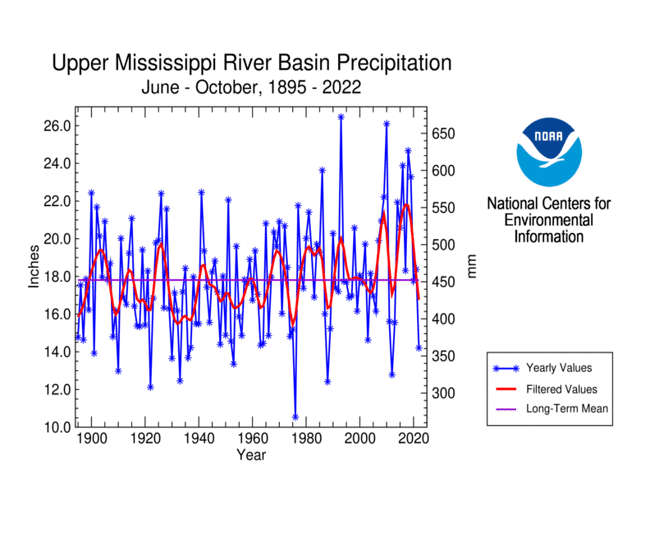
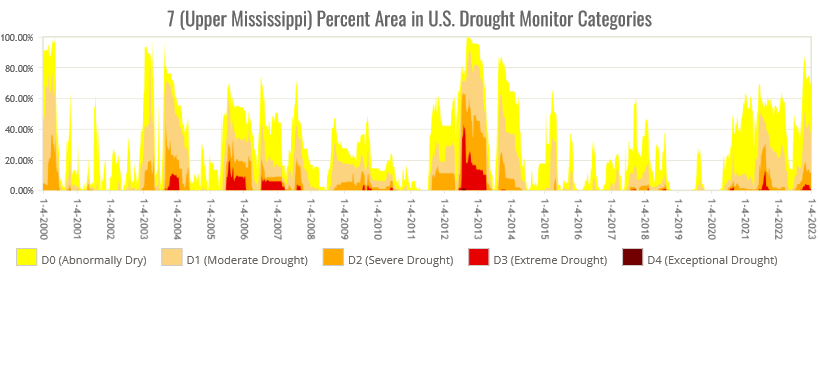
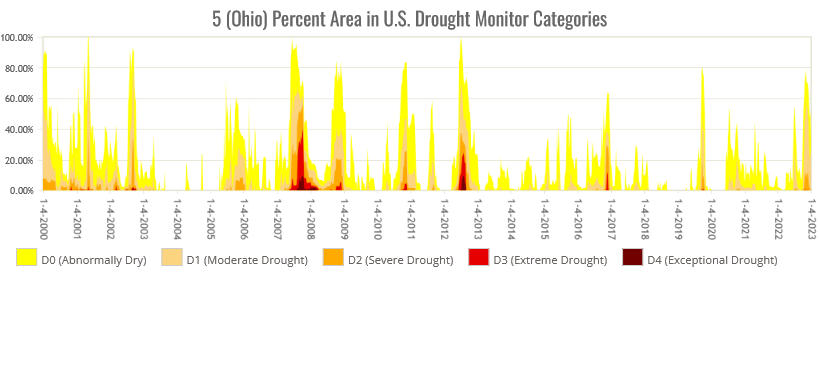
The Ohio River basin was mostly free of drought during 2021 and the first half of 2022. Drought rapidly developed in the fall of 2022 as the basin experienced the 27th driest September-November and 22nd driest September-October. The drought area rapidly grew from less than one percent to 62.0% of the basin by November 8. The year began with drought covering about a fifth of the Upper Mississippi River basin. The drought area decreased to under one percent by spring then gradually expanded again to 16.6% by late summer. During the fall the drought area ballooned to a maximum extent of 51.4% of the basin on October 25. The Upper Mississippi River basin had the 17th driest September-November during 2022, but ninth driest September-October and 11th driest June-October.
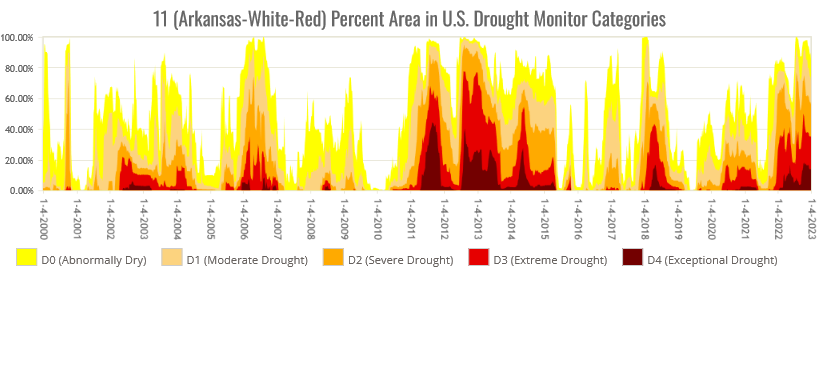
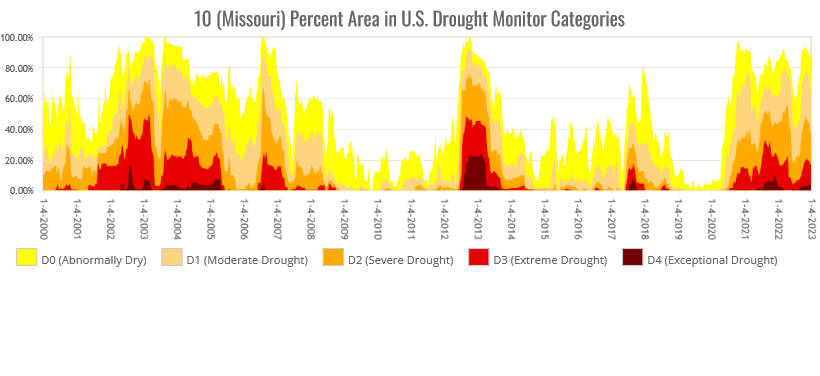
The Arkansas-White-Red River basin has been in drought continuously since late 2019 and began 2022 with drought covering about three-fourths of the basin. The drought area shrank to about 46.6% by the middle of summer, but rapidly expanded again, reaching a peak of 93.9% on July 26, contracting slightly before expanding again to peak at 92.3% on October 25. In 2022, the basin experienced the 13th driest September-October and 12th driest November-October. The Missouri River basin has been in drought continuously since mid-2020 and began 2022 with drought covering about two-thirds of the basin. The drought area grew to 79.0% of the basin by March 15, shrank to about 39.7% by July 5, but expanded again to peak at 78.5% on November 1. In 2022, the Missouri River basin had the eighth driest August-October, sixth driest June-October, and 11th driest November-October. But the persistent dryness over the last three years (November 2019-October 2022) gave the basin the seventh driest such 36-month November-October period on record.
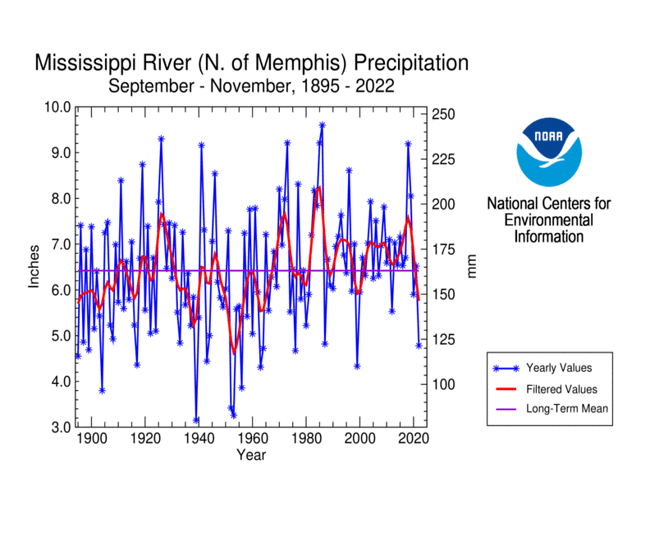

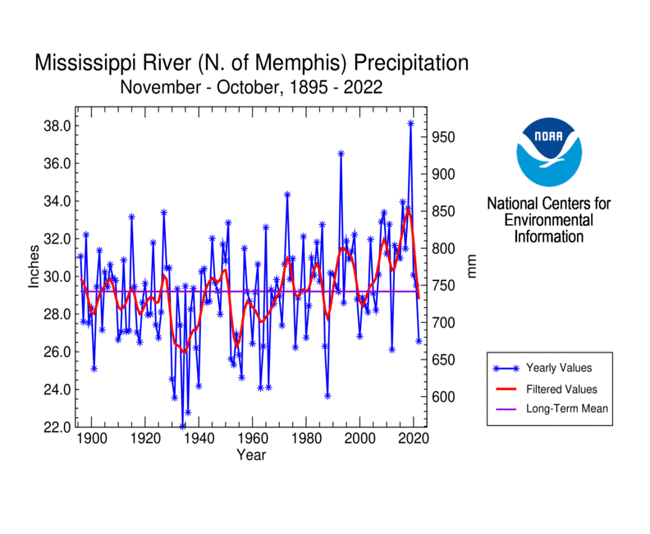
When precipitation is integrated across the Mississippi River basin and its tributaries, 2022 had the 14th driest September-November 3-month period, 26th driest January-October year-to-date period, and 21st driest November-October 12-month period. The November-October data indicate a trend that has been generally increasing over the last 30 years with considerable periodic dips at roughly ten-year intervals.
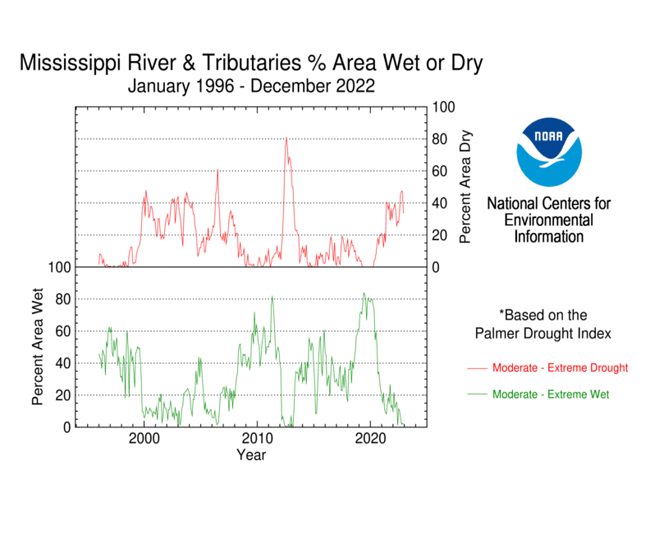
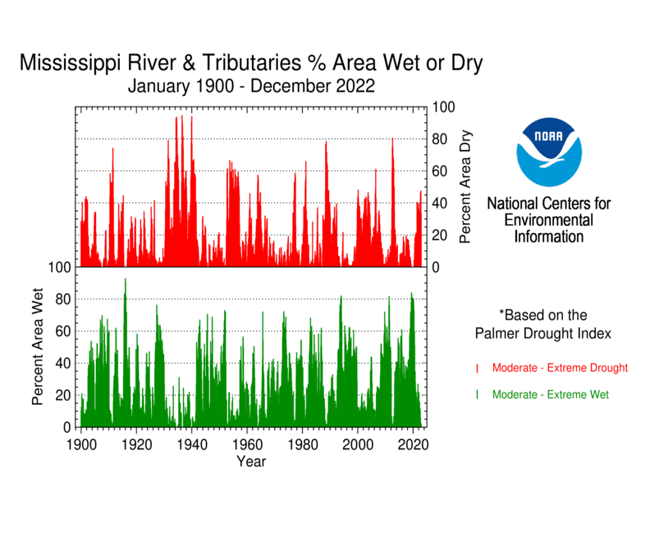
Based on Palmer Drought Index data, parts of the Mississippi River basin and its tributaries have been continuously in drought since summer 2020. A fourth or more of the basin was in drought each month in 2022, with the drought area peaking at 47.4% at the end of November. Historically, the greatest drought area for the basin (about 95%) occurred several times in the 1930s, with other notable peaks occurring in the 1950s, 1988, and 2012.
Northeast
Drought affected parts of the Northeast during 2022. The year began with drought in northern New England and along the Mid-Atlantic coast. Dry conditions during late spring and in the summer led to drought development and expansion across southern New England. Beneficial fall and early winter precipitation virtually eliminated drought from the region by year's end.

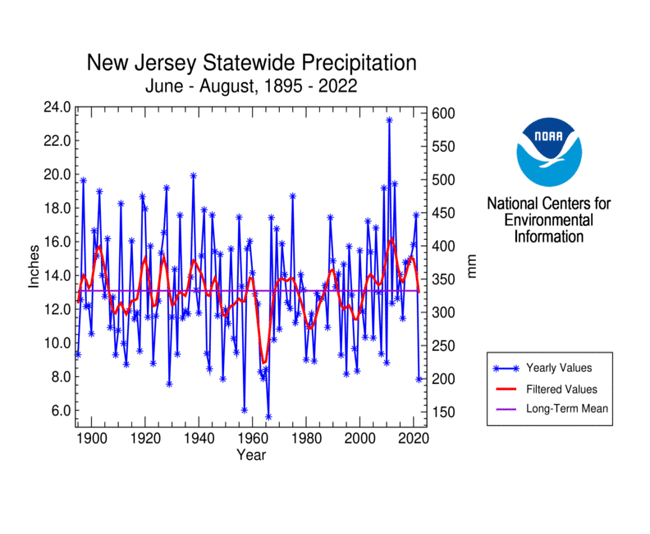
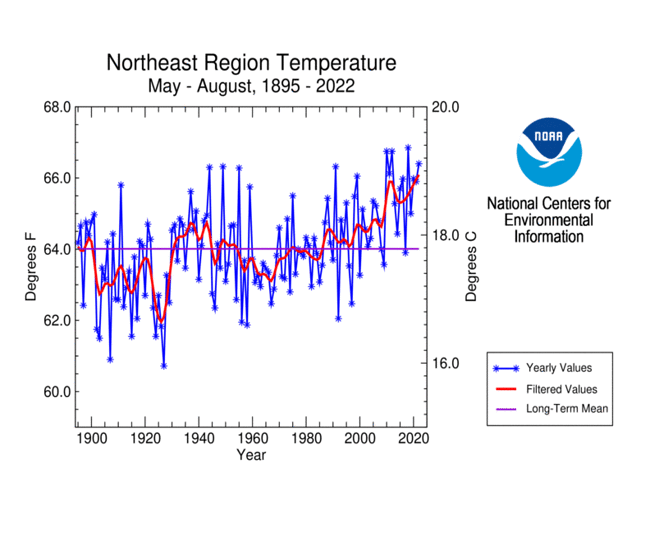
Massachusetts had the sixth driest July-August, tenth driest June-August and March-August, fifth driest May-August, and seventh driest November-August in 2022. New Jersey had the fifth driest July-August, fourth driest June-August, and seventh driest November-August. Summer heat accompanied the dry conditions across the Northeast, with above-normal temperatures extending into the fall. The Northeast had the ninth warmest summer, fourth warmest May-August, and eighth warmest July-December. The May-August and July-December temperature data reveal a significant warming trend over the last 30 years.
Southeast
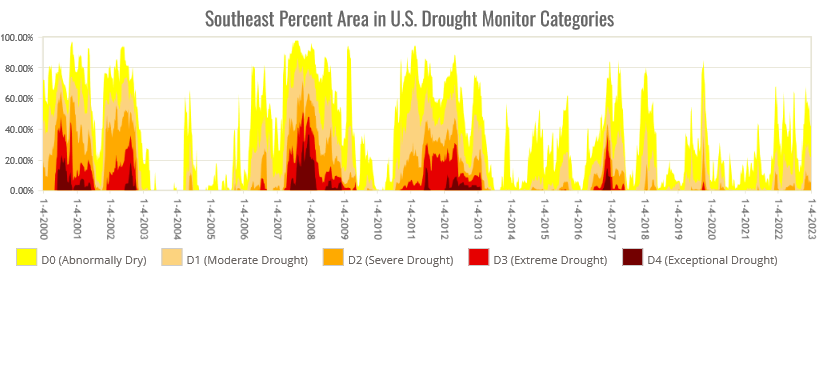
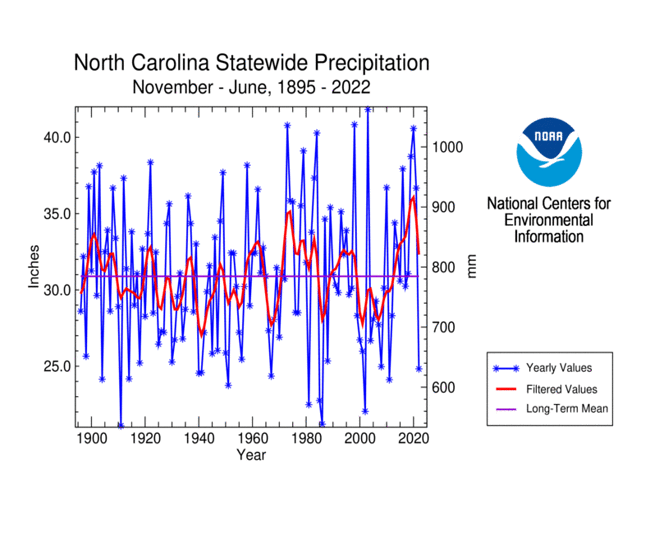
Various parts of the Southeast experienced drought at times during 2022. The region began the year with 16.2% drought coverage. The drought area decreased during February, increased during the summer, reaching a peak of 26.7% of the region on July 5, decreased again during late summer and early fall, then increased in the late fall to peak at 30.9% on November 29 before decreasing again. The coastal Carolinas were the part of the region that was most frequently in drought. North Carolina had the fourth driest June and 13th driest November-June in 2022.
Hawaii

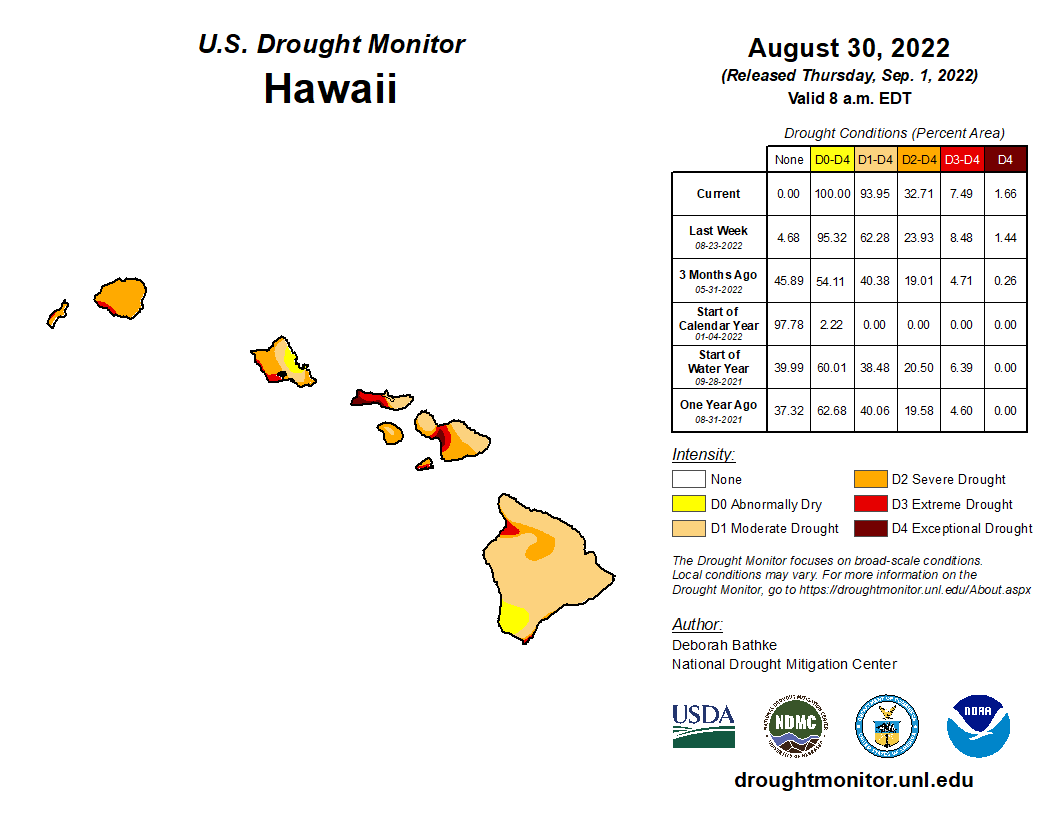
Hawaii began 2022 drought-free. A drier-than-normal January resulted in rapid drought expansion, especially on the Big Island to Molokai. The drought area reached a peak of 86.4% of the islands on February 8 before gradually decreasing to a minimum 24.3% in June. Dry weather returned during the summer, with most (94.0%) of the state in moderate to exceptional drought by August 30. This was a record drought extent for the state in the 23-year USDM record. Heavy rains during late fall and early winter cut the drought area down to 11.4% by the end of the year.
Alaska
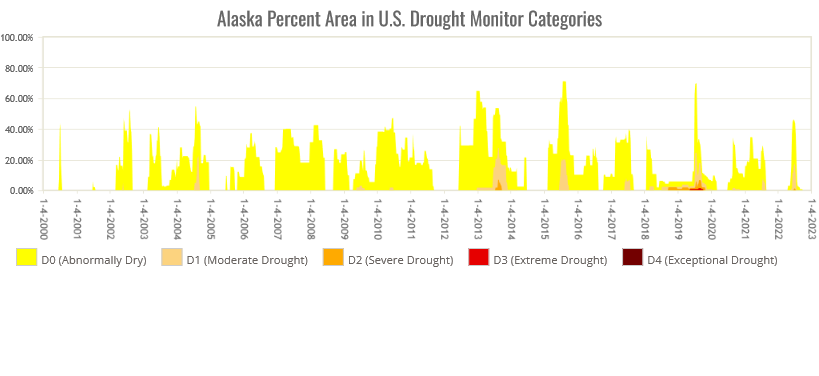
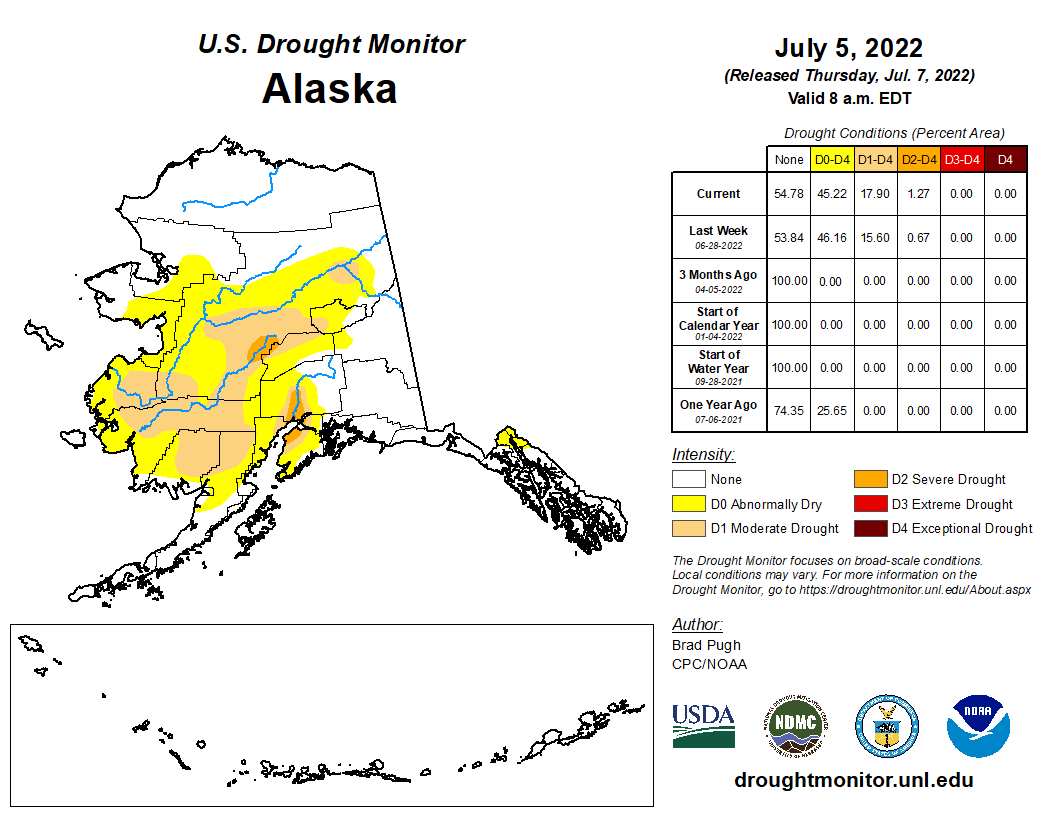
Alaska was free of drought and abnormal dryness for most of 2022. Moderate to severe drought developed during the summer, reaching a peak extent of 17.9% of the state on July 5. The areas affected stretched from the southwest to the northeast interior. Dozens of large wildfires developed during the summer. One million acres had burned by June 18 — the earliest such occurrence in a calendar year than anytime in the last 32 years. By July 1, 1.85 million acres had been consumed — the second-highest June total on record and the seventh-highest acreage burned for any calendar month on record for Alaska. Beneficial precipitation during the late summer eliminated drought from the state by August 9.
Puerto Rico and U.S. Virgin Islands

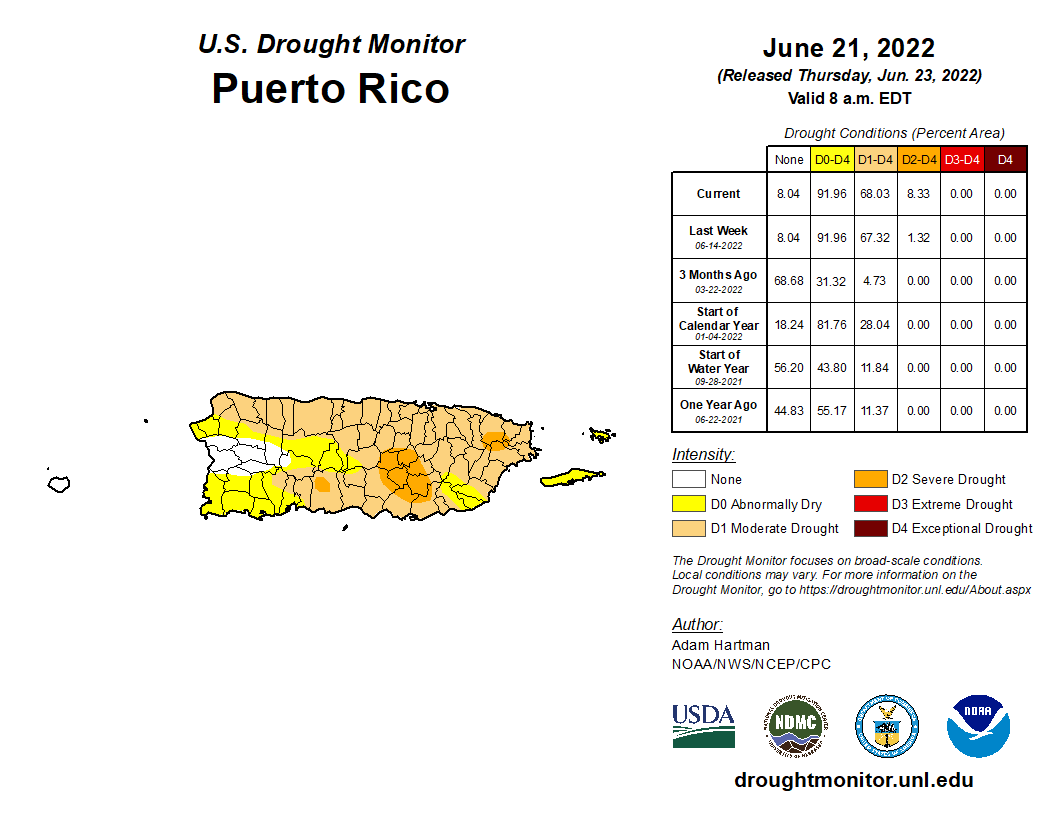

The year began with drought across the U.S. Caribbean islands — moderate drought was affecting St. John (in the U.S. Virgin Islands) (USVI) and a fourth (28.0%) of Puerto Rico, St. Thomas was experiencing severe drought, and extreme drought was afflicting St. Croix. Drought contracted on Puerto Rico and the intensity decreased across the USVI during late winter and spring, until it rebounded during the summer. By June 21, 68.0% of Puerto Rico was in moderate to severe drought, which is a record for the island in the 23-year USDM history. Drought intensity reached a peak in the USVI by July 19, when St. Croix and St. John were in extreme drought and St. Thomas in severe drought. Flooding rains from Hurricane Fiona brought an end to drought in Puerto Rico and the USVI during the fall.
U.S.-Affiliated Pacific Islands

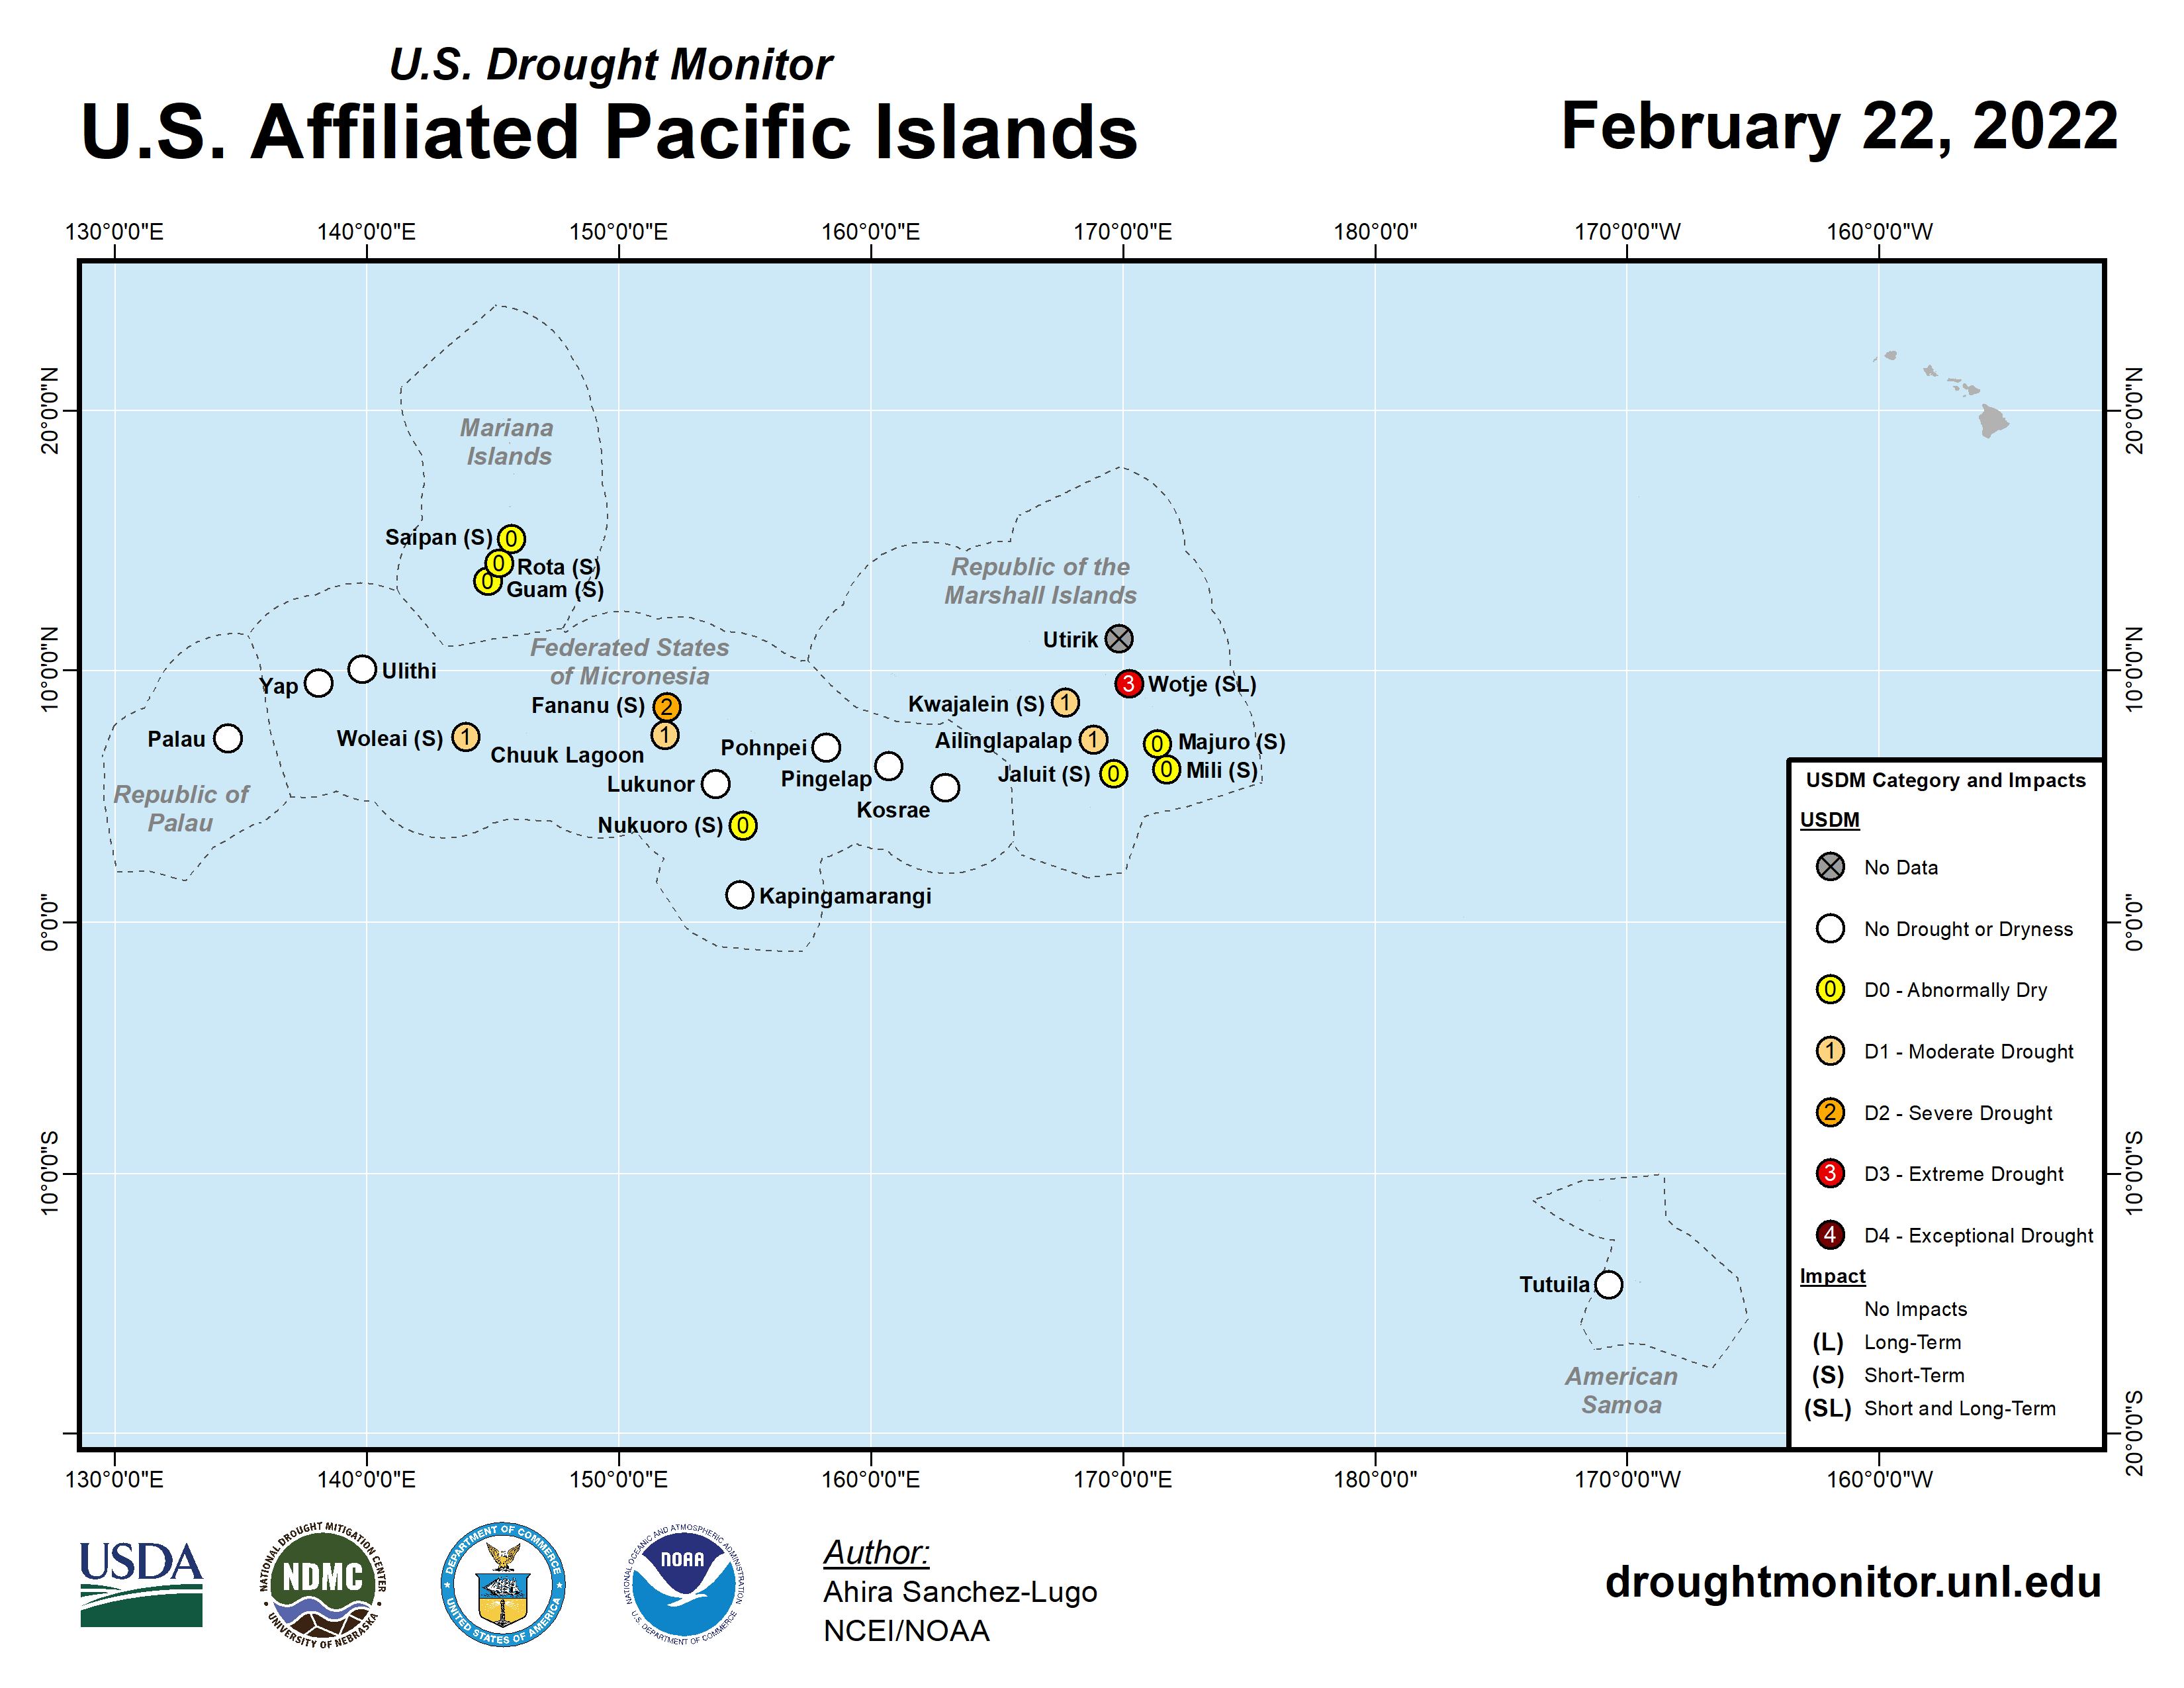
In the U.S.-Affiliated Pacific Islands (USAPI), 2022 began with moderate drought affecting Kapingamarangi (in the Federated States of Micronesia) (FSM) and Wotje (in the Marshall Islands) (RMI). By February, Kapingamarangi was abnormally dry but Fananu (FSM) had developed moderate drought, and drought had expanded in the RMI with Wotje now having extreme drought, Kwajalein severe drought, and Ailinglaplap moderate drought. By March, Fananu had worsened to severe drought and moderate drought had spread to Woleai and Chuuk in the FSM. By April, drought ended in the FSM and most of the RMI, with Wotje still having extreme drought, but moderate drought had developed in Guam. By May, Wotje still had severe drought but the rest of the USAPI were free of drought and abnormal dryness. By June, drought ended at Wotje but severe drought had returned to Kapingamarangi. Moderate drought continued at Kapingamarangi through September. By October, Lukunor (FSM) and Pago Pago (American Samoa) had moderate drought and Kapingamarangi was back to severe drought. Drought ended at Lukunor and Pago Pago by November, but severe drought continued at Kapingamarangi through the end of the year.