Climate Extremes Index | Tornadoes | Tropical Cyclones | Snow
Map of U.S. Climate Regions | Map of U.S. Climate Divisions
Regional Highlights
2016 National Events Map
Click for more information
Issued January 09, 2016: Unless otherwise noted, temperature and precipitation rankings refer to a 122-year period of record (1895-2016), and long-term average refers to the 20th century (1901-2000) value. Data for 2016 should be considered preliminary. The most up-to-date temperature and precipitation data is available through Climate at a Glance.
Supplemental 2016 Information
- Annual temperature evolution for select U.S. cities
- Annual precipitation evolution for select U.S. cities
- Regional warmest and wettest years
- Percentile Maps
National Temperature and Precipitation Analysis
In 2016, the contiguous United States (CONUS) average temperature was 54.9°F, 2.9°F above the 20th century average. This was the second warmest year for the CONUS, behind 2012 when the annual average temperature was 55.3°F. This marks the 20th consecutive year that the annual average temperature for the CONUS was above the 20th century average. The last year with a below-average temperature was 1996. Since 1895, the CONUS has observed an average temperature increase of 0.15°F per decade.
Nationally, the average minimum (low) temperature was 43.1°F, the warmest on record, exceeding the previous value (42.9°F in 2012) by about 0.2°F. Six states were warmest on record for minimum temperature. Nationally, it was the third warmest average maximum (high) temperature for the annual period, a full degree cooler than the record set in 2012.
Precipitation averaged across the CONUS in 2016 was 31.70 inches, 1.76 inches above the 20th century average. This was the 24th wettest year on record. Since 1895, precipitation across the CONUS has increased at an average rate of 0.16 inch per decade.
General highlights in 2016 included:
The year started with one of the strongest El Niños on record ushering in Pacific moisture and much needed drought relief to parts of the West, in the form of high elevation snowpack and valley rains. Late-winter snowpack values across the region were near to above average for most locations. While above-normal precipitation was common across the West, it generally fell short of values often observed during strong El Niño winters. Regardless, the regional drought footprint did contract, from 45.2 percent at the beginning of the year to 21.5 percent by the end of the year, owing largely to improvements in the Northwest and northern California. A strong and persistent ridge in the West limited the number of storms that reached central and southern California where drought conditions were worst. Additionally, the abnormal warmth in the late winter/early spring period prematurely melted some of the early season snowpack gains across the Sierra. Therefore, exceptional drought conditions remained throughout the year much of the West, and California in particular.
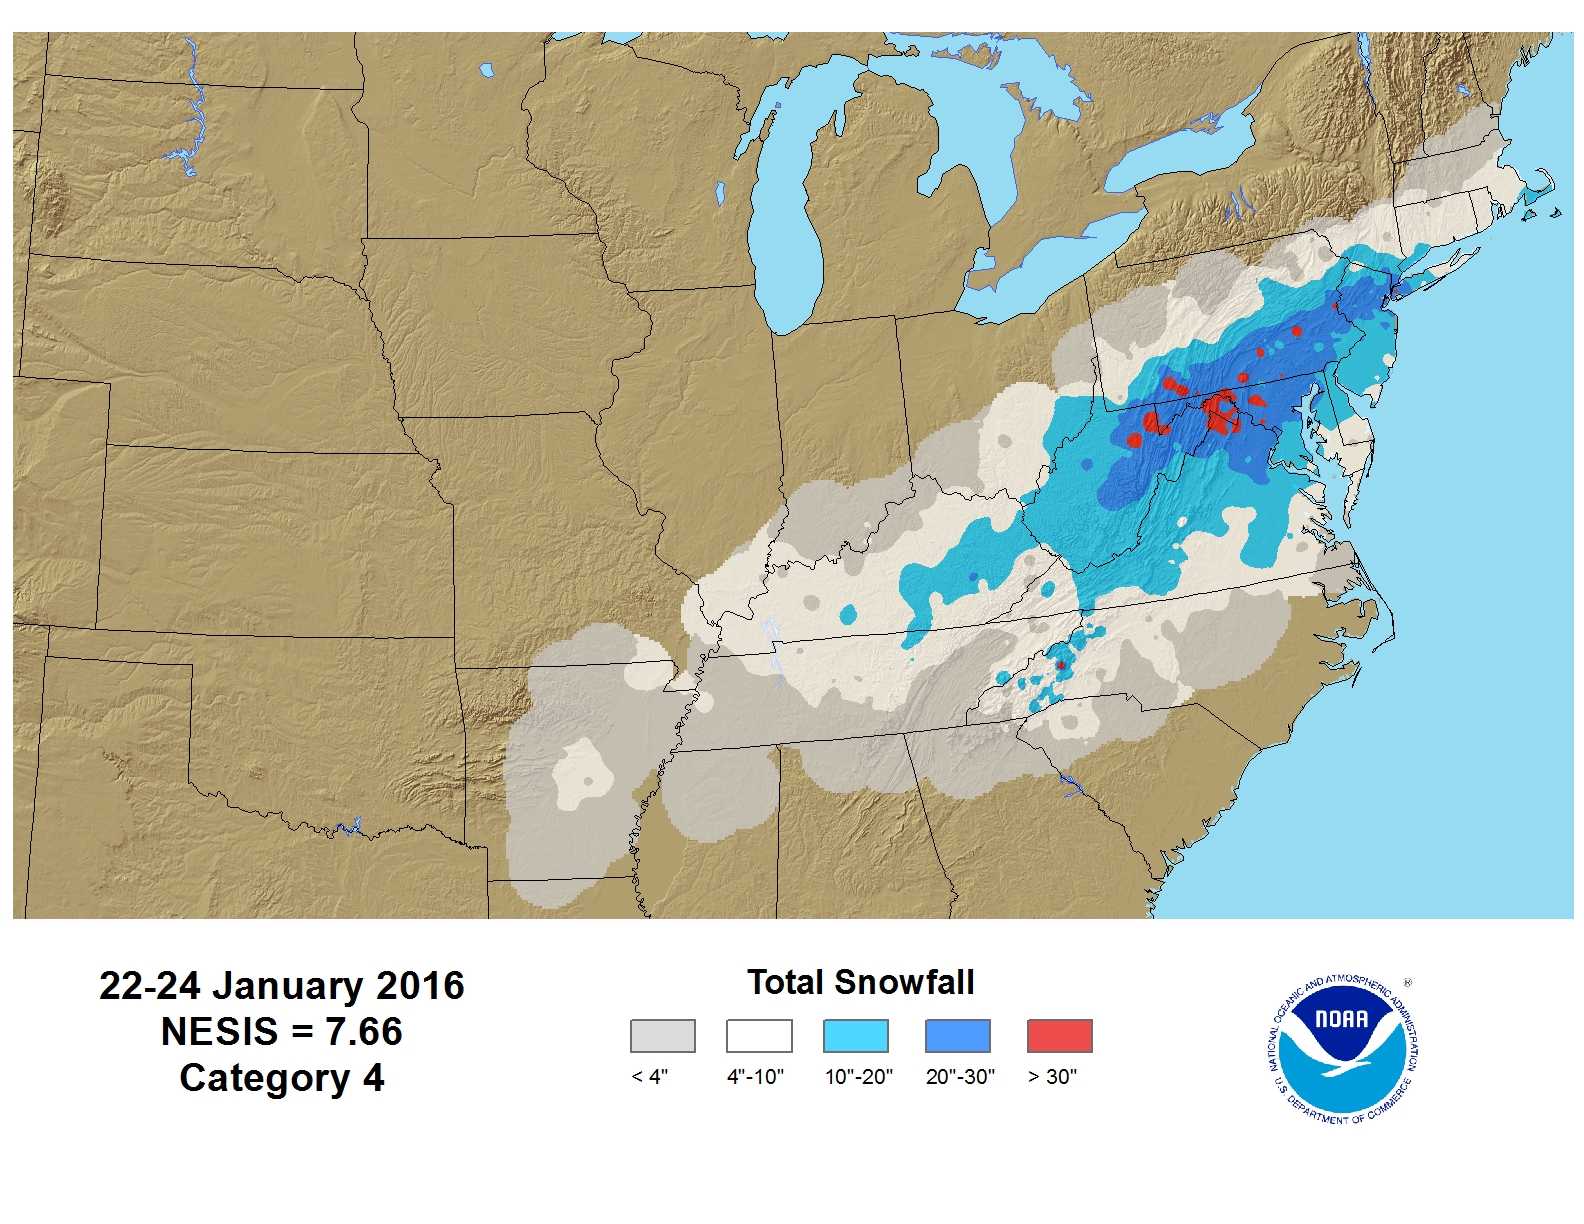
In the Mid-Atlantic and Northeast, a late-January winter storm broke all-time snowfall records in several cities. According to the Northeast Snowfall Impact Scale (NESIS), which combines patterns of snow accumulation and population, this was the fourth most impactful snowstorm since 1950.
Unstable and slow-moving air masses led to intense downpours in separate events across the South and Mid-Atlantic during the spring and summer months. In mid-April, nearly 10 inches of rain fell in Houston, Texas, the second highest one-day total for the city. Several additional torrential local downpours and historical flooding events occurred in central and eastern Texas in the spring. In June, a historic flash flood event dumped up to ten inches of rain during a 12-hour period in West Virginia. Additionally, catastrophic flooding occurred over the course of a week in Louisiana during August. The total sum of losses from these four inland flooding events exceeded 15 billion dollars.
In the summer and fall, upper-level ridging in the East starved systems of moisture and stunted crop development. Outside of the long-term drought in the West, drought intensified and expanded in two distinct areas during the summer: one in southern New England and adjacent parts of the Northeast, and one in the Southern Appalachians and adjacent parts of the Southeast. The Northeast drought began in June and peaked in coverage in mid-November; however the most intense drought categories (D3-D4) peaked at the end of September. The Southeast drought began in late April and reached peak intensity at the end of November. During the fall in the Southeast, several locations had no precipitation for more than 50 consecutive days. Generally speaking, the ridging along the West and East coasts forced the majority of the storms to track along the northern tier states, resulting in a record annual precipitation averaged across the Upper Midwest region.
For the CONUS as a whole, the overall drought footprint increased from 18.4 percent, as analyzed on January 5, 2016, to 22.5 percent as analyzed on January 3, 2017. However, the average coverage of drought for the year was 19.0 percent, the smallest since 2010.
Another result from the persistent ridge in the East was continuous seasonal warmth that culminated in the warmest year on record for the Southeast region. The Northern Rockies and Plains climate region and the South climate region were each second warmest on record, and each about a half degree Fahrenheit cooler than 2012.
Statewide highlights in 2016 included:
On the statewide level, 2016 was a year of temperature and precipitation extremes. Every state in the union had an average annual temperature that was among the warmest seven of their historical records, and all but Iowa, Maine, Nevada, Oregon and Utah had one of their warmest five years. Georgia was record warm. The breadth of the 2016 warmth is unparalleled in the nation's climate history. No other year had as many states breaking or close to breaking their warmest annual average temperature. The warmest year on record, 2012, had more record warm states (26), but unlike 2016, states in the Northwest fell outside of their warmest decile of historical distribution.
Precipitation also saw regional extremes. As is typical with a strong El Niño episode, precipitation across much of the West was above normal for the year. California's precipitation was 3.27 inches above the 20th century average while Washington's was 7.36 inches above average. Several Upper Midwest states were much wetter than normal for the year. Both Minnesota and Wisconsin had their second wettest year, with Minnesota's 2016 total just 0.3 inch less than its wettest year on record, 1977. Conversely, it was the fourth driest year for Connecticut, ninth driest for Georgia and tenth driest for Massachusetts.
For most of the year, Alaska "baked", with record heat at the local and statewide level. With a statewide record that dates to 1925 (92 years), Alaska had its second warmest winter, warmest spring, second warmest summer and a warmer-than-average fall. The persistent heat led to Alaska's warmest year on record. Each of the three years since 2014 is among the three warmest on record for Alaska, with 2015 tied with 2002 for third warmest. At the local level, the annual average temperature in Barrow was 7.1°F above the 1981-2010 average. Nome was 5.1°F above, Fairbanks 3.9°F, Anchorage 4.4°F and Juneau 2.7°F above the 30-year average. Since 1925, Alaska has observed an average temperature increase of 0.30°F per decade. Statewide precipitation totals were near average for the annual period. Seasonally, several climate divisions in western Alaska were record dry in the 2015/16 winter, while the spring precipitation was wetter than average in Bristol Bay and the Panhandle. Statewide summer precipitation was generally wetter than average, especially for the interior. Autumn precipitation totals were below average across much of eastern Alaska.
Seasonal Summaries
Winter (December 2015 through February 2016)


In brief:
- The average winter temperature for the Lower 48 was 36.8°F, 4.6°F above the 20th century average. This was the warmest winter on record for the CONUS, surpassing the previous record set in 1999/2000. Forty-six states across the contiguous U.S. had a winter temperature that was above average. Six states in the Northeast had a winter temperature that was record warm.
- The December average temperature is rising at a rate of 0.2°F per decade.
- It was the 12th wettest winter for the CONUS and the wettest since 1997/98, during the previous strong El Niño. Twelve states had winter precipitation totals that were much above average, including Iowa which was record wet.
- Alaska had its second warmest and 18th driest winter since records began there in 1925.
- Hawaii had a dry winter with nearly all locations across the islands observing below average precipitation.
- A late February tornado outbreak caused about $1.0B in losses across parts of the Southeast, mid-Atlantic and Northeast.
Discussion:
The season began with the warmest December on record with an average temperature of 38.7°F, 6.0°F above average. The previous warmest December was 1939, which was 5.0 °F above average. There were 29 states that had their warmest December on record - all of which were east of the Rockies. Temperatures were 6°F to 15°F above average across the Midwest, Northeast, Southern, Southeast and parts of the High Plains regions. Below average temperatures were observed in northern California and parts of the Southwest, but no state was cooler than average in December.
January was warmer than average with an average temperature of 32.2°F, 2.1°F above average. Warmer-than-average temperatures were draped across parts of the West, northern tier States, Plains and Northeast, while average temperatures were cooler than normal in areas along the Mid-Atlantic and Southeast. Above-average warmth engulfed much of the country in February. The average temperature was the 8th warmest on record with an average of 39.5°F, 5.7°F above average. Nearly every state was warmer than average during the month, with the exception of a handful of states along the eastern seaboard.
Several locations across Alaska were record warm, including Barrow and King Salmon. Anchorage and Juneau had their second warmest December-February.
The 3-month average CONUS precipitation of 8.08 inches was 1.29 inches above average and the 12th wettest winter on record, and the wettest since the record-breaking winter of 1997/98, which also occurred during a strong El Niño. The season was marked by the wettest December on record with a precipitation total of 4.06 inches, 1.71 inches above average and 0.3 inch above the previous record last set in 1982. December 2015 is currently the only month in the 122-year period of record that holds the title of both warmest and wettest on record for the month. Parts of the Midwest were record to near record wet. Iowa, Oklahoma, North Carolina and Wisconsin each had their wettest December on record. More than a dozen additional states across the Midwest, Northwest and Southeast had much above average precipitation. Precipitation during January was below average across much of the U.S. It was the 39th driest January nationally on record, 0.24 inch below average. Several states in the West and Southwest had above average precipitation in January and Florida had its fourth wettest. Much of the northern Plains, Midwest, South, Southeast and Northeast were below average in January. February precipitation was 0.18 inch below average. Most states west of the Mississippi River were near to below average while the eastern third of the U.S. was near to wetter than average. Much above average precipitation fell in Vermont (4th wettest), New York (7th wettest), New Hampshire (8th wettest) and Maine (9th wettest).
Precipitation was significantly greater than recent winters in the western U.S., typical of a strong El Niño, and provided much-needed snowpack in the Sierra Nevada early in the season. Vital snowpack levels were near- to above-average for much of the Sierra and Cascades. However, measurements in the Rockies were near- to below-average. After an above average 2014/15 winter in the Northeast, the 2015/16 winter was generally below average due in part to warmer-than-average winter temperatures across much of the region. In New York, Binghamton and Albany had their least snowiest winter on record while the winter snowfall in Boston was about 75 percent of normal. A late January storm pushed seasonal snow totals above average in New York City and Washington DC. The storm impacted much of the Mid-Atlantic region and ranked as a Category 4 on the NESIS scale, the fourth most impactful since 1950. In the Midwest, Cleveland, Chicago and Detroit had half their typical snowfall.
At the beginning of winter, 20.6 percent of the CONUS was in drought and by the end of the season the drought footprint decreased to 14.3 percent of the CONUS. The majority of the improvement was seen in the Northwest where D3 (extreme drought) was completely eliminated.
Spring
In brief:
- The national spring temperature of 53.7°F was 2.8°F above the 20th century average and the sixth warmest on record and the warmest since the record breaking spring of 2012.
- The highest spring temperatures, relative to history, occurred in the Northwest and much of the northern tier states.
- For the first time in Alaska's climate record, its average spring temperature hit 32.0°F. This was easily Alaska's warmest spring on record, eclipsing the previous record set in 1998 by 2.0°F.
- Precipitation totalled 9.09 inches, 1.15 inches above average, across the CONUS, resulting in the 17th wettest spring.
- Above-average spring precipitation fell across most of the area between the Mississippi River and the Pacific Coast.
- Several major weather disasters struck the South in March and April, causing upwards of $12B in losses due to flood, wind and hail damage, primarily in Texas.
Discussion:
The national spring temperature of 53.7°F was 2.8°F above the 20th century average and the sixth warmest on record. Every state across the Lower-48 was above- to much-above average during the March-May period. Both Washington and Oregon had their 3rd warmest spring on record. No state was near or below average. It was the fourth warmest March on record for the CONUS with a temperature 6.0°F above average. All but 13 states were much warmer than average and ten states had one of their five warmest Marches on record. Above average warmth continued in April as the nation had its 18th warmest such month on record, 2.2°F above average. The West was the epicenter of the anomalously high temperatures, which gradually became near to below average towards the East. Oregon and Washington had their second warmest April on record and it was the third warmest for Idaho. New York and Vermont were cooler than average. May was near the historical mean, nationally, with a temperature of 60.3°F, 0.1°F above average. Warmer than average temperatures in parts of the West, Northwest, northern tier and Northeast counterbalanced the cooler-than-average temperatures in the Southern Plains and parts of the East.
Generally speaking, precipitation was above average for much of the CONUS west of the Mississippi, while drier-than-average conditions existed for much of the Southeast and Northeast. Conditions were much wetter than average across the South and parts of the High Plains, where Nebraska had its fifth wettest spring, Louisiana its sixth and Texas its seventh. In the Northeast, New York had its ninth driest spring. During April and May, a persistent storm track fueled intense rain showers for parts of eastern Texas. As much as 20 inches of rain fell in the region in two separate events.
Nationwide, March precipitation totalled 2.95 inches, 0.44 inch above average, ranking it the 21st wettest on record. It was the wettest March since 3.23 inches fell in 1998. Precipitation extremes existed throughout the CONUS during March. Louisiana was record wet, Wisconsin had its second second wettest and Michigan had its third wettest March on record. In contrast, New Mexico had its third driest March while it was the eighth driest for Arizona and North Carolina. April precipitation across the Lower-48 totalled 3.04 inches, 0.52 inch above average and the 16th wettest. When compared to March, precipitation in April was more uniform throughout the Lower-48 as much of the southern U.S. and Northern and Central Plains were much wetter than average while much of the eastern seaboard and Northwest were drier than average. May precipitation was near average nationally with 3.10 inches, 0.19 inch above the 20th century mean. Virginia had its fourth, Delaware had its sixth and Maryland had its ninth wettest May.
Tropical Storm Bonnie made landfall near Charleston, SC in late May, dumping up to ten inches of precipitation in the region.
At the beginning of the season, 14.3 percent of the CONUS was in drought and by the end of May 12.7 percent was in drought. Continued improvement was seen in the West where extreme to exceptional drought was eradicated from northern California. Meanwhile, drought developed in parts of the Northeast and Southeast.
The contiguous U.S. spring snow cover extent was 152,740 square miles below the 1981-2010 average. The snow cover extent in March was the second lowest in the 51-year satellite record.
Summer

In brief:
- The average CONUS summer temperature was 73.5°F, 2.1°F above the 20th century average, the sixth warmest on record. Twenty-eight states across the West and in the East were much warmer than average.
- The summer was marked by the warmest June on record while both July and August were among the 20 warmest, respectively.
- Alaska observed its second warmest summer in its 92-year record with an average temperature of 53.5°F, 3.0°F above average.
- It was the 24th wettest summer on record for the CONUS, with a precipitation total for the contiguous U.S. of 8.97 inches, 0.65 inch above average.
- Above-average precipitation was widespread across the Midwest and Lower Mississippi Valley where eight states were much wetter than average. Below-average precipitation was observed across the West, Southeast and Northeast where six states were much drier than average.
- Alaska had its 12th wettest summer, in a record that dates to 1925 (92 years).
Discussion:
Every state had an average summer temperature that was above average. Three states (California, Connecticut and South Carolina) were record warm. Another 26 states were much above normal with 17 of them having one of their warmest five summers on record. No state was near to cooler than average for the summer. The summer was marked by the warmest June on record for the CONUS with an average temperature of 71.8°F, which is 3.3°F above average. This followed June 2015, which was the third warmest June on record. The average temperature in July was 75.2°F, 1.61°F above average and the 14th warmest on record. Florida and New Mexico were record warm during July. Both of the Carolinas and Georgia were third warmest while Texas was fourth warmest. Near normal temperatures were found in the Northwest, northern Plains and parts of the Midwest. Above normal temperatures continued in August as the CONUS had its 17th warmest August on record with an average temperature of 73.5°F, 1.4°F above average. For the month, record heat engulfed much of the Northeast where all but Maine, New Hampshire and Vermont were record warm. The Northeast region was 4.7°F above average, also record warm. Statewide August temperatures in Connecticut, New Jersey and Pennsylvania were at least 5.0°F above average for the month. August was cooler than average in Colorado and New Mexico.
For the summer as a whole, wetter-than-normal conditions prevailed for parts of the Midwest and South while the West, and parts of the North and Southeast regions, were drier than average. Louisiana had its third wettest summer and it was the fourth wettest for Kentucky, Minnesota and Wisconsin, sixth wettest for Indiana, seventh wettest for Illinois, eighth wettest for Michigan, and tenth wettest for Arkansas. Conversely, it was the seventh driest for Massachusetts and Wyoming, ninth driest for Georgia and Idaho, and tenth driest for South Carolina. The summer began dry with the 20th driest June on record, nationally. Many states, mainly across the northern half of the country, were drier than average. July was slightly wetter than average for the CONUS with dry extremes in the Southwest and Southeast counterbalancing the wet extremes in the Midwest and Northern Plains. It was the fourth driest July on record for Florida and Georgia. Meanwhile, Kentucky had its second wettest and it was the third wettest July for Illinois. August precipitation was above average in much of the nation's midsection. The South climate region had its wettest August on record. At a statewide level, Louisiana had its wettest August and it was the second wettest such month for Illinois and Indiana and the third wettest for Arkansas, Missouri and Texas. It was the third driest for Idaho.
During the season drought conditions in the CONUS expanded from 12.7 percent to 19.5 percent. Drought conditions remained steady in the West but intensified in the Northeast and Southeast. The low precipitation totals combined with extreme warmth resulted in dire conditions in the Northeast. Drought in the region expanded from less than 1 percent coverage at the beginning of the summer to 27.3 percent by the end.
Autumn
In brief:
- The average autumn temperature for the Lower-48 was 57.6°F, 4.1°F above the 20th century average, record warm. Seven states were record warm and an additional 23 states had an average autumn temperature that was either second or third warmest on record.
- This was the second straight warmest autumn on record for the CONUS, surging past 2015's record by 0.8°F.
- Precipitation was near the middle of the pack nationally, with wet extremes in the Northwest counterbalancing the dry extremes in the Central Rockies, Gulf Coast region and interior Southeast.
Discussion:
The contiguous U.S. average temperature for the fall was 57.6°F, 4.1°F above the 20th century average, the warmest fall on record for the second consecutive year. Record warmth stretched across eight states, including: Colorado, Iowa, Kansas, Michigan, Minnesota, New Mexico, Texas, and Wisconsin. Another 23 states had their second or third warmest fall on record. The national average temperature in September was 67.1°F, 2.3°F above average and the ninth warmest such period on record. Every state east of the Mississippi was much warmer than average for the month, while western states were generally near normal. For the third consecutive year, October flirted with near record temperatures, with an average temperature of 57.7°F, 3.6°F above average and the third warmest. Five states had one of their three warmest Octobers on record. Of those, the average temperature in New Mexico and Texas resulted in the second warmest October on record. It was the second warmest November on record nationally, with an average temperature of 48.0°F, 6.3°F above average and the warmest November since 2001. November 2016's temperature was just shy of the record of 48.1°F, set in 1999. Idaho, North Dakota and Washington were record warm for November and eleven other states were second warmest. No state had an average temperature that was near or below normal.
Precipitation during the fall was near normal with a total of 6.93 inches, nationally. Washington was record wet and above-normal precipitation also fell throughout the West and northern tier states. For the most part, the Southeast continued to suffer from below-normal precipitation. Alabama had its third driest fall while five other states in the Southeast were much below average for the period. Colorado had its ninth driest fall on record. Very large precipitation values from two tropical cyclones, largely confined to near-coastal areas, shifted statewide totals toward the wetter values, resulting in a wetter than average fall for both North and South Carolina. Total precipitation for the CONUS in September was 2.75 inches, 0.26 inch above average. Precipitation during October was more extreme at the state levels, but overall was near normal for the CONUS. Idaho, Montana and Washington were record wet for the month while Oregon and California were second wettest. Drier-than-normal conditions were seen across much of the South and Southeast in October, as Alabama had its second driest such month and Louisiana its fifth. Dryness continued in November, as the Lower-48 saw its 28th driest such month on record. Much of the dryness was seen in the Southeast where Florida was record dry in November, breaking a record set in 1931.
In early September, Hermine became the first hurricane to make landfall in Florida since Wilma in 2005. The storm brought heavy rain to the Southeast and caused at least 5 fatalities. Hurricane Matthew became the Atlantic's first Category 5 hurricane since Felix in 2007. Mathew made landfall just south of Myrtle Beach, South Carolina on October 8. Inland flooding from the storm caused monumental agricultural losses in the eastern Carolinas.
At the beginning of the season, 19.5 percent of the CONUS was in drought and by the end of the season the drought footprint increased to 31.5 percent. Much of the expansion was in the Southeast, where drought coverage grew threefold during the season, and where some locations did not receive any precipitation for more than 50 consecutive days during the fall. Drought in the Northeast doubled, growing from 27.3 percent to 54.4 percent. Meanwhile, the long-standing drought in the West slowly improved from 34.8 percent to 25.6 percent.
As a result of the dry conditions across the Southeast, the 8,560 wildfires during November was the second most since 2000 and burned 275,000 acres, the fourth largest acreage.
This annual report places the temperature and precipitation averages into historical perspective, while summarizing the notable events that occurred in 2016. More detailed analysis on individual months can be found through the Climate Monitoring home page.
For information on December, please see our December 2016 report.
Alaska Annual Summary
The average statewide temperature for Alaska during 2016 was 31.9°F, 5.9°F above average, and the warmest year of an Alaska statewide record that dates to 1925 (92 years). Each of the three years since 2014 is among the three warmest on record for Alaska, with 2015 tied with 2002 for third warmest. Of the 17 years during this century, six are among the warmest 10 of Alaska's record. The Alaska annual temperature is increasing at an average rate of 0.3°F per decade. Much of the state experienced record warmth during 2016. The largest departures from normal occurred in the climate divisions of the North Slope, West Coast and Bristol Bay. Each of these divisions had an annual temperature 7.0°F above the 1925-2000 average.
At the seasonal level, the average winter (December 2015-February 2016) temperature was 14.2°F, which was 10.6°F above average and record warm. Much of the southwest was record warm while the rest of Alaska was much above average. Springtime temperatures were no different as the statewide average of 32.0°F was 8.0°F above average - again record warm. All but the northern tier and Aleutians were record warm. The record heat subsided slightly in the summer, but it was the still the second warmest for Alaska with an average temperature of 53.5°F, 3.0°F above average - bested only by the 55.9°F of 2004. The extreme southwest was record warm while the northern tier was above average and the interior was much above average. Fall was warmer than average with an average temperature of 28.5°F, 2.6°F above average. December 2016 rounded out the year with an average temperature that was 5.7°F, 2.0°F above average.
It was record dry for a large portion of western Alaska during the winter, while all but the Gulf of Alaska and Panhandle regions were below or much-below average. The average precipitation total across the state was 6.84 inches, 1.31 inch below average, resulting in the 18th driest winter on record. Precipitation during spring was above average for the state with a total average of 7.23 inches, 1.00 inch above average and the 18th wettest. Wetter than average conditions existed in the Gulf and Southeast interior regions. The rest of Alaska was near normal. Conditions were wetter than average across Alaska during the summer with the average statewide precipitation total 12.06 inches, 2.06 inches above average and 12th wettest. The interior regions benefited the most from the precipitation as they were much above average. The Aleutians and parts of the Panhandle were below average. It was the 17th driest fall on record for Alaska as the precipitation total was 10.49 inches, 1.86 inches below average. It was much drier than normal for the Southeast while the Aleutians had above average precipitation. December rounded out the year as the 17th driest on record, 0.97 inch below average.
Very Warm/Cold and Wet/Dry Percentages
One way to assess the magnitude of warm/cold and wet/dry episodes is to compute the percent area of the contiguous United States that was "very warm/very cold" and that was "very wet/very dry". The figures above depict these values for each month in the past 30 years. These percentages are computed based on the climate division data set. Those climate divisions having a monthly average temperature/precipitation in the top ten percent (> 90th percentile) of their historical distribution are considered "very warm/very wet" and those in the bottom ten percent (< 10th percentile) are "very cold/very dry". The "very warm" categories translate to the "much above average" while the "very cold" categories translate to the "much below average" in terms of the NCDC ranking methods. This is similar for the "very wet" and "very dry" categories and the NCDC ranking methods of precipitation totals.
The table below shows the percent area of the nation "very warm" and "very cold" for each month of 2016.
| Month | Percent area of CONUS "very warm" | Percent area of CONUS "very cold" |
|---|---|---|
| January | 1.58 | 0.0 |
| February | 56.2 | 0.0 |
| March | 87.7 | 0.0 |
| April | 13.2 | 0.0 |
| May | 3.9 | 0.0 |
| June | 45.0 | 0.3 |
| July | 35.9 | 0.0 |
| August | 29.9 | 0.0 |
| September | 37.8 | 0.0 |
| October | 53.4 | 0.0 |
| November | 87.3 | 0.0 |
| December | 7.4 | 13.2 |
The table below shows the percent area of the nation "very wet" and "very dry" for each month of 2016.
| Month | Percent area of CONUS "very wet" | Percent area of CONUS "very dry" |
|---|---|---|
| January | 1.3 | 0.3 |
| February | 5.7 | 3.2 |
| March | 19.4 | 12.4 |
| April | 21.1 | 0.9 |
| May | 6.7 | 1.5 |
| June | 1.7 | 12.0 |
| July | 11.6 | 13.6 |
| August | 22.9 | 10.8 |
| September | 10.8 | 5.6 |
| October | 20.5 | 16.0 |
| November | 3.8 | 10.9 |
| December | 15.5 | 0.0 |
Climate Extremes Index
The U.S. Climate Extremes Index (USCEI) for 2016 was 95 percent above average, ranking as the third highest annual USCEI in the 107-year record. Only 1998 and 2012 were higher. When excluding the tropical cyclone component, the USCEI was even higher at 121% above average, the second highest value on record behind 2012. On the national scale, extremes in both warm maximum and minimum temperatures dominated with warm minimum temperature extremes ranking highest on record and second highest for warm maximum temperature extremes. Regionally, the USCEI was record highest for the Upper Midwest (owing largely to record to near-record extremes in warm maximum and minimum temperature, wet PDSI, days with precipitation, and 1-day precipitation), and much above average for all other regions except for the Northwest, which had only above average extremes. All regions experienced above average extremes in both maximum and minimum temperatures during 2016, which is consistent with the CONUS average temperature rank of 2nd warmest year on record.

Regional CEI values for winter 2015/16
The winter (Dec-Feb) USCEI was also 95 percent above average, ranking as the second highest winter on record. Elements which contributed to this elevated USCEI value were warm maximum and minimum temperatures, wet PDSI and extremes in 1-day precipitation. Regions with record values in these extremes included the Ohio Valley, the South and the Upper Midwest. The footprint of extremes in warm minimum temperature was a record across both the Northern Rockies and Plains and the Upper Midwest (87 percent and 100 percent, respectively). The Southwest had below average extremes during this time and the West was near the median value for extremes.

Regional CEI values for spring 2016
The spring (Mar-May) USCEI was 20 percent above average. Elements which contributed to this include warm minimum temperatures, and, to a lesser extent, wet PDSI, warm maximum temperatures and extremes in 1-day precipitation. On a regional scale, the Northwest CEI ranked above average with elevated extremes in both warm maximum and minimum temperatures. The Southwest again experienced below average extremes while the Ohio Valley, Southeast and Northeast were near average for the season. Half of the Upper Midwest was blanketed by extremes in wet PDSI during the spring and all regions except for the Southwest had a much above average footprint of warm minimum temperature extremes.

Regional CEI values for summer 2016
The summer (Jun-Aug) USCEI ranked 22nd highest on record and was 15 percent above average. Nationally, extremes in warm maximum and minimum temperature were the primary contributors to this elevated extent of extremes. Regionally, The Northeast, Southeast and West experienced much above average extremes in maximum and minimum temperatures, 1-day precipitation in the Northeast and elevated extremes in the number of days without precipitation in the West. The Northwest had below average extremes and the Northern Rockies and Plains were near the median value for the season.

Regional CEI values for autumn 2016
The autumn (Sep-Nov) USCEI reflected the extensive warmth across the CONUS during this time with a value 95 percent above average, ranking second highest in the 1910-2016 period of record. Nationally, elements contributing to this elevated extent of extremes included warm maximum and minimum temperatures, which blanketed most of the CONUS and broke the record set in 2015 for the autumn season. Regionally, both the South and the Upper Midwest ranked highest on record with warm maximum and minimum temperatures and wet PDSI dominating both regions while extremes in 1-day precipitation were also elevated across the Upper Midwest. No region ranked below average for extremes during autumn.

Regional TMIN Extremes Map

Regional TMAX Extremes Map
Looking at maps of the extent of annual extremes in both maximum and minimum temperatures from 1910 - 2016, we can visualize the spatial characteristics and placement of extreme warm and cold periods at various times throughout the years. Cooler periods are noted in the 1910s, specific years during the middle portion of the 20th century and a handful of years during the 1980s and 1990s. Warmer periods are evident during the dust bowls of the 1930s for both maximum and minimum temperatures and 1950s for maximum temperature. Warm extremes appear with greater regularity from the late 1980s to the present. 2012 holds the record for the greatest footprint in warm maximum temperature extremes (88 percent of the CONUS) whereas 2016 holds the record for the maximum extent in warm minimum temperature extremes (93 percent of the CONUS). The record footprint for cold maximum temperatures across the CONUS occurred in 1912 (58 percent) and in 1917 (74 percent) for extreme cold minimum temperatures.
Monthly National Snow and Ice Report
The 2015/16 winter season (December 2015-February 2016) began with a record warm December for the CONUS as 29 states experienced their warmest December on record. The winter ended with the eighth warmest February as above-average temperatures were widespread across the western half of the contiguous U.S. as well as parts of the Midwest and Northeast. For the season as a whole, forty-six states across the contiguous U.S. had a winter temperature that was above average. Much-above average winter temperatures were observed across the Great Plains, Midwest, Southeast, Northeast, and parts of the West. Six states in the Northeast had a winter temperature that was record warm. Binghamton and Albany, New York both had their least snowy winter on record. Wichita, Kansas had its 3rd least snowiest winter on record. On the other hand, Cheyenne and Casper, Wyoming both had their 6th snowiest winter on record. Dry and warm conditions at the end of winter depleted snowpack in much of the West. Sierra Nevada snowpack fell from 116% to 83% of average during February. While a majority of basins in the Intermountain West reported near-normal snowpack, percentages in the Sierra fell during February.
A strong El Niño and a positive Arctic Oscillation played a large role in the winter snowpack across the Lower-48. At the start of the season, a large ridge dominated the weather pattern along the eastern half of the country in December, deflecting the frontal passages which typically provide cold, moist air. Much warmer-than-normal to record warm temperatures persisted all month in the central and eastern CONUS. Conversely in the West, an active northerly jet in the upper atmosphere allowed several systems to slam the Northwest Pacific coastline, providing near-to-cooler-than-normal temperatures and welcomed mountain snowfall. At the end of December, snow cover was above normal for much of the western half of the U.S. Meanwhile, much of the Midwest and Northeast had below-normal snow cover.
In January, the stream of Pacific weather systems continued to push into the western U.S., bringing above-normal precipitation to many areas. Where temperatures were cold enough, precipitation fell as snow, building up the much-needed mountain snowpack. For the month of January, much of the West, Southwest, Midwest, and Mid-Atlantic had above-normal snow cover. It was the seventh largest January snow cover extent for the CONUS (based on satellite records).
The season ended with a strong ridge in the West, inhibiting precipitation and allowing temperatures to be near record warm in the region. As a result, much of the western and central U.S. was warmer and drier than normal in February. This helped to contract the CONUS snow cover to 15-25 percent by the end of the month, the 13th smallest on record. Conversely, the east coast was generally wetter than normal thanks to a moist flow from the Gulf of Mexico and North Atlantic.
In Alaska, the snow cover extent was below average for the winter; however, the heavy snows that fell in the autumn of 2015 helped boost the late winter snowpack across the state. Below-average snowpack was observed across southern parts of the state, where record warmth was observed during March, while above-average snowpack was observed across interior locations. In April, record-warmth limited the snowpack across much of Alaska with snowpack totals less than 25 percent of average across central and southern regions of the state.
Winter and spring mountain snowpack provide a crucial warm season water source across much of the western United States. The total annual water budget for agriculture and human use in the mountainous West is highly dependent on the amount of snow melt that will occur in spring and is proportional to the amount of snow on the ground. The annual snowpack typically peaks in early April. At the beginning of April, most locations from the Rockies to the Sierra Nevada had near-average snowpack. In the Southern Rockies, snowpack totals were less than 25 percent of normal. For parts of California, this was the first above-normal snowpack season since 2011, providing much needed water resources going into the warm and dry season. It would be later in the year when the runoff melt from the snowpack, along with summer and fall rains, would attribute to a positive gain in reservoir levels across the West.
Monthly Tropical Cyclones Report


The 2016 North Atlantic hurricane season had 15 named storms (those that reached tropical storm or greater strength), seven of which were hurricanes, and three of which were major hurricanes. The eight tropical storms were below the 1981-2010 average of 12.1; the number of hurricanes and major hurricanes were near the 1981-2010 averages of 6.4 and 2.7, respectively. The number of hurricanes was the most since 2012, when 10 hurricanes formed. Typically, when El Niño conditions are present in the equatorial Pacific like in 2015 and early 2016, tropical cyclone activity across the North Atlantic basin tends to be suppressed due to increased wind shear, which is an unfavorable condition for tropical cyclone development.
Hurricane Matthew became the first Category 5 hurricane since Hurricane Felix in 2007 and was the first Category 4 hurricane since Hurricane Cleo to strike Haiti. After skirting the eastern seaboard, Matthew would eventually make landfall near Myrtle Beach, South Carolina as a Category 1, continuing the decade-long streak of no major hurricanes (Category 3 or stronger) making landfall in the United States. The last major hurricane to make landfall in the U.S. was Wilma on November 24, 2005. This major hurricane drought surpassed the previous record of eight years from 1861-1868 when no major hurricane struck the coast of the United States. On average, a major hurricane makes landfall in the U.S. about once every three years.
The Accumulated Cyclone Energy (ACE) index of tropical cyclone activity also indicated an above-average season in the North Atlantic. The ACE index is used to calculate the intensity of the hurricane season and is a function of the wind speed and duration of each tropical cyclone. The 2016 Atlantic hurricane season had an approximate ACE of about 129 (x104 knots2) which was about 40 percent above the 1981-2010 mean value of 92 (x104 knots2) and the highest since 2012. Three cyclones (Gaston, Matthew and Nicole) produced more than 70 percent of the seasonal ACE. Matthew was the strongest hurricane of the season with maximum sustained winds of 160 mph (Category 5 strength) and a central minimum pressure of 934 mb.
East Pacific Basin
2016 Season Summary:
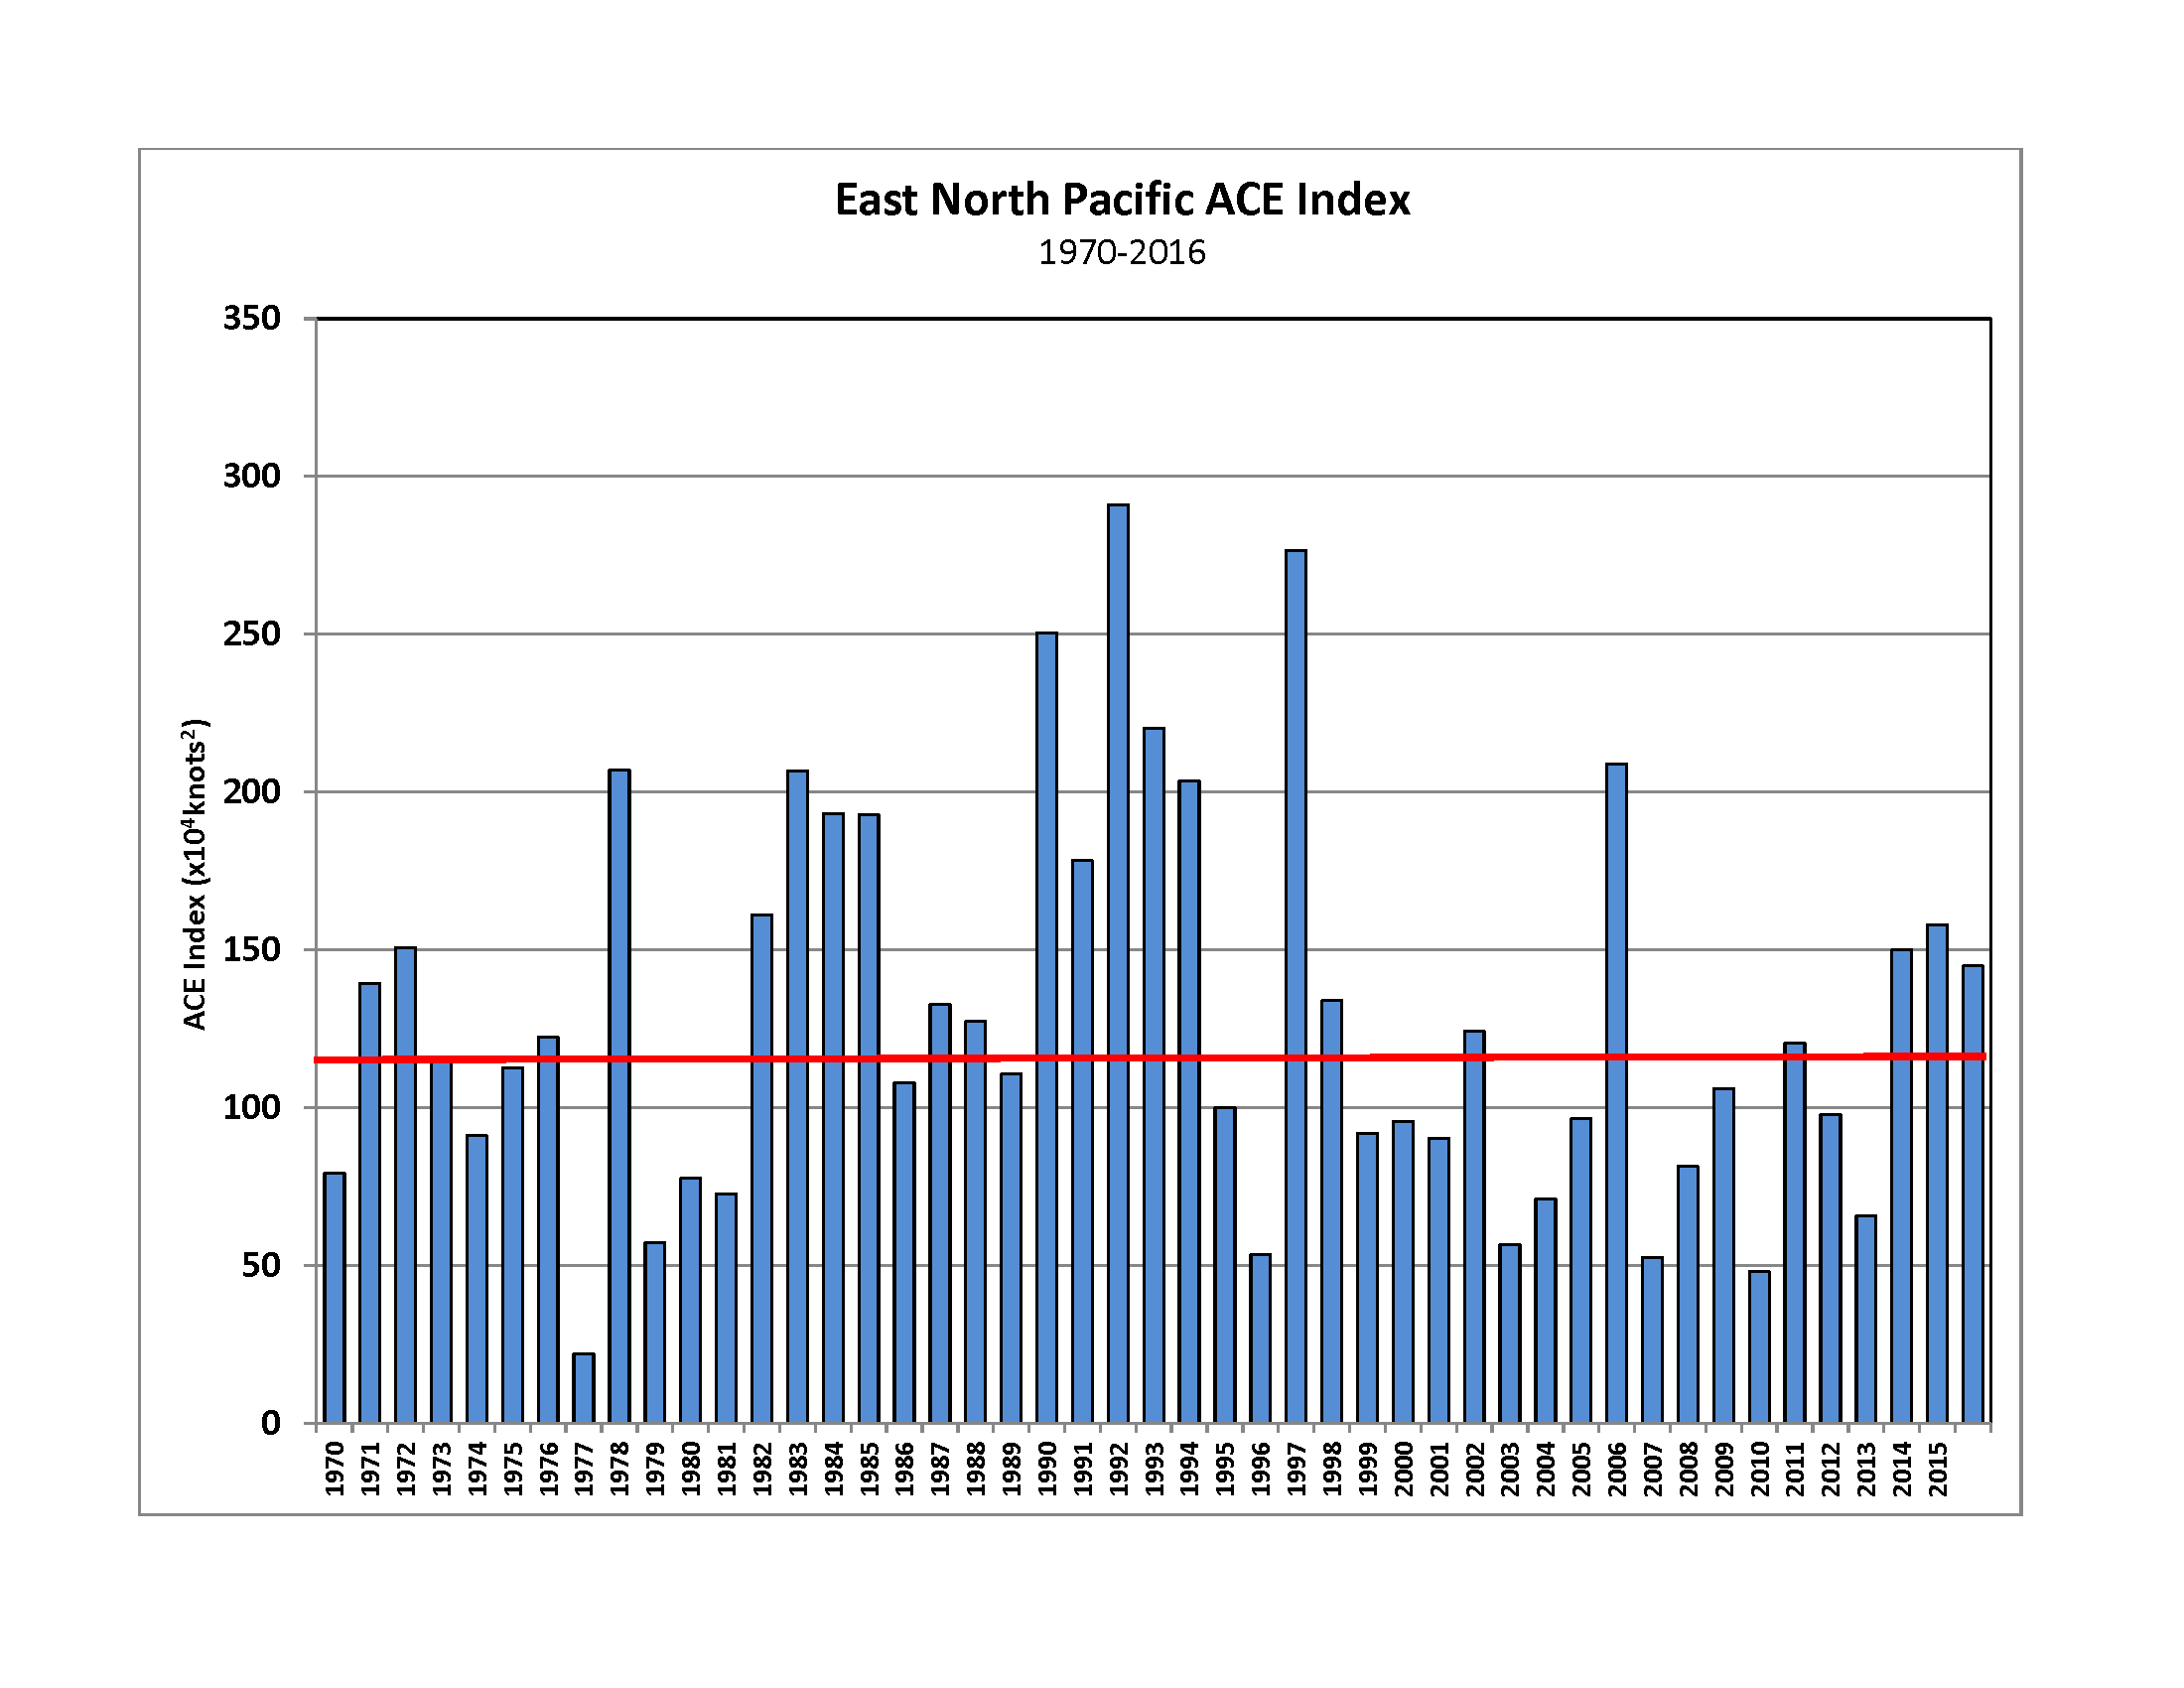
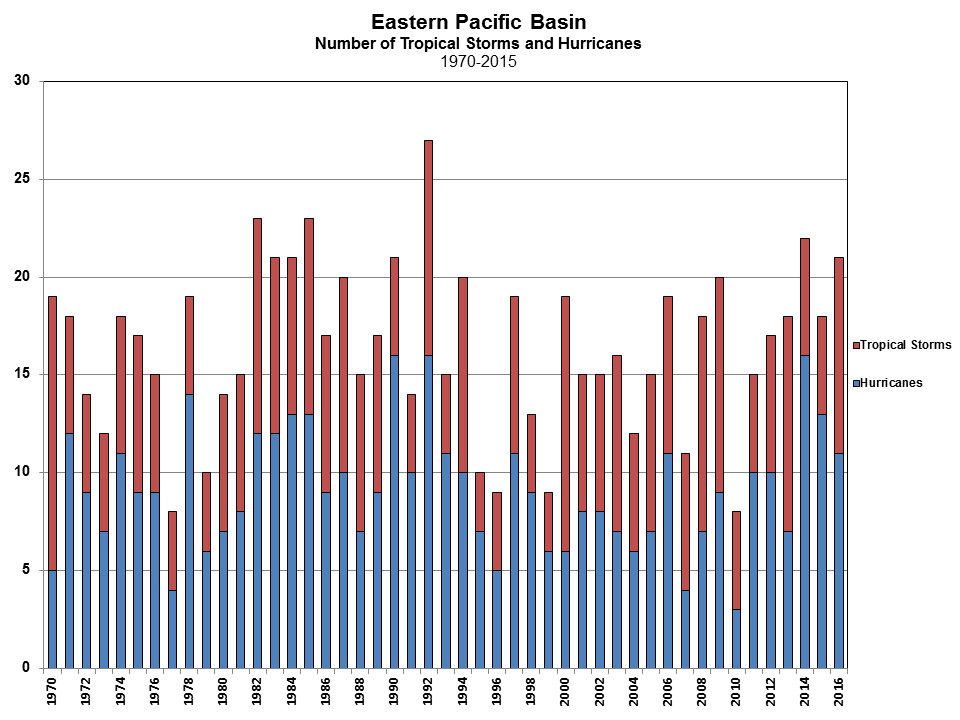
The 2016 East Pacific hurricane season had 21 named storms, including 11 hurricanes, five of which became major. The 1981-2010 average number of named storms in the East Pacific is 16.5, with 8.9 hurricanes, and 4.3 major hurricanes. It is noteworthy that from July through September there were 18 named storms, the most for any 3-month period.
The Central Pacific had seven named storms, three of which were hurricanes and two of which were major hurricanes. Tropical storm Darby became the second tropical cyclone in three years to make landfall in Hawaii - only the fifth landfalling cyclone since records began in 1949.
The ACE index for the East Pacific basin during 2016 was 145 (x104 knots2), which about 44 percent above the 1981-2010 mean of 104 (x104 knots2).
Monthly Tornadoes Report
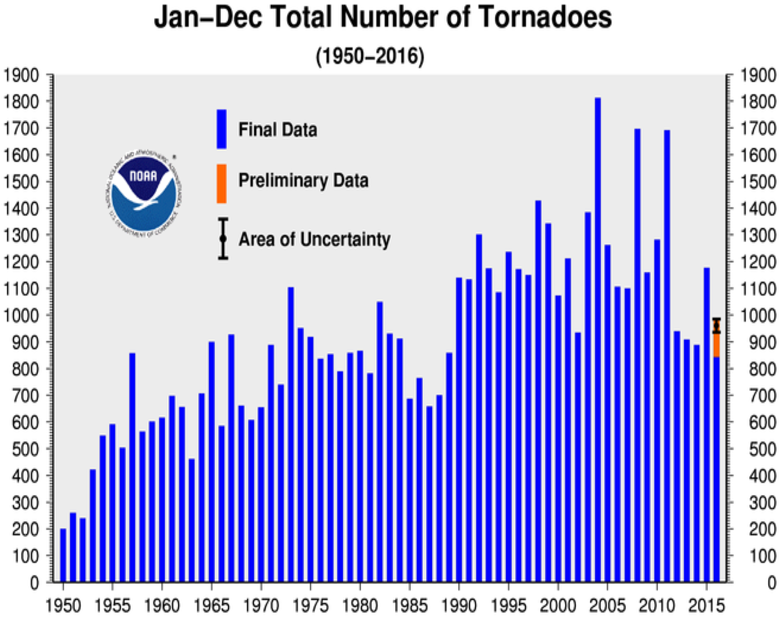
2016 Tornado Occurrences
Source: SPC
Similar to the previous four years, tornado activity across the U.S. during 2016 was below average. During January-August, there were 843 confirmed tornado reports, with 142 reports still pending for September-December. This brings the 2016 preliminary tornado count to 985, with the final count expected to be lower. As with most years, there were several large and destructive tornado and severe weather outbreaks during 2016. The deadliest tornado outbreaks of the year occurred in late February and in November, with strong tornadoes striking across the South, killing seven and five people, respectively. In 2016, there were eight severe weather outbreaks that caused damages exceeding one billion U.S. dollars.
There were 17 tornado-related fatalities in 2016, much lower than the long-term average. The deadliest single tornado of the year occurred in Louisiana and Mississippi on February 23rd, when an EF-3 killed six people. Another EF-3 occurred on November 29th in Alabama, resulting in five fatalities. May was an active month with 216 confirmed tornadoes. Of those, there were 2 EF-4's, one reported on May 9th and May 25th. Additional information on individual outbreaks is available in our monthly tornado reports.
With the exception of February, each month had a near- to below-average number of tornadoes. In February, there were 102 confirmed tornadoes, above the 1991-2010 average of 29. In June, there were 86 confirmed tornadoes, much less than the average of 243.
At a statewide level, the number of tornadoes for the year was at least double the average in Alabama (87 vs 44) and Indiana (40 vs 22), but less than half in North Carolina (16 vs 31), South Dakota (16 vs 36) and Tennessee (10 vs 26).
For additional information on specific tornado and severe weather events during 2016, please visit our monthly reports, the Billion Dollar weather disasters report, the Storm Events Database, and NOAA's Storm Prediction Center.
Regional Highlights
These regional summaries were provided by the six Regional Climate Centers and reflect conditions in their respective regions. These six regions differ spatially from the nine climatic regions of the National Climatic Data Center.
- Northeast Region: (Information provided by the Northeast Regional Climate Center)
- There were several notable events in the Northeast during 2016. A blizzard dropped up to 42 inches (107 cm) of snow on parts of the Northeast from January 22 to 24. Seven of the Northeast's 35 major airport climate sites had their greatest one-day snowfall on January 23. In fact, five sites received more snow on that one day than they normally get in an entire snow season. Winds gusted up to 75 mph (34 m/s), causing blizzard conditions for up to nine hours. Several sites along the New Jersey and Delaware coasts saw record or near-record high water levels, which resulted in flooding, beach erosion, and millions of dollars in damage. Other impacts included thousands of cancelled flights, numerous impassable roads, power outages, collapsed roofs, and schools closures for up to a week. The storm was given a preliminary value of 17.758 on the National Centers for Environmental Information's Regional Snowfall Index scale, making it a category four (crippling) storm and the sixth highest ranked storm for the Northeast.
- Arctic air along with clear skies, light winds, and snow cover led to frigid temperatures, particularly in New York and New England in early April. On April 4 and 5, temperatures were up to 30 degrees F (16.7 degrees C) below normal, with a few sites having their all-time coldest April temperature on record. The cold spell significantly damaged some fruit crops that had budded early.
- There were two significant extreme rainfall and flooding events during summer. Portions of southern West Virginia had their all-time wettest day on record and their all-time wettest month on record when at least 8 inches (203 mm) of rain fell from June 23 to 24. Major flooding occurred when several waterways had record or near record high water level. This resulted in more than 1,000 homes being severely damaged or destroyed, roads being washed away, tens of thousands losing power, and numerous water rescues. With 23 fatalities, it was the third deadliest flooding event in the state. On July 30, nearly 6 inches (152 mm) of rain fell in two hours in central Maryland. Data showed the Patapsco River rose 13.13 feet (4 m) in 1.5 hours, causing significant flash flooding and damaging numerous buildings and hundreds of vehicles. Both the West Virginia and Maryland rainfall amounts qualified as 1,000-year events, meaning rainfall of that magnitude has a 0.1% chance of occurring in a given year.
- Significant lake-effect snow fell south and east of Lake Ontario from November 20 to 22. Numerous sites received more than a foot (0.3 m) of snow, with the greatest storm total of 54.5 inches (138.4 cm) in Oswego County, New York. The November 19-22 snowfall ranked as the greatest four-day total on record for Binghamton (27.6 inches, 70.1 cm) and the greatest four-day total for November for Syracuse (25.1 inches, 63.8 cm). It was the second snowiest November on record for Binghamton and the fourth snowiest on record for Syracuse. The winds and snow contributed to power outages, road closures, and numerous accidents.
- For more information, please go to the Northeast Regional Climate Center Home Page.
- Midwest Region: (Information provided by the Midwest Regional Climate Center)
- There were no tornado deaths in the nine-state Midwest region in 2016. This is just the third such year (1970, 1989, 2016) in Storm Prediction Center records that date back to 1950. Despite the lack of tornado deaths, there were Midwest weather related fatalities due to thunderstorm winds, flooding, and traffic accidents.
- The year began with 14 straight weeks lacking any Midwest drought, the longest such streak in the history of the US Drought Monitor that dates back to 2000. Drought emerged in late summer affecting much of Ohio and parts of Indiana and Michigan. Following heavy rains in Kentucky in the summer, the fall was quite dry in Kentucky and drought emerged and quickly intensified there. Fall forest fires were numerous and large in eastern Kentucky due to the abundant fuels and dry conditions. A wet December in Kentucky led to the elimination of drought in the state by the end of the year. As the year wrapped up, just over 1 percent of the region was in drought limited to two small areas of southern Missouri. Midwest drought extent peaked at just over 11 percent of the region in November. The region had been free of severe drought since May of 2015 until two small areas cropped up in July and August but in each case they only lasted for one week. From November to mid-December, severe drought and a small amount of extreme drought affected the southeastern part of the region. This extreme drought was the first occurrence of extreme drought in the region since 2013.
- Much of the Midwest had a good growing season with good crop conditions for both corn and soybeans. The main exception was in Ohio and Michigan where summer heat and dryness affected crop conditions negatively. Wet conditions at times in some locations had significant effects on field work but overall the conditions were favorable.
- Flooding from heavy rains in December 2015 continued into January of 2016. River levels in Illinois and Missouri in particular were problematic but dropped back below flood levels early in the year. Very heavy rains in 2016 affected the tri-state area of Iowa, Minnesota, and Wisconsin on multiple occasions leading to record annual precipitation totals in this area. Many stations had exceeded their previous record a month or more before the end of the year. Another heavy rain event hit western Kentucky in July with totals topping 15 inches (381 mm) at multiple stations in the area.
- The first fall freeze in the Midwest was later than normal in 2016 for most locations. In most locations the first freeze occurred two to four weeks later than the median date for a first freeze. After a warm fall and late first freeze, an Arctic blast in mid-December brought the coldest December temperatures since 2013 (and it some cases much longer) to most Midwest locations.
- A hard freeze in western and southern Wisconsin in mid-May caused damage to fruit trees. Many trees had blossomed before the hard freeze and 10 counties in Wisconsin were declared natural disasters.
- For further details on the weather and climate events in the Midwest, see the weekly and monthly reports at the Midwest Climate Watch page.
- Southeast Region: (Information provided by the Southeast Regional Climate Center)
- For more information, please go to the Southeast Regional Climate Center Home Page.
- High Plains Region: (Information provided by the High Plains Regional Climate Center )
- Bismarck, North Dakota: earliest 70.0 degrees F+ (21.1 degrees C) temperature on record, February 27 (period of record 1875-2017)
- Casper, Wyoming: earliest 100.0 degrees F (37.8 degrees C) temperature on record, June 21 (period of record 1939-2017)
- Colorado Springs, Colorado: earliest 100.0 degrees F+ (37.8 degrees C) temperature on record and tied for highest temperature on record of 101.0 degrees F (38.3 degrees C), June 21 (period of record 1894-2017)
- Dodge City, Kansas: latest 100.0 degrees F+ (37.8 degrees C) temperature on record, October 17 (period of record 1874-2017)
- Manhattan, Kansas: latest first fall freeze on record, November 12 (period of record 1893-2017)
- Grand Island, Nebraska: 2nd highest 1-day snowfall total of 17.0 inches (43 cm), February 2 (period of record 1895-2017)
- Lander, Wyoming: 3rd highest 1-day precipitation total of 3.35 inches (85 mm), May 7 (period of record 1891-2017)
- Wichita, Kansas: 3rd highest 2-day precipitation total of 8.85 inches (225 mm), September 8-9 (period of record 1888-2017)
- Pueblo, Colorado: tied for 4th longest streak of no measurable precipitation (defined as less than 0.01 inches), 63 days ending November 16 (period of record 1888-2017)
- Severe Weather on the Plains: During May 7-10, severe weather that included tornadoes, high winds, and large hail impacted Colorado, Nebraska, and Kansas. For example, a nearly stationary severe thunderstorm produced hail up to 4.25 inches (11 cm) in diameter and damaged homes and vehicles in Lincoln, Nebraska. This storm system also impacted parts of the Midwest. Damage was costly, as it made the Billion-Dollar Weather and Climate Disasters list for 2016.
- Black Hills Drought: Drought began to develop during late spring in the Black Hills region of South Dakota extending westward into northeastern Wyoming. Warm, dry conditions in June exacerbated the drought, and it continued to intensify throughout the summer. Despite some relief during the late summer, warm and dry fall conditions caused the drought to re-intensify. This area was impacted by wildfires, low productivity of rangeland, reductions in livestock, hay losses, and water quality/quantity issues.
- Flooding in South-Central Kansas: A moist atmosphere combined with several upper-level disturbances to produce training storms and flooding in south-central Kansas from September 7-10. Rainfall rates of 3.00-5.00 inches (76-127 mm) per hour were reported, which resulted in flooding that led to numerous roads being closed, stranded vehicles, and water rescues. Several rivers and streams swelled out of their banks, and a record-high crest occurred on the Ninnescah River near Belle Plaine. Over a foot of rain fell in the city of Clearwater.
- Cottonwood Fire: Persistent drought and especially warm weather in October created ideal conditions for a fire to spread rapidly near Cottonwood, South Dakota. The fire burned 41,360 acres of private, state, and national grassland property, and hay and cattle were lost as well. This fire ended up becoming the largest October wildfire and 5th largest wildfire on record in South Dakota's history.
- Record Crop Yields: Ideal weather and field conditions led to an excellent year for several crops. Record-high yields are projected for corn, soybeans, and sugar beets. Above-normal temperatures, a long growing season, the lack of widespread drought, and timely rainfall were all contributing factors.
- Christmas Storm: A large storm system tracked across the region on December 25-26 bringing a variety of weather conditions, including snow, freezing rain, high winds, and thunderstorms. Blizzard conditions occurred in western and central North Dakota, and to the south and east, freezing rain impacted southeastern North Dakota and northern South Dakota. The ice storm caused a power outage that affected thousands of people. In the southern part of the region, this same storm system brought thunderstorms, hurricane-force winds, and tornadoes to southern Nebraska and northern Kansas.
- For more information, please go to the High Plains Regional Climate Center Home Page.
- Southern Region: (Information provided by the Southern Regional Climate Center)
- In January, a winter storm caused heavy losses for Texas dairy and cattle ranchers. An estimated 30,000 dairy cows died as a result of the heavy winds and snow.
- On February 23, 2016, a cold front spawned a deadly tornadic outbreak in south eastern Louisiana. The outbreak produced thirteen twisters, three of which were rated EF2 and one EF3. The tornadoes damaged hundreds of homes and left thousands without power for several days. Two Louisiana residents and one resident from Mississippi died and dozens were injured. One of the tornadoes decimated the Sugar Hill Recreational Vehicle Park in Convent, Louisiana, destroying almost all of the trailer homes in the area.
- In March, a record setting upper-level low pressure system situated over north eastern Mexico, combined with record setting levels of precipitable water in the atmosphere resulted in a flooding event over northern Louisiana. The rainfall event occurred over the period of March 9 through March 12. The city of Monroe, Louisiana received over 21 inches (533.40 mm) of rainfall, approximately half of which occurred on March 9. The rainfall caused excessive flooding in the Monroe area. In Ouachita parish approximately 10,000 homes were damaged. Flooding also occurred in Alexandria, and as far south as Tangipahoa and Livingston Parishes. In the case of Tangipahoa Parish, approximately 1500 homes were flooded. The rainfall also led to record level stages on dozens of rivers, including the Sabine River. High waters on the Sabine river traveled southward toward Lake Charles, Louisiana. Due to the record stages along the river, Interstate 10 was closed near the Texas/Louisiana border from March 15-19.
- In April, heavy rainfall flooded the city of Houston, with stations reporting between 10 and 15 inches (254.00 and 381.00 mm) of rainfall. Hundreds of residents were forced to evacuate and approximately 1200 had to be rescued. In mid April, a hail storm in San Antonio caused over one billion dollars in damage. Thousands of homes and approximately 110,000 automobiles were damaged.
- May saw more flooding in Texas, leading to six fatalities in Palestine, Texas, and one in Austin, Texas. Thousands of people were forced to evacuate. The station at Brenham, Texas reported 20.5 inches (520.7 mm) in a single day. Other flooding included Lake Medina, which saw its storage reach full capacity for the first time since 2008 and dumping water as high as 4 feet (0.30 m) above its spillway.
- There was even more flooding in Texas during the first few days of June. In northern Texas, sixteen people died due to flooding in northern Texas. Of those killed, nine of them were Fort Hood soldiers, who were trapped under their truck which flipped and went under the floodwaters.
- In August, a semi-stationary and well organized low pressure system produced historic flooding in south and east central Louisiana. The rainfall event occurred over the period of August 11-14. Rainfall totals for the event ranged from roughly 15 inches (381.00 mm) in the Baton Rouge, Louisiana area, to over 20 inches (508.00 mm) in Lafayette, Louisiana. The highest rainfall totals were observed near Watson, Louisiana, where over 30 inches (762 mm) of rainfall was recorded. As a result of the heavy rains, approximately 30,000 residents were evacuated by first responders. Another thousand residents and pets were rescued by local volunteers who own boats. These volunteers were were nicknamed the Cajun Navy by local media. A total of thirteen people died as a result of the flooding and approximately 150,000 homes were damaged. Dozens of roads highways were closed for days as were many schools and colleges. It was estimated that roughly one quarter of a million children were out of school, some of them were out for weeks. The flood is estimated to have caused over eight billion dollars in damage and is considered the worst US natural disaster since Hurricane Sandy.
- The fall months of September, October and November saw temperatures rise well above normal, and unlike the summer, conditions were excessively dry. These two ingredients created a perfect recipe for drought in the Southern Region. During September and October, many stations went weeks without seeing a drop of rainfall. By the end of October, approximately 42 percent of the region was experiencing drought, with Mississippi having 100 percent coverage. In Tennessee, as of October 23, 2016, 57 percent of pasture and rangeland was in poor to very poor condition. As of October 26, 2016, 15 counties in south eastern Tennessee had been given primary disaster designation by the USDA Secretary. Burn bans were issued in both Tennessee and Mississippi. In Mississippi, over 700 wildfires were reported by the Mississippi Forestry Commission. By the end of November, all of Louisiana, Mississippi and Tennessee were showing 100 percent drought coverage, with over thirteen percent of the region experiencing extreme drought or worse. The latter was mostly restricted to Mississippi and east and central Tennessee. December rains helped alleviate drought conditions. By the end of the year, all extreme and exceptional drought was eliminated from the eastern portion of the region. As of January 3, 2017, only 27.69 percent of the region is experiencing drought and only 1.11 percent is in extreme drought. The latter is confined to a few counties in eastern Oklahoma.
- For more information, please go to the Southern Regional Climate Center Home Page.
- Western Region: (Information provided by the Western Region Climate Center)
- February 15-19: Warm weather triggers snowmelt, flooding in central Washington and eastern Nevada: Minor to moderate flooding was observed along the Yakima River and its tributaries in response to snow melt triggered by anomalously warm temperatures. In eastern Nevada, well-traveled rural roads in Elko County saw minor to moderate flooding due to snow melt. Flooding is not uncommon in these areas, but is typically a springtime phenomena.
- February 18: Avalanches in Lake Tahoe area: Following 2+ feet (61+ cm) of new snowfall dangerous avalanche conditions were present in the Sierra Nevada in the vicinity of Lake Tahoe. Two vehicles were partially buried on Alpine Meadows Road and several ski resorts were closed or delayed in opening due to avalanche hazards.
- March 13: Strong wind storm impacts western Washington: Winds in excess of 50 mph (80 kph) trees and power lines, caused damage to and closure of major roads, and resulted in one death due to a falling tree. Approximately 250,000 people were without power at the height of the storm.
- Spring: Many locations in Alaska experienced early breakup of river ice, with some locations seeing record early breakup. Rural Alaskans depend of frozen rivers for travel and 2016 saw unprecedented open water compared to any previous year.
- June-October: Large and/or destructive fires in the West: During the summer season, many large and in some cases destructive wildfires impacted the West, especially California. A few highlights: Alaska: McHugh Fire- began July 19, burned 778 acres (315 hectares). The fire disrupted travel on the Seward Highway and smoke from the fire blanketed Anchorage for several days. Arizona: Cedar Fire- began June 15, burned over 45,000 acres (18,000 hectares) in eastern Arizona.
- California: Erskine Fire- began June 23, burned over 48,000 acres (19,000 hectares) in central California, destroyed 285 homes. Soberanes Fire- began July 22, burned 132,000 acres (53,000 hectares) in coastal central California, destroyed 57 homes. Blue Cut Fire- began August 16, burned over 36,000 acres (14,500 hectares) and destroyed 105 homes. Idaho: Pioneer Fire- began July 18, burned over 188,000 acres (76,000 hectares); largest wildfire on forest service lands in 2016. Nevada: Hot Pot Fire-began July 2, burned over 122,000 acres (49,000 hectares) in a week. The fire grew at a rate of 10,000 acres (4,000 hectares) per hour during a period of strong winds on July 2-3. Little Valley Fire- began October 14, burned 2300 acres (930 hectares) and destroyed 23 homes.
- June 28-29: Monsoon-related flooding in Arizona and Nevada: Extensive flooding occurred in several parts of Arizona in association with monsoon thunderstorms. Flagstaff's Southside neighborhood in particular saw heavy flooding and street closures. Runoff and debris from the Cedar Fire contributed to flooding and road closures in Cedar Creek in east-central Arizona. Las Vegas, Nevada, also observed heavy precipitation and flooding resulting in several rescues and road closures.
- September 12-13: Flooding on windward side of Maui, Hawaii: Tropical moisture interacting with an upper level low-pressure system produced heavy rainfall. Some areas of windward Maui observed 5+ in (127+ mm) of rainfall during the event resulting in damaging floods, mudslides, and rockfalls that blocked roads and inundated homes.
- October 14: Tornado outbreak along Oregon Coast: Many locations in the Pacific Northwest experienced wind gusts in excess of 80 mph (36 m/s) ahead of a potent storm system. A rare tornado outbreak occurred along coastal Oregon. One tornado, an EF2 near Manzanita, Oregon, damaged over 100 structures.
- December 9-10: Atmospheric river impacts Sierra Nevada and western Nevada: A warm winter storm brought heavy snow and then rain to the Sierra Nevada, with snow levels rising above 8,000 ft (2400 m). This created dangerous avalanche conditions; one death was reported at the Mount Rose Ski Resort. The Truckee River reached minor flood stage and minor flood impacts were reported in the region.
- For more information, please go to the Western Regional Climate Center Home Page.
The Northeast had its third warmest year on record. The region's average temperature for 2016 was 49.3 degrees F (9.6 degrees C), which was 2.1 degrees F (1.2 degrees C) above normal. All twelve states ranked 2016 among their top seven warmest years on record: second warmest for Connecticut and Rhode Island; third warmest for New Jersey, New York, and Pennsylvania; fourth warmest for Massachusetts and West Virginia; fifth warmest for Delaware, New Hampshire, and Vermont; sixth warmest for Maine; and seventh warmest for Maryland. Average temperature departures for the states ranged from 1.7 degrees F (0.9 degrees C) above normal in Maryland to 2.4 degrees F (1.3 degrees C) above normal in Connecticut. 2016 was the warmest year on record for LaGuardia Airport, New York and Concord, New Hampshire. Winter 2015-16 was the second warmest on record for the Northeast with an average temperature of 31.4 degrees F (-0.3 degrees C), 5.4 degrees F (3.0 degrees C) above normal. The six New England states each had a record warm winter, while New Jersey and New York both had their second warmest winters. Eight of the region's 35 major climate sites also had a record warm winter. In July, Hartford, Connecticut and Scranton, Pennsylvania had their all-time greatest number of days with a high of at least 90 degrees F (32 degrees C). The Northeast had its warmest August on record with an average temperature of 71.8 degrees F (22.1 degrees C), 3.7 degrees F (2.1 degrees C) above normal. Connecticut, Delaware, Maryland, Massachusetts, New Jersey, New York, Pennsylvania, and Rhode Island were all record warm, while West Virginia had its second warmest August on record. Fifteen of the region's 35 major climate sites had a record warm August. Connecticut had a record warm summer, while Maryland, Rhode Island, New Jersey, and Pennsylvania had their second warmest. Williamsport, Pennsylvania and Bridgeport, Connecticut also had a record warm summer. The Northeast had its third warmest September on record with an average temperature of 64.5 degrees F (18.1 degrees C), 3.9 degrees F (2.2 degrees C) above normal. Dulles Airport, Virginia and Worcester, Massachusetts had their warmest Septembers on record. It was the third warmest autumn on record for the Northeast with an average temperature of 52.8 degrees F (11.6 degrees C), 2.9 degrees F (1.6 degrees C) above normal. West Virginia had its second warmest autumn on record, while Delaware, Maine, Maryland, Pennsylvania, and Rhode Island had their third warmest. LaGuardia Airport, New York; Washington National, D.C.; and Bridgeport, Connecticut had their warmest autumn on record.
The Northeast wrapped up 2016 with 40.32 inches (102.41 cm) of precipitation, 91 percent of normal. Ten states were drier than normal, with Connecticut having its sixth driest year on record and Massachusetts having its tenth driest. For the dry states, precipitation ranged from 74 percent of normal in Connecticut to 96 percent of normal in Maryland. West Virginia and Delaware were the two wet states at 101 percent of normal and 106 percent, respectively. Williamsport, Pennsylvania and Kennedy Airport, New York had their driest spring season on record, while Boston, Massachusetts had its driest summer on record. It was the third wettest September on record for Delaware. As for snowfall, winter 2015-16 was the least snowy on record for Binghamton, NY and Albany, NY. In addition, Binghamton, New York had its least snowy season (October through May) on record.
Below-normal precipitation and above-normal temperatures contributed to intensifying drought conditions in 2016. In August, extreme drought was introduced in parts of New York and New England for the first time since Drought Monitor data began in 2000. From mid-October through mid-December, more than half of the Northeast was in a drought. Seven Northeast states had drought advisories, watches, or warnings in place, some for the first time in more than a decade. Groundwater levels were at record or near record low levels. Hundreds of shallow, private wells went dry. Reservoir levels were also below normal. Hundreds of water suppliers had water bans and/or restrictions in place. Worcester, Massachusetts's reservoir system was at 50.1 percent of capacity as of November 1, which was the lowest November 1 level since 1966. Data from the New Jersey Water Supply Authority showed that the water level of the Round Valley Reservoir fell to a record low on November 28 and 29. Streamflow was also at record or near record low levels. For example, data from USGS indicated more than 60 waterways in the Northeast (with at least 30 years of data) had record or near-record low seven-day average streamflow in mid-September. Portions of waterways were closed to fishing to protect stressed fish. In Massachusetts, fish were stuck along portions of some rivers and there had been a higher rate of fish kills as of early October. Low flow along the Delaware River allowed salt water to travel 21 miles (34 km) upstream from its normal location for December. The agriculture industry also suffered. Topsoil was the driest it has been in the past 20 years, with southern New England having the greatest percent of topsoil rated short to very short in the country in mid-August. Yields of hay, corn, and soybeans were below average. In Massachusetts, all crops showed some loss, with significant losses of hay, cranberries, and potatoes. Pasture conditions were also the worst they have been in 20 years. With poor pastures and hay shortages, farmers had to buy feed or move animals to market early. Some surface wells and other water sources for livestock and irrigation dried up, with some farmers hauling in water. Farmers in many drought-stricken counties became eligible for federal assistance. The dry conditions also contributed to increased fire activity and made wildfires more difficult to control.
Significant Events for 2016Annual averaged temperatures in the Midwest were well above normal. The region as a whole averaged 2.6 degrees F (1.4 C) above normal ranking it as the 4th warmest year (records began in 1895). The warmth was fairly consistent throughout the year with each season above normal. March and fall (September through November) were particularly warm with all four months among the warmest 10 percent of the historical record. Only April, May, and December were at or slightly below normal. March and November averaged more than 6 degrees F (3.3 C) above normal, September and October averaged over 4 degrees F (2.2 C) above normal, and February, June, and August were at least 2 degrees F (1 C) above normal. The states were all well above normal as well, all nine states ranked 3rd to 6th in their respective histories for the year. Seven months had statewide values in the warmest 10 percent. February (1 state), March (all 9 states), June (2), August (5), September (7), October (6), and November (8) all had at least 1 state among the warmest 10 percent. All nine Midwest states had multiple months ranking among the warmest 10 percent: Michigan had 6 months, Indiana and Kentucky had 5, Minnesota had 2, and other 5 states had 4 such months.
Precipitation was generally on the wet side in 2016 for the Midwest but there were exceptions. August was the wettest on record for the region and July was 4th wettest. January was the 13th driest, just outside the driest 10 percent, and June and November were also in the driest 33 percent of the 122 year record. Wisconsin and Minnesota received about 120 percent of normal precipitation for the year, ranking each state as the 2nd wettest in its history (1895-2016). Michigan and Iowa were about 110 percent of normal in 2016, ranking them 10th and 18th. Illinois, Indiana, and Kentucky were just slightly above normal while Ohio (95 percent of normal) and Missouri (92 percent) were slightly drier than normal. October in Kentucky (ranked 11th) and November in Ohio (also 11th) were the only statewide monthly values that ranked among the dries 10 percent. Only Ohio failed to record a single month among the wettest 10 percent. Minnesota had five months in the wettest 10 percent (March, July, August, September, and December). New annual precipitation records were set in dozens of locations in Iowa, Minnesota, and Wisconsin. A new statewide record for precipitation in Minnesota was set at Waseca with 56.24 inches (1428 mm). Station records were also set at Minneapolis, Minnesota and LaCrosse, Wisconsin where records extend back to before 1881.
Significant Events for 2016The top 10 weather and climate extremes that occurred across the region during the year are designated with "Extreme" in parentheses. The numbers associated with each extreme are used as identifiers rather than rankings.
Mean temperatures were well above average across much of the Southeast region, including Puerto Rico and the U.S. Virgin Islands, during the year (Extreme #1). The greatest departures in mean temperature were generally found across portions of northern and central Alabama, northern and coastal Georgia, the Florida Panhandle, southern and western South Carolina, and western North Carolina. Annual departures were 3 to 4 degrees F (1.7 to 2.2 degrees C) above average in these areas, primarily due to persistent warmth during the summer and autumn. At least 23 long-term (i.e., period of record equaling or exceeding 50 years) stations across the region observed or tied their warmest annual mean temperature on record. Two or more of these stations were located in every state except Virginia, including Montgomery, AL (68.6 degrees F; 20.3 degrees C), Atlanta, GA (65.9 degrees F; 18.8 degrees C), Pensacola, FL (70.8 degrees F; 21.6 degrees C), Greenville-Spartanburg, SC (63.4 degrees F; 17.4 degrees C), and Asheville, NC (58.4 degrees F; 14.7 degrees C). In Puerto Rico, Juncos 1 SE (1931-2016) observed its second warmest annual mean temperature on record (79.5 degrees F; 26.4 degrees C). A greater number of long-term stations (38) observed average minimum temperatures that were ranked within the top 2 warmest values on record, compared to 27 stations for average maximum temperatures. The persistence of daytime heat and nighttime warmth was exceptional for many locations, particularly during the summer and autumn (Extreme #2). At least 8 long-term stations observed their highest annual count of days with a maximum temperature at or above 90 degrees F (32.2 degrees C), including Montgomery, AL (1873-2016), with 129 days (35 percent of the year), and Charleston, SC (1939-2016), with 98 days (27 percent of the year). Ending on August 19th, Athens, GA (1903-2016) recorded its longest streak of 52 consecutive days with a maximum temperature of at least 90 degrees F. Atlanta, GA (1879-2016) and Birmingham, AL (1897-2016) observed their highest annual count of 106 (29 percent of the year) and 104 (28 percent of the year) days with a minimum temperature at or above 70 degrees F (21.1 degrees C). Ending on August 23rd, Wilmington, NC (1875-2016) recorded its longest streak of 58 consecutive days with a minimum temperature of at least 70 degrees F. San Juan, PR (1899-2016) and Tampa, FL (1891-2016) observed their highest annual count of 268 (73 percent of the year) and 116 (32 percent of the year) days with a minimum temperature at or above 75 degrees F (23.9 degrees C). The coldest temperature observed during the year was -9 degrees F (-22.8 degrees C), which was recorded at Millgap, VA on January 25th. The warmest temperature observed during the year was 107 degrees F (41.7 degrees C), which was recorded on July 3rd at the University of South Carolina in Columbia.
A pronounced west-to-east gradient in annual precipitation totals was observed across the Southeast, with persistent drought over the interior portion of the region and heavy rainfall from tropical cyclones along much of the Atlantic coast. The driest locations were found across northern and central Alabama, northern and central Georgia, and the western Carolinas, where annual precipitation totals were 50 to 75 percent of normal. At least 22 long-term stations in these areas observed annual precipitation totals that were ranked within the three lowest values on record, including Anderson Regional Airport, SC (1949-2016) with 25.07 inches (637 mm), Elberton 2 N, GA (1892-2016) with 27.61 inches (701 mm), and Anniston Regional Airport, AL (1942-2016) with 32.13 inches (816 mm). During late summer and autumn, exceptionally long streaks of no rainfall were recorded at numerous locations across the region, particularly in Alabama and Georgia (Extreme #3). Eufaula Wildlife Refuge, AL (1967-2016), located about 75 miles southeast of Montgomery, recorded its longest streak of 91 days with no measurable precipitation, ending on November 28th. This is also the longest streak for any station in Alabama-s historical record. In southwestern Georgia, Plains Experiment Station (1956-2016) and Montezuma 2 NW (1904-2016) recorded their longest streak of 72 days with no measurable rainfall. In contrast, the wettest locations were found across portions of the eastern Carolinas, west-central and coastal Virginia, central and southern Florida, and northern and western Puerto Rico. Annual precipitation totals were 125 to 300 percent of normal in these areas. A few long-term stations observed annual precipitation totals that were ranked within the three highest values on record, including Plymouth 5 E, NC (1947-2016) with 74.83 inches (1,901 mm), Norfolk, VA (1874-2016) with 68.86 inches (1,749 mm), and Florence Regional Airport, SC (1948-2016) with 60.97 inches (1,549 mm). Five tropical cyclones (Tropical Storm Bonnie in late May, Tropical Storm Colin in early June, Hurricane Hermine in early September, Tropical Storm Julia in mid-September, and Hurricane Matthew in early October) contributed more than 30 percent of the total annual precipitation recorded at numerous coastal locations extending from Florida to Virginia. As Hurricane Matthew (Extreme #4) tracked nearly parallel to the Atlantic coastline in early October, six long-term stations in the Carolinas observed their wettest day for any month on record, and multiple stations in five states (FL, GA, SC, NC, and VA) recorded over 10 inches (254 mm) of rainfall. On October 8th, four states recorded their highest 1-day precipitation totals during the year, including 14.00 inches (356 mm) at Fayetteville Regional Airport, NC, 12.00 inches (305 mm) in Manning, SC, 11.23 inches (285 mm) in Springfield, GA, and 9.61 inches (244 mm) at Fentress Naval Field, VA. Over half (28) of the 51 reported fatalities caused by Matthew across the Southeast occurred in North Carolina, and most of these resulted from drowning in flash floods. Approximately three thousand hogs and nearly two million chickens and turkeys perished in the extreme inland flooding over eastern North Carolina. During summer, numerous heavy rainfall and flash flooding events were observed across the Southeast. On July 16th, training thunderstorms caused a significant flash flooding event in the Triangle region of North Carolina (i.e., the cities of Raleigh, Durham, and Chapel Hill), resulting in road closures and water rescues (Extreme #5). The greatest 1-day precipitation total of 7.52 inches (191 mm) was recorded by a CoCoRaHS gauge in Cary, NC. On January 22nd and 23rd, a strong coastal cyclone produced exceptional snowfall totals and blizzard conditions across northern Virginia and the Washington, D.C. area (Extreme #6). Washington Dulles Airport, VA (1963-2016) observed its second greatest 1-day and 2-day snowfall on record, with 22.1 and 29.3 inches (561 and 744 mm), respectively.
There were 4,003 severe weather reports across the Southeast during the year, which is very close to normal (based on the median annual frequency of 3,942 reports during 2000-2015). Over half (2,165 of 4,003) of these reports were observed during June and July. The fewest number of reports occurred in Florida (480; 12 percent of total), while the greatest numbers were reported in North Carolina (864; 22 percent of total) and Virginia (842; 21 percent of total). Strong thunderstorm winds accounted for over 80 percent (3,292 of 4,003) of the severe weather reports during the year and caused at least 2 fatalities and 16 injuries across the region. The highest thunderstorm wind gust recorded during the year was 87 mph, which was observed on Grandfather Mountain as a vigorous squall line moved through western North Carolina on July 8th. The largest hailstones observed during the year were tea cup-sized (3-inch diameter), with reports in Vance County, NC and Mecklenburg County, VA on February 24th, Loudoun County, VA on June 16th, and Halifax County, VA on September 28th. A total of 154 tornadoes (62 EF-0s, 70 EF-1s, 14 EF-2s, 6 EF-3s, 2 unrated) were confirmed across the Southeast during the year, which is well below the median annual frequency of 187 tornadoes for the region. Over 40 percent (64 of 154) of the tornadoes occurred in Alabama, including 9 EF-2s and 2 EF-3s. Fifty-three tornadoes, or about one-third of the annual total, were observed during February, making it the greatest February tornado count for the region since modern records began in 1950 (Extreme #7). Of the 9 fatalities and at least 89 injuries caused by tornadoes during the year, four of the fatalities and 49 of the injuries occurred in February. During a two-day severe weather outbreak on February 23rd and 24th, an EF-3 tornado touched down in Pensacola, FL, resulting in 3 reported injuries. Numerous homes and apartment buildings were significantly damaged or destroyed, and a warehouse at the local General Electric plant was demolished. Another EF-3 tornado, with a maximum path width of 500 yards, tracked 30 miles across four counties in east-central Virginia and injured at least 25 people. Fourteen fatalities resulted from lightning strikes across the Southeast, which is the highest annual count for the region since 2007, with 18 recorded fatalities (Extreme #8). Nine of the 14 fatalities occurred in Florida, including a man who was struck outside his home near Molino, FL on December 12th. This is the first December lightning fatality in the United States since 1998, when a man was struck inside a home under construction in Paradise Valley, AZ. Lightning also caused at least 37 injuries across the region during the year.
An intense and expansive drought developed across the western half of the Southeast region, with the most significant impacts occurring predominately in Alabama, Georgia, and western portions of the Carolinas (Extreme #9). Moderate (D1) drought formed initially over northern Georgia and the western Carolinas in early May, as well-below-normal precipitation amounts were observed during March and April. With a widespread lack of rainfall persisting through late spring, summer, and autumn, drought conditions continued to intensify and expand in coverage across much of Alabama, Georgia, the Florida Panhandle, the western Carolinas, and southwestern Virginia. When the peak of the drought occurred in late November, extreme-to-exceptional (D3-D4) drought conditions covered over one-third of the region, including 97 percent of Alabama, 62 percent of Georgia, 21 percent of South Carolina, and 13 percent of North Carolina. Indeed, a portion of every state in the region was classified in extreme drought for the first time since March 2008. Drought conditions improved significantly during December, as several low pressure systems generated heavy rainfall across portions of the region. Consequently, the coverage of extreme-to-exceptional drought across the Southeast decreased from 36 percent at the end of November to 21 percent in late December. Severe-to-extreme (D2-D3) drought was eliminated across southern and eastern portions of Puerto Rico by May, but moderate drought persisted in a small area of southeastern Puerto Rico until the middle of November. Dryland crops in drought-stricken parts of the region were severely stressed for much of the growing season. Substantial losses in corn yields occurred in many Alabama and Georgia fields during the latter half of summer. Farmers in these states also struggled to dig up peanuts from excessively dry fields, while agricultural producers in the western Carolinas reported reduced yields of soybeans. Pastures and hay fields across the western half of the region remained in very poor condition during summer and autumn, due to the drought and a widespread infestation of fall armyworms. Livestock producers had to sell off some cattle and feed hay from supplemental reserves during the latter half of the year. Across the interior portion of the region, the very dry forest floor coupled with seasonal leaf litter provided ideal conditions for an extraordinary number of autumn wildfires, with over 180,000 acres burned during November (Extreme #10). Thousands of residents in western North Carolina had to evacuate from several large fires, which cost the state nearly $30 million in fire suppression expenses. The wind-driven transport of wildfire smoke caused poor air quality during mid-November across a broad portion of the region, including the cities of Atlanta, GA, Asheville, NC, Charlotte, NC, and even cities farther away, such as Raleigh, NC and Charleston, SC. Respiratory issues were reported for both people and livestock in these affected areas.
The major highlight of the year was the record warmth that occurred throughout most of the High Plains, particularly in the Dakotas. Temperature departures ranging from approximately 2.0-4.0 degrees F (1.1-2.2 degrees C) above normal were experienced across most of the region, resulting in quite a few records for top 10 warmest year. A strong El Niño contributed to above-normal temperatures during the winter across the northern Plains. Warmer temperatures during winter and early spring caused mountain snowpack to suffer in Wyoming. While the summer was only slightly warmer than normal, the region experienced much-above-normal temperatures in June due to the occurrence of several heat waves. The warmth of the fall was particularly impressive, as it set several records around the region. Higher temperatures caused precipitation to fall more as rain instead of snow, which brought about a slow start to the snowpack season in the Rockies. However, the warmth extended the growing season by delaying the first fall freeze in many locations, and it also aided with harvest. The greatest below-normal temperature departures came at the end of the year, as several Arctic air masses moved through the region in December and brought some of the coldest temperatures of the year.
Precipitation varied from season to season, but most locations ended the year either slightly below or slightly above normal. However, wet conditions were somewhat more prominent, as there were several top 10 records for wettest year. Flood events were partially responsible for wetness in places such as Wichita, Kansas and Lander, Wyoming. Excessive wetness caused delays in spring planting and the emergence of various crop diseases in South Dakota, Nebraska, and Kansas. It was drier in Colorado and an area including western South Dakota and northeastern Wyoming, but the dryness was not record-breaking. While drought was a problem in a few locations throughout the year, it did not cause major impacts region-wide in 2016. In fact, conditions were favorable enough that corn, soybean, and sugar beet production were projected to hit record highs in 2016 in the U.S.
It was a very warm year across the region with widespread temperature departures of 2.0-4.0 degrees F (1.1-2.2 degrees C) above normal. The warmth was most impressive in North Dakota, as departures exceeding 4.0 degrees F (2.2 degrees C) above normal occurred in several locations. For example, Minot was an astounding 5.0 degrees F (2.8 degrees C) above normal for the year. The widespread warmth caused numerous locations in all six states of the High Plains region to be ranked in the top 10 warmest years on record and several locations in North Dakota experienced their warmest year on record, including Bismarck, Fargo, Grand Forks, and Minot.
Average monthly temperatures were especially impressive in March, June, October, and November. Average temperatures were largely influenced by warmer minimum temperatures more so than maximum temperatures. The El Niño that was present during the first part of 2016 was partially responsible for above-normal winter temperatures experienced in the northern Plains. It is worth noting that while 2016 was warm on the whole, December was quite cold for the region. Several Arctic outbreaks, including one that brought the coldest temperatures of the year to many locations, created departures of 6.0-8.0 degrees F (3.3-4.4 degrees C) below normal across the western Dakotas and northern Wyoming.
The following locations had notable temperature records during 2016:Overall, precipitation was near normal in the region for 2016. Most places received 70-130 percent of normal precipitation. Wetter locations included western and central Wyoming and pockets of North Dakota. Localized excessive wetness also occurred in south-central Kansas. Locations with notable top 5 records for wettest year included Wichita, Kansas (2nd wettest); Lander, Wyoming (3rd wettest); and Bismarck, North Dakota (4th wettest). While precipitation varied across the region during most months, April was especially remarkable due to widespread wetness. Much of the High Plains received 200-400 percent of normal precipitation during the month, and many locations had a top 5 wettest April on record.
On the dry side, there were particular areas that experienced below-normal precipitation for the year, and certain months were rather dry across the region, but the dryness was not record-breaking. The most widespread dryness occurred in June and was accompanied by above-normal temperatures, which caused topsoil to dry out and crops to become stressed. One region that was affected by conditions in June was an area encompassing the Black Hills of South Dakota and northeastern Wyoming. Warm temperatures and lack of precipitation caused drought to develop and persist throughout the summer and fall.
Snowpack peaked about two weeks earlier than normal and was slightly below average in the Missouri River Basin during the 2016 season. While snowpack fared well in Colorado, the first half of the season was disappointing in Wyoming. The Bighorn Mountains suffered the most, and the low snowpack caused drought to develop over the winter. However, snowpack did recover in Wyoming due to a wetter March and April. The early mountain snowmelt and dry conditions during the summer produced below-normal streamflows in the Upper Basin. Meanwhile, storm systems tracking across the Lower Basin resulted in high streamflows there. The disparity in streamflow between the Upper and Lower Basins did have a positive impact: the U.S. Army Corps of Engineers did not have to increase releases to meet downstream targets during the summer, which was helpful because it was a low runoff year in the Missouri River Basin. The 2017 snowpack season got off to a slow start in the Rockies, but ample snowfall in December allowed it to recover to near-normal ranges.
The following locations had notable precipitation records during 2016:For the most part, drought was not a major widespread issue in the High Plains during 2016. While there were some areas where drought persisted throughout the year, most places received enough relief to avoid prolonged, intense drought. In fact, in August the U.S. Department of Agriculture forecasted record-high corn and soybean production in 2016 due to favorable weather and field conditions. The December 27, 2016 release of the U.S. Drought Monitor indicated that nearly half of the region was experiencing drought or abnormal dryness. Much of this depiction was due to a warm and dry fall experienced by much of the region, causing many areas to begin winter with depleted soil moisture.
Three distinct areas that were impacted by drought during 2016 included the Bighorn Mountains of northern Wyoming, the Black Hills region of South Dakota extending westward into northeastern Wyoming, and an area encompassing eastern Colorado and western Kansas. An abysmal snowpack season was largely to blame for drought in the Bighorn Mountains, which persisted until September when wet conditions prevailed. The drought in the Black Hills developed rapidly in June due to warm, dry conditions and was ongoing at the end of the year. This area was impacted by wildfires, low productivity of rangeland, reductions in livestock, hay losses, and water quality/quantity issues. A warm and dry fall caused drought to develop in eastern Colorado and western Kansas. Blowing dust, dry soils, and a delay in the emergence of winter wheat were reported in these areas.
Significant Events for 2016The year 2016 proved to be an extremely warm year for the Southern Region. All six states ranked in their top five warmest years on record. The region as a whole had an average annual temperature of 65.56 degrees F (18.64 degrees C), making it the second warmest year on record. Temperatures were generally consistently above normal throughout the year. There were eight months where all six states averaged above normal temperatures. These months included February, March, April, June, July, September, October and November. For the year most stations in the region averaged between 2 to 3 degrees F (1.11 to 1.67 degrees C) above normal, and an overwhelming majority of stations averaged at least 1 to 2 degrees F (0.56 to 1.11 degrees C) above normal. The state-wide average annual temperatures are as follows: Arkansas averaged 62.78 degrees F (17.10 degrees C), Louisiana averaged 68.72 degrees F (20.40 degrees C), Mississippi averaged 66.02 degrees F (18.90 degrees C), Oklahoma averaged 62.26 degrees F (16.81 degrees C), Tennessee averaged 60.25 degrees F (15.69 degrees C), and Texas averaged 67.17 degrees F (19.54 degrees C). For the state of Mississippi, it was the second warmest year on record, while for Arkansas, it was the fifth warmest year on record. The states of Louisiana, Oklahoma, Tennessee and Texas all experienced their third warmest year on record. All records and state rankings are based on the period spanning 1895-2016.
The 2016 annual precipitation totals indicate that precipitation for the year varied spatially over the Southern Region, but the values do not provide a clear picture of how precipitation varied temporally over the year. This is mostly because many areas within the region experienced periods of wet conditions, which were interrupted with dry spells and in the case of the fall, wide-spread drought. The year started drier than normal. All six states experienced a drier than normal Jan and all states except Tennessee experienced a drier than normal February. March was an extremely wet month in which over 20 inches ( mm) fell in north central Louisiana during the period of March 8-12. In April, conditions were very wet in Texas and Oklahoma, however the remainder of the region remained relatively dry. This was also the case in May, however, only Texas and southern Louisiana experienced a wetter than normal month. Conditions in June and July were slightly drier than normal although local flooding Texas did occur. In August, a quasi-stationary and well organized low pressure system produced historic flooding over much of southern Louisiana. Stations in most of Arkansas, eastern and southern Texas, and Louisiana recorded over twice the normal precipitation. The fall saw drought conditions develop across much of the eastern half of the Southern Region, and by the end of November, drought has crept into Oklahoma and eastern Texas. Welcomed rainfall in December helped alleviate drought conditions. By the end of the year, the amount of drought had been reduced from approximately 50 percent areal coverage in the region, to just over 27 percent. The state-wide averaged annual precipitation totals are as follows: Arkansas received 51.03 inches (1296.16 mm), Louisiana received 68.03 inches (1727.96 mm), Mississippi received 54.36 inches (1380.74 mm), Oklahoma received 31.33 inches (795.78 mm), Tennessee received 47.29 inches (1201.17 mm), and Texas received 32.48 inches (824.99 mm). The state-wide precipitation rankings for the year are as follows: for Arkansas, it was the forty-sixth wettest, for Louisiana it was the twelfth wettest, for Mississippi it was the fifty-ninth driest, for Oklahoma it was the forty-forth driest, for Tennessee it was the thirty-fifth driest and for Texas it was the nineteenth wettest. All state rankings are based on the period spanning 1895-2016.
Significant Events for 2016Above normal temperatures were observed across the West this year, with departures of 0-3 F (0-1.7 C) above normal covering nearly the entire region and scattered areas of 4+ F (2.2+ C) above normal. For many locations in the West, 2016 was among the top-10 warmest years, though only a few locations saw record-breaking warmth. Above normal precipitation was observed across the northern tier of the West, with the southern portion of the region generally seeing near or below normal precipitation.
Above normal temperatures were nearly ubiquitous across the West, and the few locations that did observe cooler than normal temperatures typically had departures of less than 1 F (0.5 C) below normal. Record or near-record warm temperatures were observed in Montana and southwestern Arizona. Tucson tied 2014 for its warmest year since records began in 1894 with an average temperature of 72.1 F (22.3 C), 2.7 F (1.5 C) above normal. In southeastern Montana, average temperatures in Billings tied 2015 for second warmest on record at 50.7 F (10.4 C), 2.6 F (1.4 C) above normal. Records for Billings began in 1934. In central California, Bakersfield reported its second warmest calendar year on record at 68.2 F (20.1 C), 3 F (1.7 C) above normal.
Large areas of above normal precipitation were observed across Washington, southeastern Idaho, the northeastern Great Basin, Montana, western Wyoming, and northern California. Northeastern Montana saw the greatest departures from normal, with annual totals exceeding 150% of normal. Glasgow reported its 2nd wettest year on record at 22.95 in (583 mm), 197% of normal. Records for Glasgow began in 1948. On Washington's Olympic Peninsula, Forks reported 143.2 in (3637 mm), 120% of normal and the 9th wettest since records began in 1907. In coastal northern California, Venado, logged 102.2 in (2596 mm), 184% of normal and its wettest year since records began in 1948. A few scattered locations in the Southwest saw above normal precipitation as well, notably along the Arizona-Nevada-Utah border. Beaver Dam, Arizona, reported 11.35 in (288 mm) for 2016, 158% of normal and the 6th wettest year since records began in 1951. Drier than normal conditions (50-90% of normal precipitation) were observed across much of the Southwest, especially southern California, southwestern Arizona, and New Mexico, as well as eastern Oregon. In southwestern Arizona, Yuma reported 2.82 in (72 mm), 79% of normal. In southeastern California, Bishop received 3.43 in (87 mm), 66% of normal.
Snowpack as of April 1 2016 was near to slightly above normal across the West, with nearly all basins reporting >85% of average snow water equivalent. Snowpack at the end of calendar year 2016 was also above normal for much of the West, with the exception of a few basins in western Idaho, northern Montana, and the Sierra Nevada reporting below 75% of normal. Owing in part to a fairly healthy snowpack, improvement of drought conditions was observed in much of the West. At the start of the year, 45% of the West was experiencing moderate to exceptional drought, with extreme to exceptional drought present in much of California, western Nevada, Oregon, and western Montana. At the end of 2016, only 22% of the West was classified as experiencing drought, with all extreme to exceptional drought conditions occurring in California. Only some areas east of the Rocky Mountains and southern Arizona saw development of drought conditions this year.
Precipitation across Hawaii generally ranged from 75-125% of normal, though a few stations reported below 75%. Lihue observed only 13.39 in (340 mm) for the year, 36% of normal and the driest year since records began in 1950. Temperatures were slightly below to 1+ F (0.5+ C) above normal throughout the state. Hilo tied 1995 for its second warmest year on record at 75.6 F (24.2 C), 1.8 F (1 C) above normal. Records for Hilo began in 1949. Temperatures across Alaska were well above normal this year, with locations statewide observing record annual temperatures. Utqia'vik, on the North Slope, observed an average annual temperature of 18.9 F (-7.2 C), 7.1 F (3.9 C) above normal. In the Southwest, King Salmon recorded an average 41.7 F (5.4 C), 4.5 F (2.5 C) above normal. Both locations had their warmest year on record dating back to 1901 and 1917, respectively. Low sea ice coverage and above normal sea surface temperatures are among the primary factors responsible for above normal temperatures this year. Precipitation was variable across the state, with most locations falling within 90-110% of normal. Some Interior and North Slope locations were slightly wetter; Fairbanks reported 16.06 in (407 mm) for 2016, 149% of normal and the 9th wettest year in an 88-year record.
Significant Events for 2016NOAA works closely with the academic and science communities on climate-related research projects to increase the understanding of El Niño and improve forecasting techniques. NOAA's Climate Prediction Center monitors, analyzes and predicts climate events ranging from weeks to seasons for the nation. NOAA also operates the network of data buoys and satellites that provide vital information about the ocean waters, and initiates research projects to improve future climate forecasts.