

According to NOAA data analyzed by the Rutgers Global Snow Lab, the winter season (December 2021–February 2022), contiguous U.S. (CONUS) snow cover extent was 97,297 square miles below the 1991–2020 average and ranked 24th lowest in the 56-year period of record.
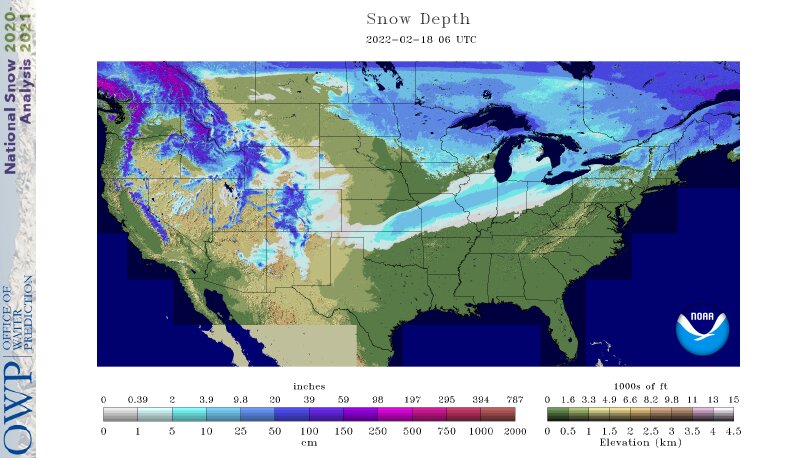
Snowfall during the 2021-2022 snow season was below average from the central and southern Rockies to the southern Great Lakes and into the Northeast in December 2021. By January, snow cover was above average across portions of the West, northern Plains, Midwest, Great Lakes and from the Appalachians to the Northeast. On January 25, near-record snowfall was reported across portions of Colorado and Kansas. Up to 27 inches of snow was reported at Mt. Sunflower, Kansas, which was just 3 inches shy of the state 24-hour record, while Boston measured 23.6 inches of snow and tied its greatest 1-day snowfall total. February remained well below-average across much of the Sierra Nevada range, southern Rockies, from the northeastern Rockies to the central Plains and across the central Appalachians. On February 18, a powerful line of convective snow showers, associated with an Alberta Clipper-type storm, traversed the Midwest with wind gusts topping 70 mph across portions of Wisconsin and Illinois. The National Weather Service issued snow squall warnings, as brief blizzard conditions accompanied the snowfall. Arctic air plunged into the central CONUS during the last week of February. Record cold daily temperatures were felt as far south as northern Mexico and wind chill values dipped below zero from Washington to Wisconsin and into the southern Plains.
December 2021 began with 10 percent of the CONUS covered by snow. On December 11, a powerful winter storm brought heavy snow across the northern Plains, Midwest, Great Lakes and Northeast, resulting in a total CONUS snowcover on December 19 of more than 31 percent. A week-long snowstorm, December 24-30, brought additional snow as snow cover peaked for the month with 40.2 percent coverage. A cold front traversed the central Plains, Great Lakes and eastern U.S. on January 2-4, as CONUS snow cover reached its maximum extent for January at 50.5 percent. On January 13-18, another cold front traversed the central and eastern U.S. and saw snow accumulate across portions of the Midwest and from the southern Appalachians into the Northeast. Maximum CONUS snow cover during this event occurred on the 17th with 43.7 percent coverage. A type of nor'easter known as a bomb cyclone, or a rapidly intensifying low pressure system, developed over the Atlantic Ocean along the East Coast on January 28-30 and brought 1-2 feet of snow and blizzard conditions along the coastline from Delaware to Maine. Approximately 39 percent of the CONUS was blanketed in snow on the 29th. A massive winter storm stretched from Texas to Maine during the first week of February and brought heavy snow, freezing rain, ice and bitter cold temperatures. Nearly 51 percent of the CONUS was covered in snow on the 4th — the maximum CONUS snow cover extent for the month. During the ensuing days, snow cover waned somewhat with several punctuated snow events on the 18th across the Midwest and from February 22-24 across the northern Plains and Midwest as well as from Arizona to Missouri. The month ended with approximtely 34 percent of the CONUS covered in snow including much of the western mountains and from the northern Plains to the Northeast.

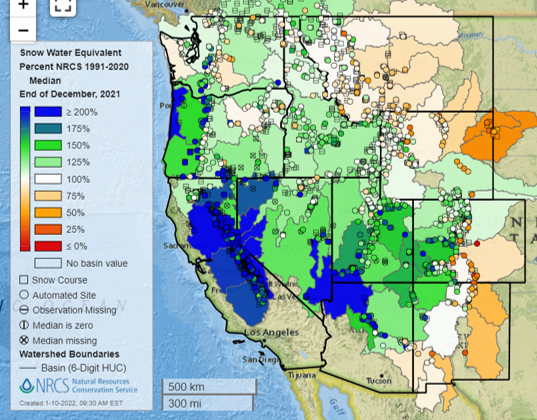
Melting of winter and spring mountain snowpack provides a crucial summer water source across much of the western United States. The total annual water budget for agriculture and human use in the mountainous West is highly dependent on the amount of snow melt that will occur in spring and is proportional to the amount of snow on the ground, which can be approximated by a measure of the snow water equivalent (SWE).
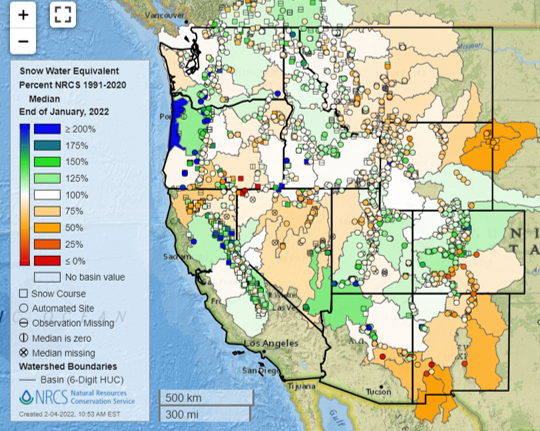
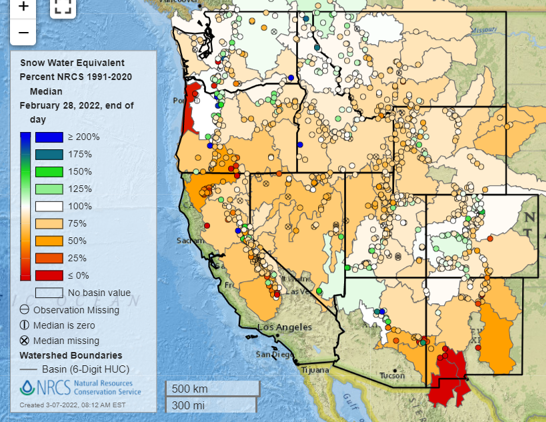
Early-season SWE values across the West were well-below median at the start of December but, by the end of December, SWE values were at or above 100 percent across most of the region with portions of the Cascades, Sierras and Great Basin reporting SWE values in excess of 200 percent of median. In January, SWE values dropped significantly across the western U.S. with near-record low precipitation for the month across California, Nevada and Utah. SWE values were near- to above-normal across parts of the Cascades, Bitterroots, Sierra Nevada range and portions of the central Rockies. Below-average SWE values were present across much of the Great Basin as well as the northern and southern Rockies. By the end of February 2022 SWE values across much of the West were less than 75 percent of median. Portions of the Cascades, Bitteroots and central Rockies had SWE values that were near the median value at the end of the month. By the end of March, for most of the basins across the West, SWE values were similar in value or deteriorated from what was observed during February.
For additional information on specific events please visit our Monthly Reports, Storm Events Database, and Billion-dollar Weather and Climate Disasters.