Note: This Synoptic Discussion describes recent weather events and climate anomalies in relation to the phenomena that cause the weather. These phenomena include the jet stream, fronts and low pressure systems that bring precipitation, high pressure systems that bring dry weather, and the mechanisms which control these features — such as El Niño, La Niña, and other oceanic and atmospheric drivers (PNA, NAO, AO, and others). The report may contain more technical language than other components of the State of the Climate series.
Summary
The Earth's ocean-atmosphere system continued in an ENSO-neutral state during May 2018. Like the last several months, the upper-level circulation was quite active this month with shortwave ridges and troughs migrating through the jet stream flow over the contiguous United States (CONUS). But all of this activity took place within a bigger picture wherein a large broadscale/long-wave ridge dominated the overarching circulation over the CONUS. The ridge was responsible for widespread much warmer-than-normal temperatures across the CONUS. Shortwave troughs and closed lows challenged the broadscale ridge, bringing above-normal precipitation to parts of the interior West, central Plains to northern Rockies, and Great Lakes, and a couple low pressure systems (one of which was Subtropical Storm Alberto) brought above-normal precipitation to the Southeast to Mid-Atlantic region. The rains helped contract drought and abnormal dryness across the Southeast and parts of the Plains. But in the parts of the country missed by the troughs and lows, the ridge inhibited precipitation, with below-normal precipitation occurring along the West Coast, much of the Southwest, parts of the Plains, much of the Mississippi and Ohio Valleys, and much of the Northeast. As a result, drought and abnormal dryness expanded or intensified in parts of the West, Great Plains, and Mississippi Valley. Drought contraction outpaced expansion, so the national drought footprint shrank a bit when compared to the beginning of May. The active troughs and lows, and their associated fronts, generated severe weather, but they were working against the broadscale ridge which generally inhibited severe weather, so the total (preliminary) tornado count was below the long-term average. The upper-level circulation, temperature, and precipitation anomaly patterns suggest that the atmospheric drivers originating in the North Atlantic (NAO) and Arctic (AO) had a controlling influence on the month's weather, but drivers originating in the North Pacific (EP-NP) mounted a defiant challenge to that control. See below for details.
Synoptic Discussion
 Animation of daily upper-level circulation for the month.
|
 Animation of daily surface fronts and pressure systems for the month.
|
In the Northern Hemisphere, May marks the end of climatological spring which is the time of year when solar heating increases with the rising sun angle, arctic air masses are not as cold, and a contracting circumpolar vortex forces the jet stream northward. Polar air masses influence the weather over the contiguous U.S. (CONUS) less, and the warm, dry subtropical high pressure belts influence the weather more. May 2018 marked this transition — but on steroids, more than making up for the aberrant April.
A large, broadscale (long-wave) ridge dominated the upper-level circulation over the CONUS this month. The ridge brought widespread unusually warm temperatures and, by itself, would have been responsible for widespread dry conditions as well. But strong short-wave troughs and closed lows moving in the jet stream flow slammed into the ridge from the Pacific, bringing areas of rain to parts of the West and Great Plains as they slogged through the ridge. And a couple strong low pressure systems brought excessive Gulf of Mexico and Atlantic moisture to parts of the East. The result was an active upper-level circulation pattern that changed day-by-day throughout the month.
 500-mb mean circulation for the CONUS for May 1-4, 2018, showing a strong trough in the West.
|
 500-mb mean circulation for the CONUS for May 5-11, 2018, showing a ridge in the West.
|
 500-mb mean circulation for the CONUS for May 12-18, 2018, showing a trough in the West and in the Gulf of Mexico.
|
 500-mb mean circulation for the CONUS for May 19-31, 2018, showing a trough in the West and in the Gulf of Mexico.
|
For this report, the May 2018 circulation was broken down into four periods, each characterized by specific weather phenomena, temperature anomalies, precipitation anomalies, and impacts.
 500-mb circulation anomalies for the CONUS for May 1-4, 2018.
|
 Temperature anomalies (departure from normal) for the CONUS for May 1-5, 2018.
|
 Precipitation anomalies (percent of normal) for the CONUS for May 1-5, 2018.
|
May 1-4 was characterized by a strong upper-level trough/closed low which moved across the Southwest and then northeastward into the Plains towards the Great Lakes. Troughs and lows in the upper atmosphere generally force a short-wave ridge to form downstream, in this case over the eastern CONUS. The trough brought cooler-than-normal temperatures to the Southwest, while the southerly flow and ridge to its east brought above-normal temperatures to much of the CONUS east of the Rockies. The trough left areas of above-normal precipitation in its wake across parts of the Southwest and, along its associated surface front, from the southern Plains to Great Lakes. Otherwise, the broadscale (long-wave) ridge inhibited precipitation across the rest of the CONUS during this period.
 500-mb circulation anomalies for the CONUS for May 5-11, 2018.
|
 Temperature anomalies (departure from normal) for the CONUS for May 5-11, 2018.
|
 Precipitation anomalies (percent of normal) for the CONUS for May 5-11, 2018.
|
During the next seven days, short-wave troughs migrated through the westerly flow, with a few fronts making it to the Southeast early in the period, but the broadscale ridge generally dominated the weather. The general descending motion associated with ridges heats up the air adiabatically and also dries out the air, and this resulted in widespread above-normal temperatures and drier-than-normal weather for May 5-11. The migrating troughs brought some areas of above-normal precipitation, but these were limited mainly to the northern states, or Mid-Appalachians.
 500-mb circulation anomalies for the CONUS for May 12-18, 2018.
|
 Temperature anomalies (departure from normal) for the CONUS for May 12-18, 2018.
|
 Precipitation anomalies (percent of normal) for the CONUS for May 12-18, 2018.
|
Two features characterized the synoptic pattern during May 12-18. The first was a large upper-level low which slammed into the West and got bogged down within the broadscale ridge. It brought cooler-than-normal temperatures to part of the Southwest and areas of above-normal precipitation to parts of the interior West and High Plains. It kicked up a short-wave ridge ahead of it which funneled warmer-than-normal air across much of the Great Plains to East Coast. The second synoptic feature was a low pressure system which originated in the Gulf of Mexico and slowly moved into the Southeast then up the East Coast. It merged with pieces of energy from the western low and their associated fronts to bring widespread above-normal precipitation to the eastern CONUS from Florida to Pennsylvania.
 500-mb circulation anomalies for the CONUS for May 19-31, 2018.
|
 Temperature anomalies (departure from normal) for the CONUS for May 18-31, 2018.
|
 Precipitation anomalies (percent of normal) for the CONUS for May 18-31, 2018.
|
The last two weeks (May 19-31) saw several short-wave troughs and closed lows migrate across the CONUS or get bogged down in the West. The month ended with Subtropical Storm Alberto moving out of the Caribbean and Gulf of Mexico into the CONUS. But, again, high pressure continued to pull the strings. The broadscale ridge kept temperatures warmer than normal across most of the CONUS, with the greatest temperature departures occurring across the central and northern Great Plains to the Ohio Valley and Great Lakes. Only parts of the southwestern CONUS and Florida were cooler than normal, owing to the upper-level lows over the Southwest and Alberto in the Southeast. And a stronger-than-normal Bermuda High (North Atlantic High) created an atmospheric steering current along its western edge which steered Alberto into the Gulf of Mexico coast then across the Ohio Valley where it merged with a remnant front as it moved over the Great Lakes. Throughout the period, weak fronts fought a losing battle against the high pressure ridge east of the Rockies. It would have been a dry two weeks if not for the western lows and Alberto. The western lows and their troughs dumped above-normal precipitation over parts of the interior West and High Plains to northern Rockies, while Alberto dropped widespread excessive rains across the Southeast to Mid-Atlantic region and patches of near to above-normal rainfall from the Ohio Valley to Great Lakes.
 500-mb mean circulation for the CONUS for May 2018.
|
 500-mb circulation anomalies for the CONUS for May 2018.
|
 Temperature anomalies (departure from normal) for the CONUS for May 2018.
|
 Precipitation anomalies (percent of normal) for the CONUS for May 2018.
|
When conditions are averaged across the entire month, the upper-level circulation pattern reflects features of all of these systems. A long-wave western ridge/eastern trough pattern is clearly seen across southern Canada. Over the CONUS it was distorted by the frequent troughing in the Southwest and by the mid-month trough and late-month Alberto over the Gulf of Mexico. But the dominance of the broadscale ridge is evident in the upper-level height anomaly field. This broadscale ridge, or above-normal heights, or contracted circumpolar vortex, is strongly reflected in the much-above-normal temperatures for the month which covered almost all of the CONUS. Only a few parts of the southwestern coast and Florida were near to cooler than normal. The precipitation anomaly pattern for the month represented an additive result of the anomaly patterns for the various weeks, with the areas that were much wetter than normal during two or more weeks showing up wet at the monthly time scale, and those areas (especially the Southwest, West Coast, Lower Mississippi Valley to Ohio Valley, Northeast, and parts of the Great Plains) that were persistently dry every week, or which received a brief shot of above-normal precipitation, showing up as quite dry at the monthly scale. The circulation during this month was also reflected in severe weather, drought, and regional records.
- The extreme warmth was reflected in the statewide temperature ranks. In addition to being the warmest May on record nationally, May 2018 was the warmest May in the 124-year record for eight states from Oklahoma to Virginia and in the top ten warmest category for an additional 32 states in the CONUS. About 83 percent of the CONUS was very warm (having May temperatures in the warmest tenth percentile of the historical record). About a tenth (10 percent) of the CONUS had May precipitation in the wettest tenth percentile of the historical record) and about 7 percent was very dry (in the driest tenth of the historical record). The wet and dry conditions balanced each other out, nationally, giving the CONUS a May rank of 55th wettest. On a statewide basis, Florida and Maryland had the wettest May on record with five others along the East Coast ranking in the top ten wettest category, while Louisiana ranked tenth driest, New Hampshire eleventh driest, and Washington twelfth driest.
- When daily temperature records are examined, the extreme warmth overwhelmed the extreme cold. When integrated across the month, there were 8,596 record warm daily high (3,789) and low (4,807) temperature records. This was over 18 times the 457 record cold daily high (313) and low (144) temperature records.
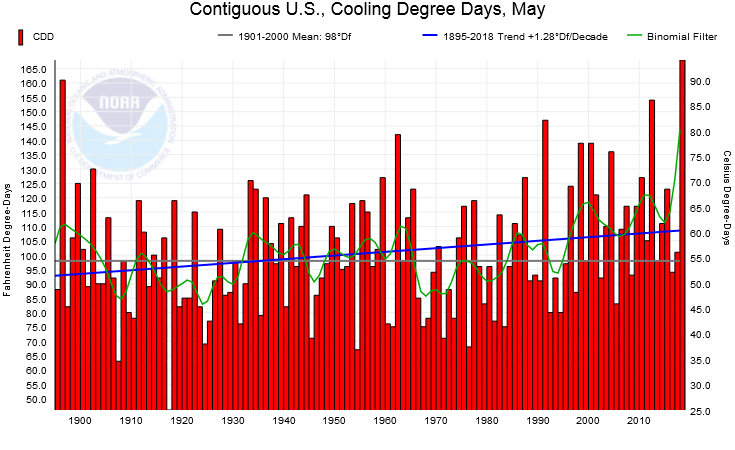
- As noted earlier, May marks the end of the Northern Hemisphere climatological spring, a period of transition from winter cold to the warmer temperatures of summer. Cold outbreaks occur less and less often and will increase heating demand when they occur, while abnormally warm temperatures can become significantly warmer and will increase cooling demand. The effect on heating and cooling demand will also vary depending on location. Concurrent with temperatures averaged across the month and across the CONUS resulting in the warmest May in the 1895-2018 record, May 2018 also had the highest national cooling degree day value for May and the lowest national heating degree day value. The result was a national REDTI (Residential Energy Demand Temperature Index) value for May 2018 that ranked in the middle of the historical record — 53rd lowest.
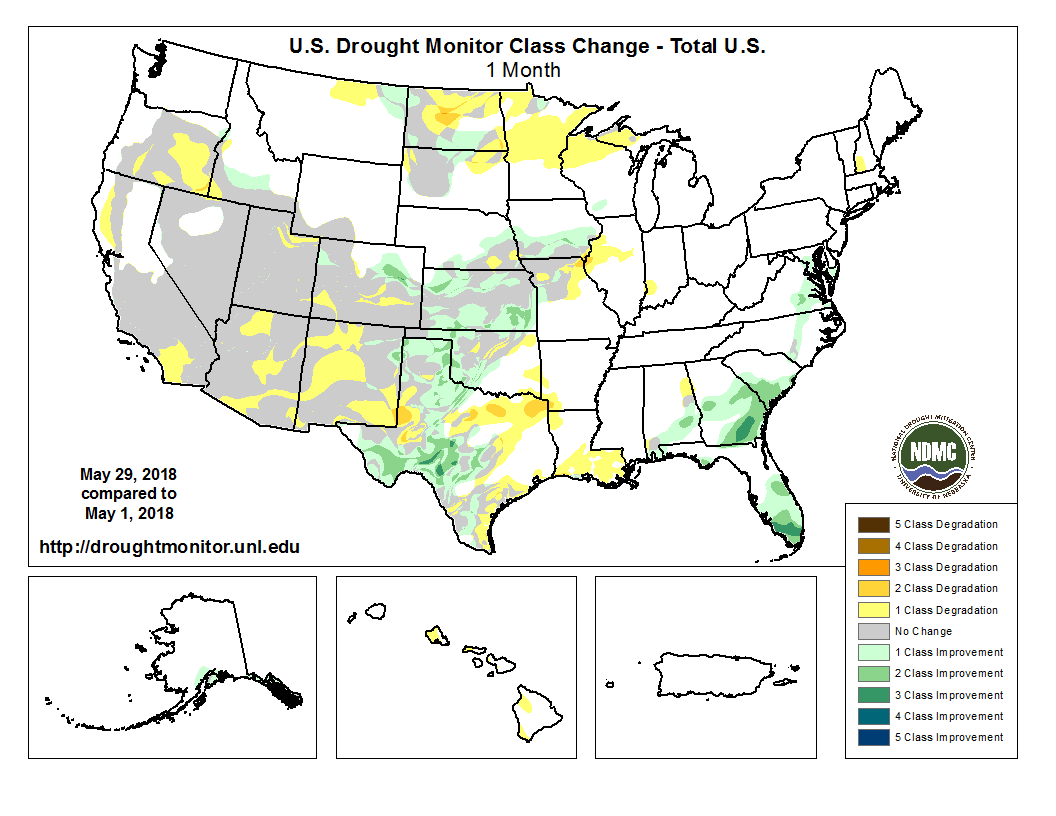
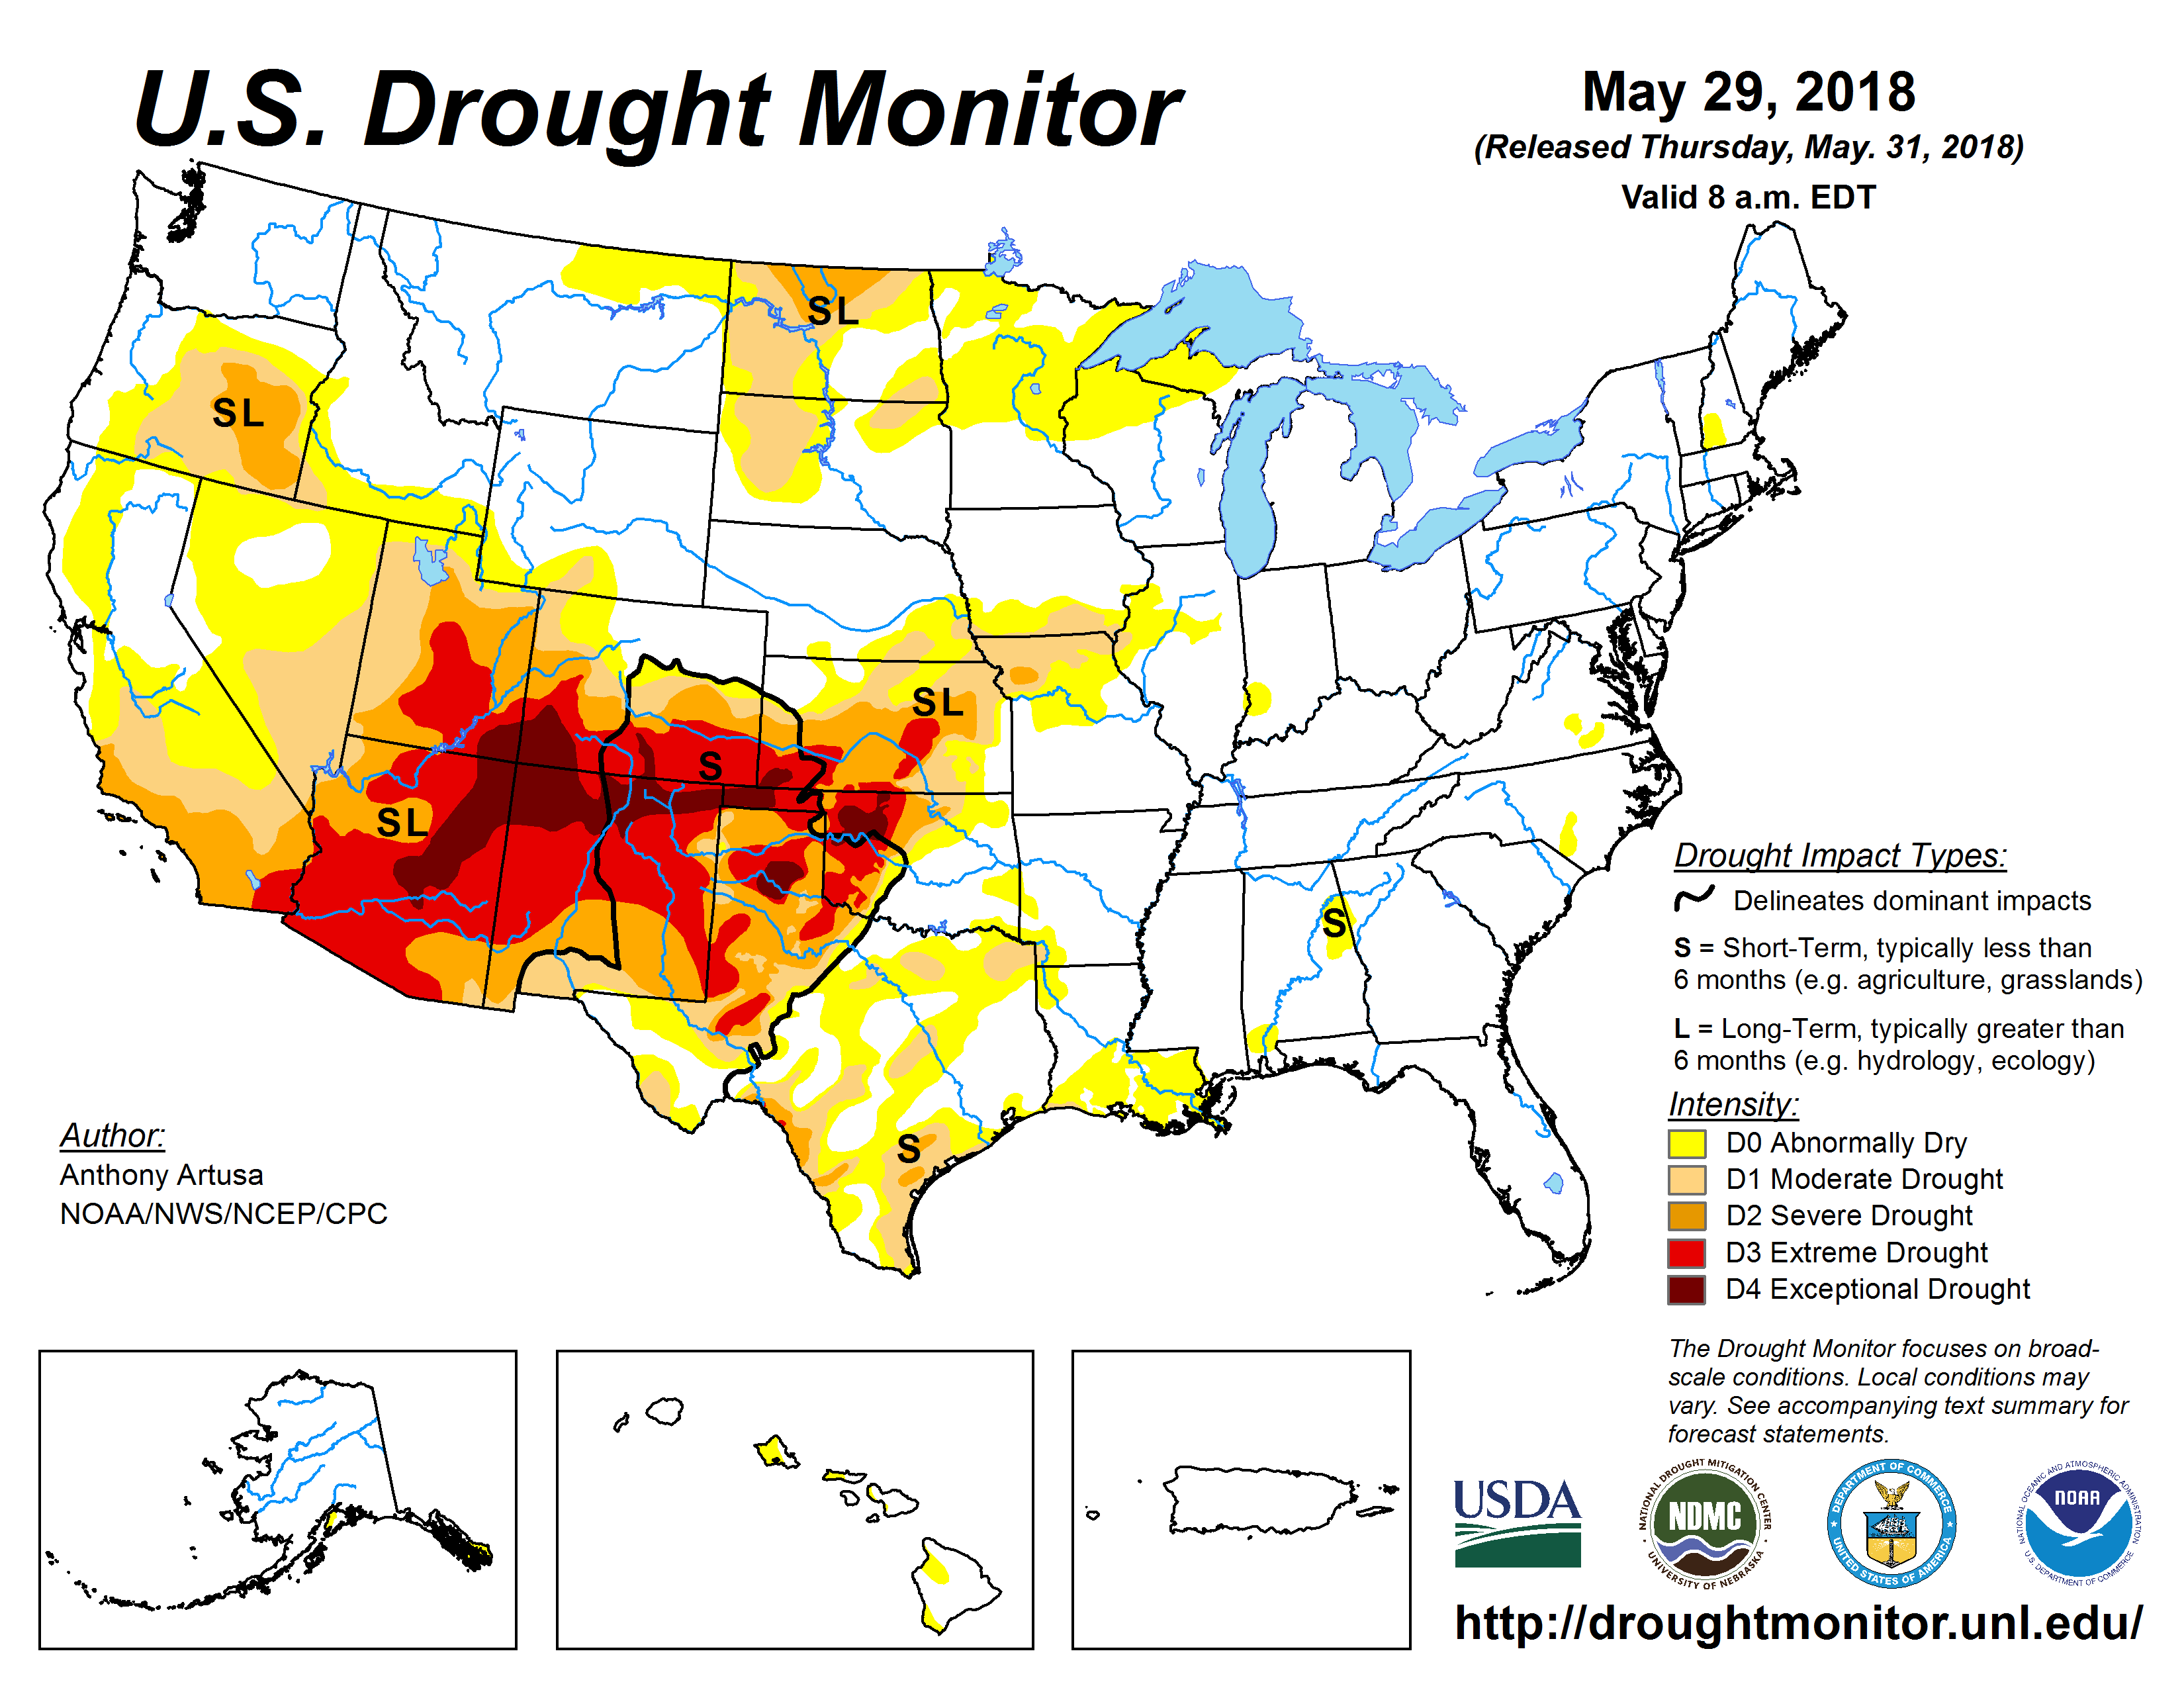
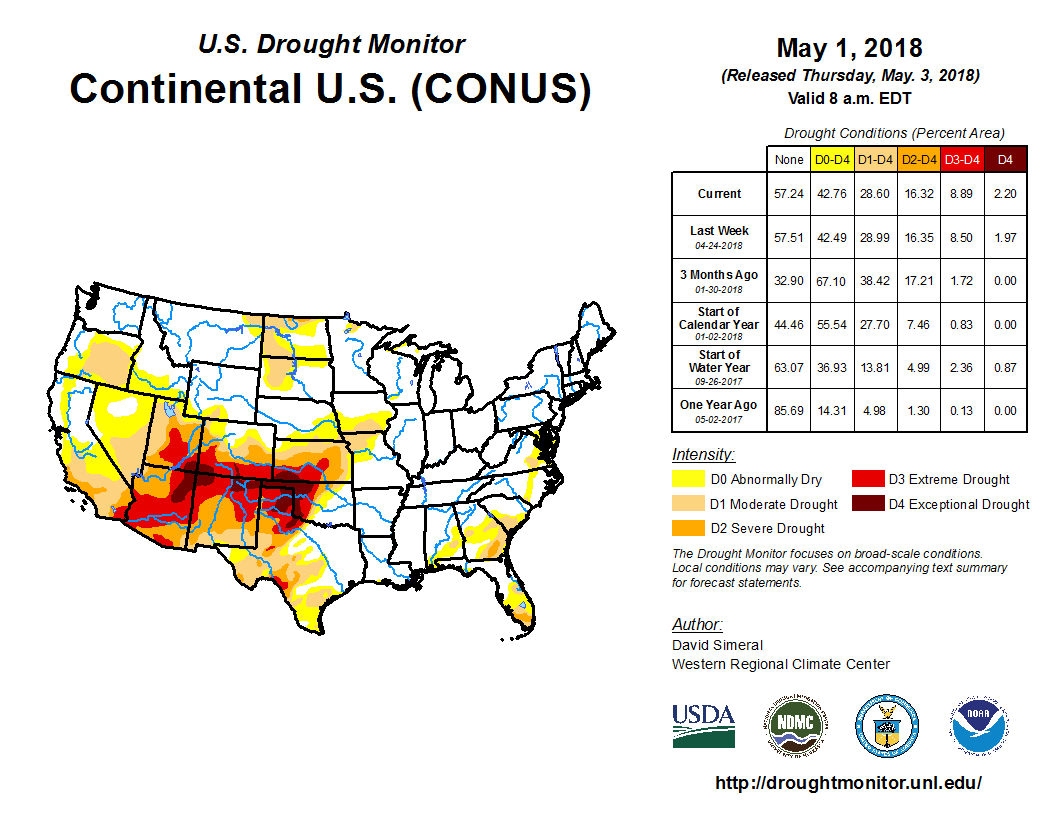
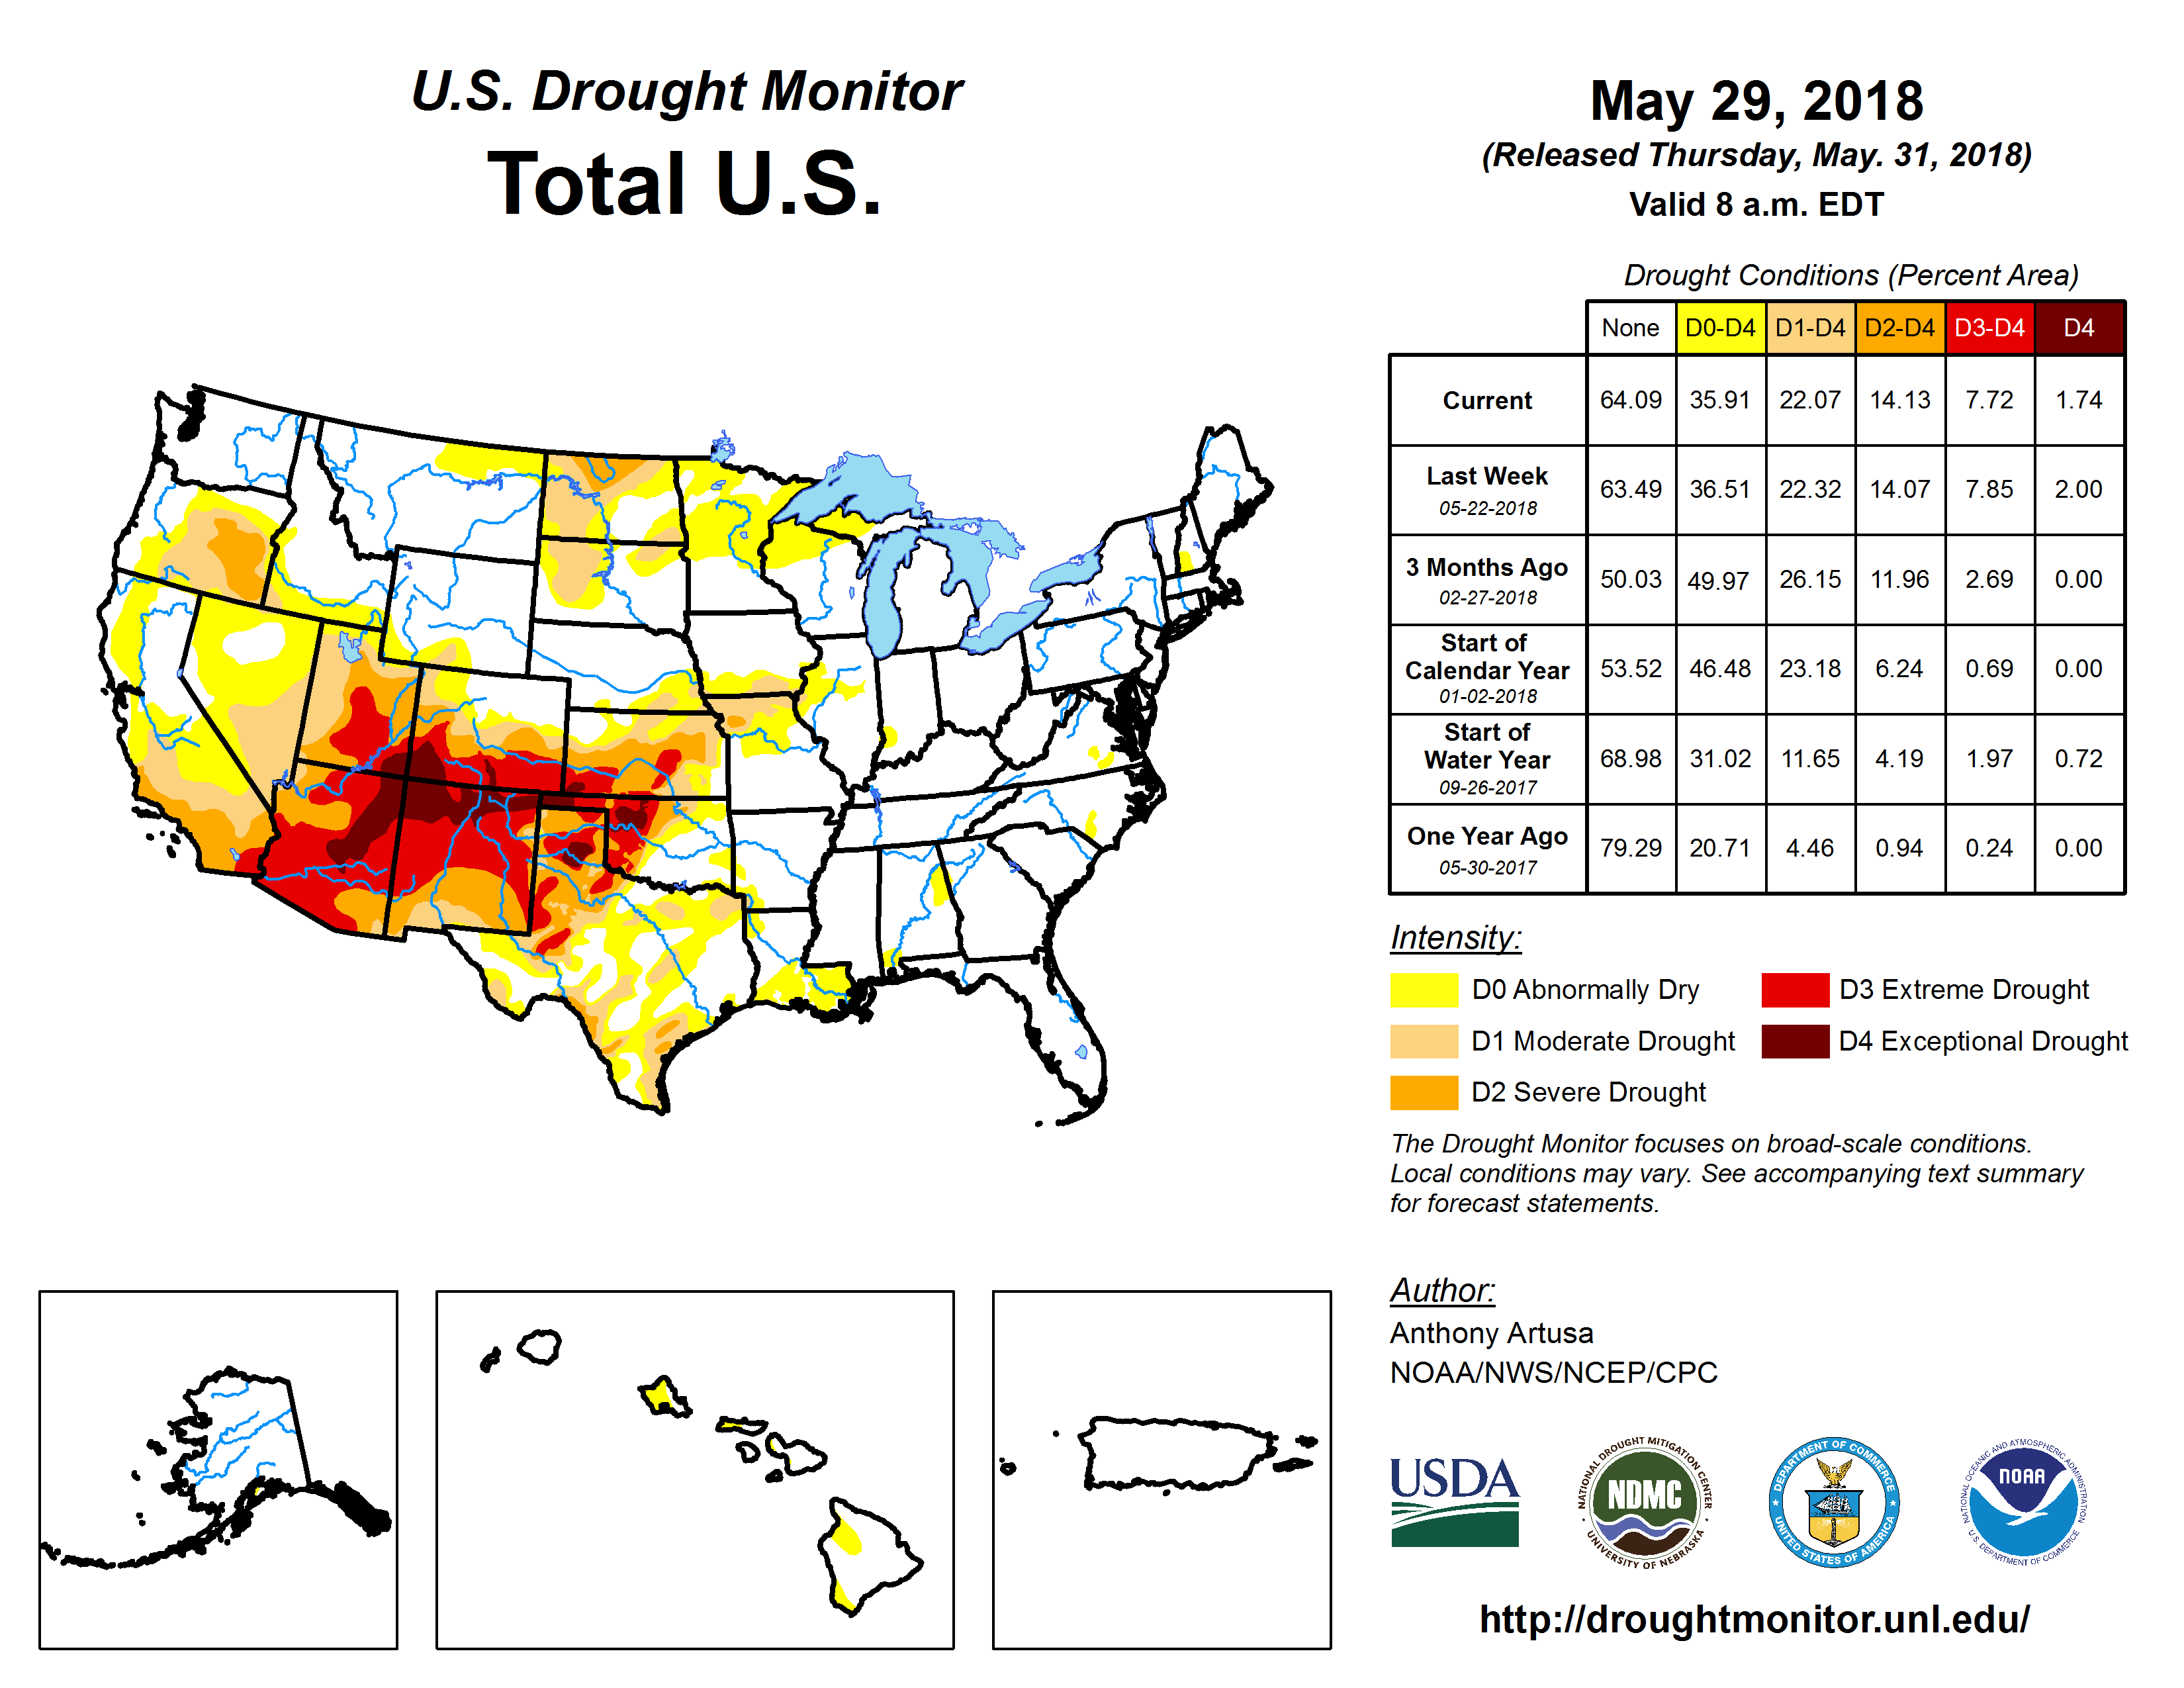
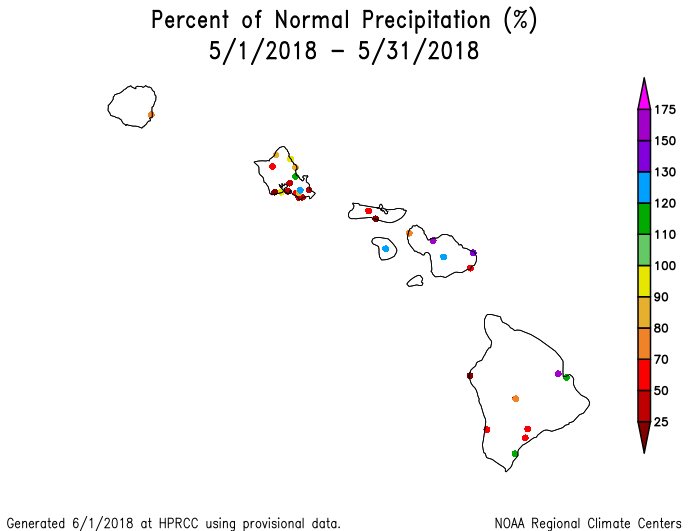
- Some of the precipitation fell on drought areas and contracted drought and abnormal dryness, while other drought areas continued quite dry. Drought and abnormal dryness developed, expanded, or intensified in parts of the Southwest, Far West, Great Plains, Mississippi Valley, and Hawaii, while it improved or was eliminated in other parts of the Plains and (especially) Southeast. Contraction outweighed expansion, but just barely, so at the national level drought shrank from 28.6 percent of the CONUS at the end of April to 26.4 percent of the CONUS at the end of May (from 23.9 percent to 22.1 percent for all of the U.S.). Dry conditions during the last six months had set the stage for the widespread development of wildfires in the Southwest to southern Plains. Wildfires were widespread at the beginning of April, but beneficial rains later in April helped reduce the number of large wildfires. During May, large wildfires were mainly limited to the Southwest, although a few occurred near the central Appalachians early in the month and another batch developed in the southern High Plains at mid-month (wildfire maps for May 6, 13, and 31). There were not as many as in April, perhaps due to the upper-level lows and troughs which penetrated the broadscale ridge this month helping to bring wetting rains to some of the areas that were ravaged by wildfires earlier. Or maybe we were just lucky.
- The atmospheric circulation needed to create the instability and dynamics favorable for severe weather consists largely of a southwesterly flow across the central part of the CONUS, which funnels moist Gulf of Mexico air and its latent heat energy into the mix. This upper-level circulation pattern occurred periodically as the short-wave troughs and closed lows, and their associated surface fronts and lows, moved across the region. Notable tornado outbreaks occurred on the 1st-3rd, 13th-15th, 27th-29th, and 31st. Each of these periods was characterized by strong upper-level lows or troughs moving out of the West or by Subtropical Storm Alberto moving through the area. But these systems and their dynamics were fighting against a broadscale upper-level pattern during May 2018 which supported descending air which acts to suppress severe weather. The net result of these competing forces was a total count (based on preliminary data) of 166 tornadoes, which is less than the May average of 276.
Typically tropical cyclone activity is enhanced in the Eastern North Pacific and inhibited in the North Atlantic during El Niños, and inhibited in the Eastern North Pacific and enhanced in the North Atlantic during La Niñas, due mostly to changes in vertical wind shear during the two extreme events. The relationship is unclear during ENSO-neutral events. The tropical Pacific Ocean was in an ENSO-neutral state during May 2018.
- The Atlantic hurricane season runs from June 1st through November 30th and the Eastern North Pacific (ENP) hurricane season runs from May 15th through November 30th. No tropical storms or hurricanes developed in these basins during May, although a tropical depression (TD 1-E) formed in the ENP in the middle of the month and lasted just a few days, while two weather systems developed in the Caribbean and Gulf of Mexico. Disturbance 1, which lasted just a couple days at mid-month, was a broad surface low pressure area interacting with an upper-level low from the eastern Gulf of Mexico that brought rain to areas from the Caribbean to the U.S. Southeast and East Coast. Subtropical Storm Alberto began as a surface low pressure system near Mexico's Yucatan Peninsula, eventually moving north across the Gulf of Mexico and into the southeastern U.S., then curving up across the Midwest and into the Great Lakes. No tropical cyclones formed in, or moved into, the central North Pacific.
- One tropical cyclone and three tropical disturbances developed in the western North Pacific in or near the U.S.-Affiliated Pacific Islands (USAPI). Tropical Storm 04W developed as a disturbance in central Micronesia, intensifying into a tropical storm as it neared the northern Marianas. Three other disturbances developed within Micronesian waters, two (95W and 96W) briefly at the beginning of the month, and the third (90W) near the end of the month, but none of them developed further or posed a threat to the USAPI during May.
 North America monthly upper-level circulation pattern and anomalies. The upper-level circulation pattern during May, when averaged for the month, consisted of a small troughs over the Southwest and Gulf of Mexico within a continent-wide region of generally above-normal height anomalies. |
|
Map of monthly precipitation anomalies. May was wetter than normal from the Southeast to Mid-Atlantic states, in parts of the interior West, and parts of the central Plains to southern Great Lakes. It was drier than normal along the West Coast, Southwest, much of the Northeast and Mississippi Valley, and parts of the Great Plains. Alaska was mostly wetter than normal. Drier-than-normal weather dominated Hawaii, especially in the leeward locations. Puerto Rico was drier than normal in the south central region and wetter than normal in the north, west, and eastern sections, although the dryness may be a reflection of damage to the precipitation observation network during last year's hurricane season. |
|
Map of monthly temperature anomalies. Monthly temperatures during May were warmer than normal across most of the CONUS, with only parts of Florida and California and the surrounding states near to cooler than normal. Alaska had a mixed temperature anomaly pattern, with cooler-than-normal stations mixed in geographically with warmer-than-normal stations. |
 Northern Hemisphere monthly upper-level circulation pattern and anomalies. Global Linkages: The upper-level (500-mb) circulation anomaly pattern over North America was part of a complex long-wave pattern that stretched across the Northern Hemisphere. East/west couplings of circulation anomalies are evident over Eurasia, but the most striking anomaly pattern is the almost global ring of positive (above-normal) height anomalies at mid-latitudes surrounding an area of negative (below-normal) height anomalies at higher latitudes (centered over northeast Canada to southern Greenland). This represents a notable contraction of the circumpolar vortex almost hemisphere-wide. The upper-level circulation and its anomalies are associated with the Sea Level Pressure (SLP) pattern and its anomalies which reflect the semi-permanent centers of action of SLP. The above- and below-normal upper-level height anomalies over parts of the North Pacific and North Atlantic appear to be associated with above- and below-normal SLP, respectively. The locations of these anomalies with respect to the long-term climatology suggests that both the North Atlantic High and Icelandic Low were stronger compared to climatology, indicating an increased pressure gradient and stronger jet stream and circulation over the North Atlantic. The above-normal 500-mb heights were associated with upper-level ridging, or with weakened troughs, at the mid-latitudes; below-normal precipitation (over Scandinavia and adjacent northeast Europe); below-normal snow cover (over Scandinavia, central and western Canada, and parts of Siberia); above-normal surface temperatures (over much of North America, Europe, East Asia, and Argentina); and warm SST anomalies (in the central to western North Atlantic and parts of the North Pacific Oceans). The areas of below-normal 500-mb heights were associated with upper-level troughing, or with weakened ridges; near- to below-normal surface temperatures (over northeast Canada and central Russia); a cooler-than-normal SST anomalies (in the northern North Atlantic); above-normal precipitation (over Alaska and central Russia); and above-normal snow cover (over eastern Canada, north central Russia, and eastern Siberia). Parts of North America and Eurasia were cooler than normal, and parts of the Pacific, Atlantic, and Indian Oceans had cooler-than-normal SST anomalies. But with much of North America and Eurasia, and most of South America and Africa, having warmer- to much-warmer-than-normal temperatures, and large portions of the Atlantic, Pacific, and Indian Oceans having warmer-than-normal sea surface temperatures, the May 2018 global temperature was still well above normal. |
Atmospheric Drivers
Subtropical highs, and fronts and low pressure systems moving in the mid-latitude storm track flow, are influenced by the broadscale atmospheric circulation. The circulation of the atmosphere can be analyzed and categorized into specific patterns. The Tropics, especially the equatorial Pacific Ocean, provides abundant heat energy which largely drives the world's atmospheric and oceanic circulation. The following describes several of these modes or patterns of the atmospheric circulation, their drivers, the temperature and precipitation patterns (or teleconnections) associated with them, and their index values this month:
-
El Niño Southern Oscillation (ENSO)
- Description: Oceanic and atmospheric conditions in the tropical Pacific Ocean can influence weather across the globe. ENSO is characterized by two extreme modes: El Niño (warmer-than-normal sea surface temperature [SST] anomalies in the tropical Pacific) and La Niña (cooler-than-normal SST anomalies), with the absence of either of these modes termed "ENSO-neutral" conditions.
- Status: With near-average SSTs across most of the equatorial Pacific Ocean, the ocean and atmosphere system reflected an ENSO-neutral state during May 2018.
- Teleconnections (influence on weather): The NWS CPC has no teleconnections for ENSO-neutral conditions.
-
Madden-Julian Oscillation (MJO)
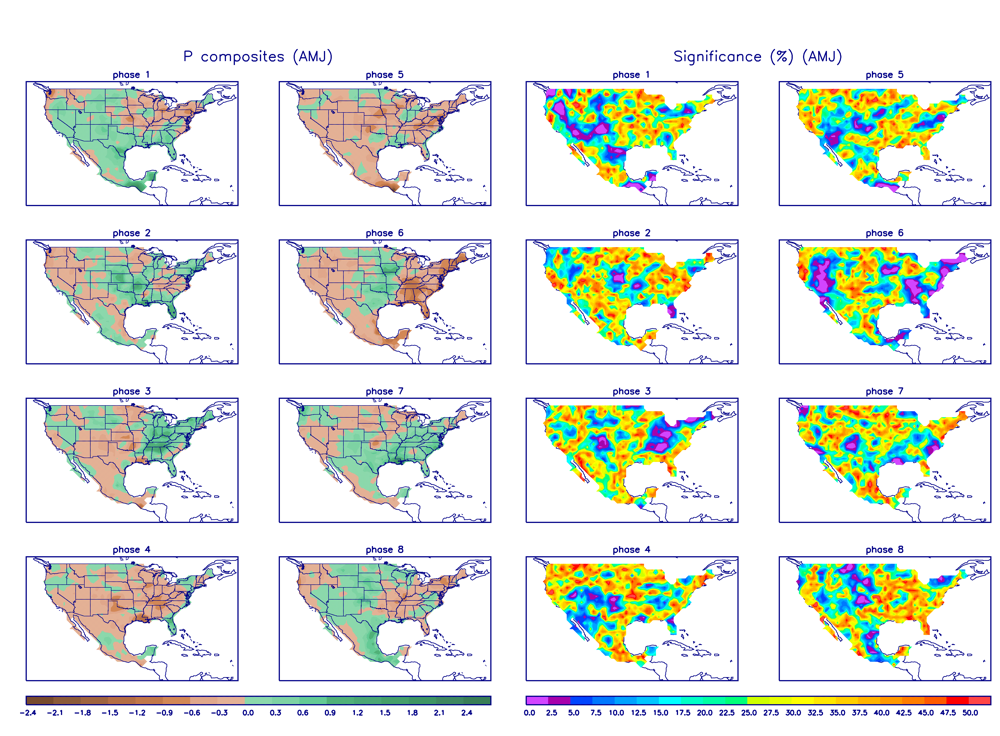
- Description: The MJO is a tropical disturbance or "wave" that propagates eastward around the global tropics with a cycle on the order of 30-60 days. It is characterized by regions of enhanced and suppressed tropical rainfall. One of its indices is a phase diagram which illustrates the phase (1-8) and amplitude of the MJO on a daily basis. The MJO is categorized into eight "phases" depending on the pattern of the location and intensity of the regions of enhanced and suppressed tropical rainfall. The MJO can enter periods of little or no activity, when it becomes neutral or incoherent and has little influence on the weather. Overall, the MJO tends to be most active during ENSO-neutral years, and is often absent during moderate-to-strong El Niño and La Niña episodes.
- Status: The MJO Wheeler-Hendon index transitioned rapidly from phase 8 through phases 1 to 4 during May, spending most of the month in phases 1 and 2. Other aspects of the tropical ocean-atmosphere system (referred to in the CPC reports as the background or low frequency [e.g., La Niña] state, Kelvin and Rossby waves, and tropical cyclone activity) also appeared to play a role in influencing the month's climate (especially Rossby waves and Kelvin waves) (MJO updates for May 7, 14, 21, 28), and June 4).
- Teleconnections (influence on weather): The MJO's temperature and precipitation teleconnections to U.S. weather depend on time of year and MJO phase; there is also a lagged component associated with the teleconnections. To the extent teleconnections are known, the May (April-June) teleconnections for temperature are shown here and for precipitation are shown here.
- Comparison to Observed: The MJO is transitory and can change phases (modes) within a month, so it is usually more closely related to weekly weather patterns than monthly. In the case of May 2018, the MJO spent most of its time in phases 1 and 2. There is little agreement between the teleconnections for phases 1 and 2 and the monthly temperature and precipitation anomaly patterns, or with the weekly anomaly patterns for temperature (weeks 1, 2, 3, 4, 5) and precipitation (weeks 1, 2, 3, 4, 5).
- The Pacific/North American (PNA) pattern
- Description: The PNA teleconnection pattern is associated with strong fluctuations in the strength and location of the East Asian jet stream. PNA-related blocking of the jet stream flow in the Pacific can affect weather downstream over North America, especially the West and especially in the winter half of the year.
- Status: The daily PNA index oscillated between zero and negative values, averaging negative for the month as a whole. The 3-month-averaged index was negative.
- Teleconnections (influence on weather): To the extent teleconnections are known, a negative PNA for this time of year (April on the quarterly teleconnection maps) is associated with above-normal temperatures across the southern and central Plains to East Coast; below-normal temperatures in the Pacific Northwest and across most of Canada to Alaska; above-normal upper-level circulation anomalies over southeastern CONUS to Mexico; below-normal upper-level circulation anomalies over western Canada to the northwest CONUS, and over the Canadian Maritimes; and below-normal precipitation from Utah to Kansas, but there are few precipitation teleconnections.
- Comparison to Observed: The May 2018 monthly upper-level circulation anomaly pattern over North America has little agreement with the teleconnections for a negative PNA. The monthly temperature anomaly pattern agrees in the southeastern CONUS, but not the rest of North America. The monthly precipitation anomaly pattern has little agreement, but there are few teleconnections.
- The Arctic Oscillation (AO) pattern
- Description: The AO teleconnection pattern relates upper-level circulation over the Arctic to circulation features over the Northern Hemisphere mid-latitudes and is most active during the cold season.
- Status: The daily AO index was positive throughout the month, but with decreasing magnitude as the month progressed, and averaged positive for the month. The 3-month-averaged index was positive.
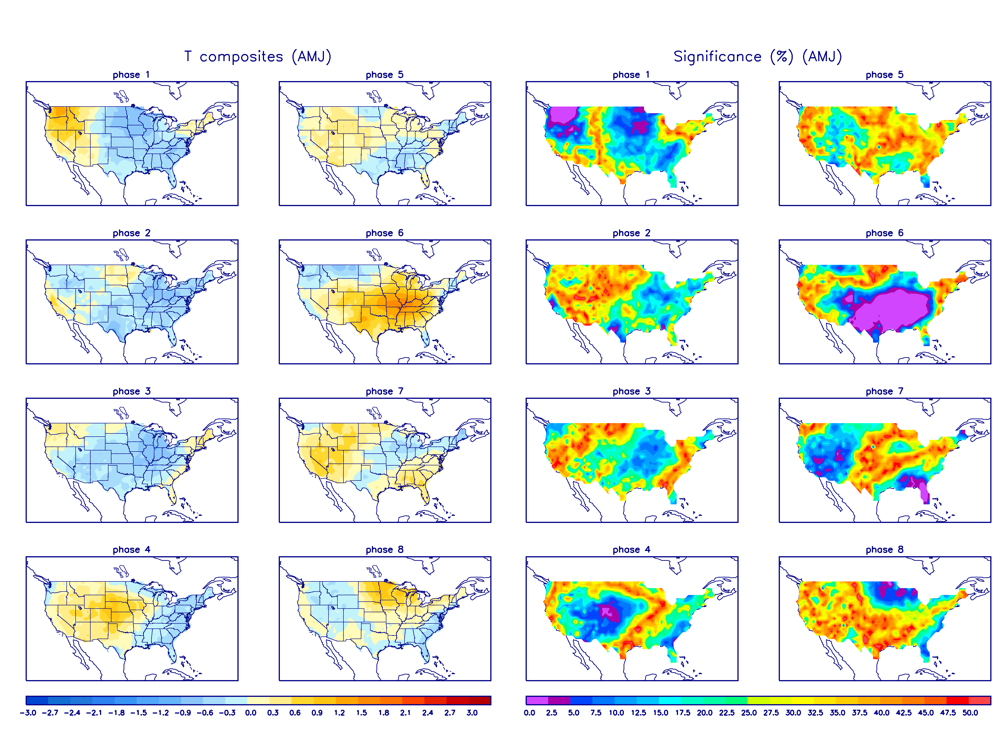
- Teleconnections (influence on weather): To the extent teleconnections are known, a positive AO in May (April-June in the AO Composites table) is typically associated with below-normal upper-level circulation anomalies over the Arctic Ocean and Greenland into northern Canada; above-normal upper-level circulation anomalies over the eastern half of the CONUS, across the North Atlantic, and over much of Western Europe, as well as eastern Asia across much of the North Pacific; above-normal temperatures from the Southwest to Great Lakes; near-normal temperatures further west and further east; and drier-than-normal conditions from the northern and central Rockies to Mid-Mississippi Valley, from the Lower Mississippi and Ohio Valleys to Mid-Atlantic and Northeast, and along the cost of Oregon to northern California; and wetter-than-normal conditions in parts of eastern Texas to western Louisiana, and parts of the Southeast.
- Comparison to Observed: The May 2018 monthly upper-level circulation anomaly pattern has good agreement with the teleconnections for a positive AO, especially over the eastern U.S., Arctic Ocean to Greenland, North Atlantic, and Europe, and some agreement over the North Pacific. The monthly temperature anomaly pattern agrees well in the central CONUS but not to the west or east. The monthly precipitation anomaly pattern agrees in some parts of the country but not in others.
- The North Atlantic Oscillation (NAO) pattern
- Description: The NAO teleconnection pattern relates upper-level circulation over the North Atlantic Ocean to circulation features over the Northern Hemisphere mid-latitudes.
- Status: The daily NAO index was positive throughout the month, especially at the beginning of the month, and averaged positive for the month. The 3-month-averaged index was positive.
- Teleconnections (influence on weather): To the extent teleconnections are known, a positive NAO during this time of year (April on the quarterly teleconnection maps) is associated with above-normal upper-level circulation anomalies over most of the CONUS, extending across the North Atlantic to Western Europe; below-normal circulation anomalies over northern Canada to Greenland; above-normal temperature anomalies for most of the CONUS except the southern Plains to Southeast; below-normal temperatures over northeast Canada; and drier-than-normal precipitation anomalies in California to Nevada, the central Plains, and Southeast, but the precipitation teleconnections are few and weak.
- Comparison to Observed: The May 2018 monthly upper-level circulation and temperature anomaly patterns are a very good match with the teleconnections for a positive NAO. There are few precipitation teleconnections. The monthly precipitation anomaly pattern agrees in some places and is opposite in others, but the weekly precipitation anomaly patterns for the first two weeks (weeks 1 and 2) agree well during this time of month when the NAO was most strongly positive. For the upper-level circulation anomalies broken down for parts of the month, the NAO teleconnections agree most strongly with the observed circulation anomalies for May 5-11, which was the time when the NAO was most strongly positive.
- The West Pacific (WP) pattern
- Description: The WP teleconnection pattern is a primary mode of low-frequency variability over the North Pacific and reflects zonal and meridional variations in the location and intensity of the (East Asian) jet stream in the western Pacific.
- Status: The monthly WP index was near zero (slightly negative), while the three-month average WP index was positive.
- Teleconnections (influence on weather): The NWS CPC has no teleconnections for a neutral (near zero) WP. To the extent teleconnections are known, a negative WP during this time of year (April on the quarterly teleconnection maps) is typically associated with below-normal temperatures from western Canada to the Ohio Valley; above-normal temperatures in the Southwest; near-normal temperatures elsewhere; below-normal circulation anomalies over western Canada to the northern Plains; above-normal circulation anomalies over the southwestern CONUS and adjacent Pacific; and above-normal precipitation in Washington State, although there are few teleconnections.
- Comparison to Observed: The May 2018 monthly upper-level circulation, temperature, and precipitation anomaly patterns do not agree with the teleconnections associated with a negative WP.
- The East Pacific-North Pacific (EP-NP) pattern
- Description: The EP-NP teleconnection pattern relates SST and upper-level circulation patterns (geopotential height anomalies) over the eastern and northern Pacific to temperature, precipitation, and circulation anomalies downstream over North America. Its influence during the winter is not as strong as during the other three seasons.
- Status: During May 2018, North Pacific SSTs cooled in the northern latitudes and warmed in the mid-latitudes (around 30-45 degrees North latitude), resulting in an SST anomaly pattern that was warmer than normal across most of the North Pacific with an area that was cooler than normal across the Date Line from about 20 degrees to 30 degrees N latitude. The May 2018 monthly EP-NP index was negative, with the 3-month running mean slightly positive.
- Teleconnections (influence on weather): To the extent teleconnections are known, a negative EP-NP index this time of year (April on the quarterly teleconnection maps) is typically associated with warmer-than-normal temperatures across the CONUS from the Great Plains to East Coast (except the Southeast) and across central to eastern Canada; below-normal temperatures over Alaska; below-normal upper-level circulation anomalies (weaker upper-level ridge) over Alaska, western Canada, and the western CONUS; and above-normal upper-level circulation anomalies across eastern Canada and northeastern CONUS (weaker upper-level trough) and over the central North Pacific. The precipitation teleconnections are weak but suggest drier-than-normal conditions over Wyoming and the Midwest.
- Comparison to Observed: The May 2018 monthly temperature and upper-level circulation anomaly patterns mostly agree with the teleconnections associated with a negative EP-NP, but seem slightly shifted. The monthly precipitation anomaly pattern has some agreement, but few teleconnections exist. CPC does not compute the EP-NP index on a daily basis. But the weekly temperature anomalies over the CONUS for the last two weeks of the month (weeks 4 and 5) are a good match for the teleconnections. For the upper-level circulation anomalies broken down for parts of the month, the negative EP-NP teleconnections in the western CONUS match the observed circulation anomalies for May 1-4, 12-18, and 21-28, which are times when upper-level troughs and closed lows smashed into the western ridge.
| Week | Temperature | Precipitation | Circulation |
| April 29-May 5 | — | NAO | EP-NP |
| May 6-12 | — | NAO | NAO |
| May 13-19 | — | — | EP-NP |
| May 20-26 | EP-NP | — | EP-NP |
| May 27-June 2 | EP-NP | — | — |
Examination of the available circulation indices and their teleconnection patterns, and comparison to observed May 2018 weekly and monthly temperature, precipitation, and circulation anomaly patterns, suggest that the weather over the CONUS in May was influenced mostly by mid- and high-latitude atmospheric drivers originating in the Atlantic and Arctic, and partially by mid-latitude drivers originating in the Pacific. The equatorial Pacific was in an ENSO-neutral state and the WP index was near zero. The MJO and PNA teleconnections do not match the observed anomaly patterns, so the drivers monitored by these indices were likely not players this month. The monthly and some weekly anomaly patterns were a very good match for the teleconnections associated with the NAO, which indicates that the North Atlantic was the primary driver of this month's weather patterns. The AO also had some good agreement, which suggests that the Arctic drivers also contributed. But the EP-NP teleconnections agreed for several weeks, suggesting that the North Pacific drivers monitored by this index had some influence on a sub-monthly scale; it does especially well explaining the frequent movement of upper-level troughs and lows into the southwestern CONUS.
This month illustrates how the atmospheric circulation for the month can reflect atmospheric drivers (or modes of atmospheric variability) originating in the Atlantic, Arctic, and Pacific Oceans. The North Atlantic and Arctic drivers were most likely behind the long-wave circulation pattern and unusual warmth, while the North Pacific drivers were likely responsible for the frequent intrusion of troughs and closed lows moving in from the west.