
NOAA and its partners have released the latest Regional Climate Impacts and Outlooks, which recap winter conditions and provide insight into what might be expected this spring.
Winter Temperature Recap
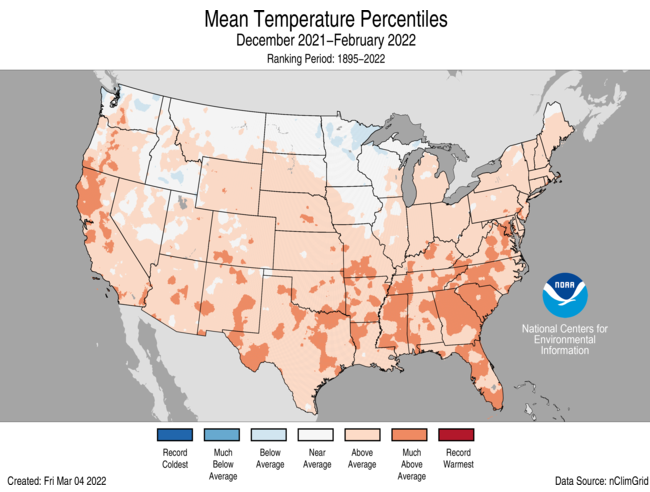
The winter (December-February) average contiguous U.S. temperature was 34.8°F, 2.5°F above average, ranking in the warmest third of the winter record. Winter temperatures were above average across much of the Lower 48 with Georgia and South Carolina each experiencing their seventh-warmest winter on record. Temperatures ranked near average from the Pacific Northwest to the western Great Lakes with no states ranking below average for the winter season.
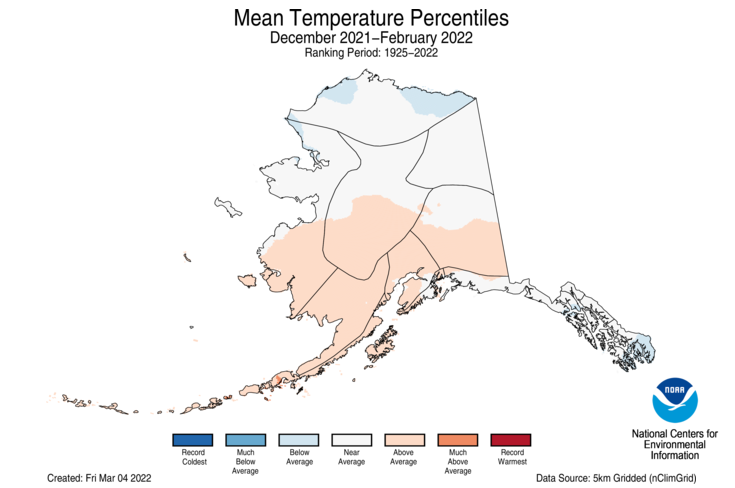
The Alaska December-February temperature was 6.3°F, 2.7°F above the long-term average, ranking among the middle one-third of the 97-year record. Above-average temperatures were observed across the Aleutians, Bristol Bay, Cook Inlet and the southern half of the West Coast, Central Interior and Southeast Interior regions. Temperatures were below average across portions of the North Slope and the southern Panhandle.

Spring Temperature Outlook
The April-June 2022 temperature outlook favors above-normal seasonal average temperatures for most of the contiguous U.S. and for the North Slope of Alaska. Below-normal temperatures are most likely for portions of the Pacific Northwest, northern Rockies and southeast Alaska, including the Alaska Panhandle. Moreover, above-normal temperatures are most likely for nearly all of the U.S. as we move into and through the summer months.

Winter Precipitation Recap
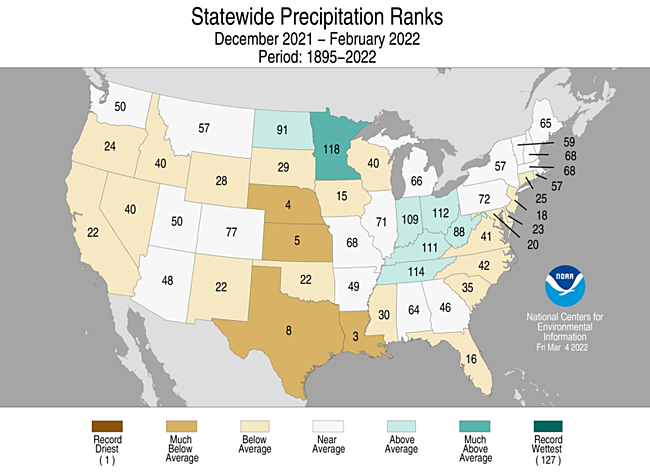
The winter precipitation total for the contiguous U.S. was 5.76 inches, 1.03 inches below average, and ranked as the 12th-driest winter in the 127-year period of record. Precipitation was above average across parts of the Upper Mississippi, Ohio, and Tennessee valleys. Minnesota had its 10th-wettest winter. Precipitation was below average across portions of the West, central and southern Plains, Gulf Coast and across parts of the Southeast and Mid-Atlantic. Louisiana had its third-driest winter on record with Nebraska ranking fourth-driest and Kansas, fifth-driest. Climatologically speaking, winter is the wet season across much of the western United States. If the dry conditions experienced in January and February across portions of the West were to continue into March and April, insufficient water resources may result during the dry season (summer), as well as an increased potential for drought intensification and wildfires in the fall.
Five regions in Alaska — Bristol Bay, West Coast, North Slope, Northeast Interior, and Southeast Interior — ranked wettest on record for the winter season, contributing to a record-wet winter for the state of Alaska, eclipsing the previous record set in 1928-29. Nome experienced its wettest winter since 1943-44 and King Salmon had its wettest winter on record.

Spring Precipitation Outlook
The April-June 2022 precipitation outlook favors above-normal seasonal total precipitation amounts for portions of the Great Lakes, Ohio Valley, Mid-Atlantic, Northeast and the west coast of Alaska. Below-normal precipitation is most likely for the region from the West Coast across the Rockies, to the central and southern Great Plains. The highlighted area of below-normal precipitation is forecast to shift north and east as the spring and summer months progress, while above-normal precipitation is favored to shift eastward to the Mid-Atlantic over the same period.

Impacts and Outlooks for Your Region
Get more details for your region in the March 2022 climate impacts and outlooks summaries:
- Alaska and Northwestern Canada Region
- Northeast Region
- Great Lakes Region
- Gulf of Maine Region
- Mid-Atlantic Region
- Midwest Region
- Missouri River Basin Region
- Pacific Region
- Southeast Region
- Southern Region
- Western Region
Creating These Quarterly Summaries
NOAA’s Regional Climate Services lead the production of these quarterly summaries of climate impacts and outlooks for various regions of the United States as well as parts of Canada along the border. This effort, which began in 2012, now includes as many as 11 unique regional products, all produced collaboratively with partner organizations.
You can access all of the Climate Impacts and Outlooks summaries as well as additional reports and assessments through the U.S. Drought Portal Reports web page at Drought.gov.


