
Supporting Three Major Industry Sectors
We are co-developing datasets, tools, and products with industry leaders that answer their most pressing questions about the environment.
The National Centers for Environmental Information (NCEI) is partnering with three major industry sectors (architecture and engineering, insurance and reinsurance, and retail) to address web accessibility, usability, and functionality of NOAA data, products, and services. By applying NOAA’s Service Delivery Model, NCEI is co-developing products based on the explicit needs users share to improve critical decision-making and planning.

Credit: Austin Koeckeritz, via Adobe
Architecture and Engineering
By improving NOAA environmental data that informs building design, codes, and standards, we are building resilience for a prosperous future.

Credit: Cape Hatteras National Seashore Flickr
Insurance and Reinsurance
We are developing environmental information references to support faster recovery from extreme events and inform decision making surrounding insurance pricing and individual risk.

Credit: Adobe Stock, provided by moofushi
Retail
We are developing environmental data and information references that enhance supply chain resilience, protect economic investments, and safeguard workers.
The products NCEI develops, including maps, reports, and datasets, will strengthen industry resilience, protect communities, and support economic growth.
Featured Products
")
")

Who Uses NCEI Products?
NCEI products are designed to help answer critical questions and support crucial decisions for businesses of all sizes. Many different types of people benefit from these tools, including:
Architects & Engineers
Rely on accurate regional climate information to design the homes, buildings, and infrastructure that society depends on for generations to come.
Insurers & Reinsurers
Use catastrophe models, built on environmental data, to analyze risk and protect the lives, livelihoods, and assets of millions of people in the U.S.
Retailers
Analyze weather patterns to strategically plan their supply chains and predict consumer needs to provide the food, medicine, clothing, and jobs vital to our communities and economy.
Leaders in other Industries
Need high-quality and accurate environmental information that is functional and easy to access to analyze the impact of current and future weather patterns and trends.
By improving the access and uptake of high-quality environmental information, NCEI is promoting data-driven decision-making that can boost efficiency and reduce costs. Delivering modernized informational products and services to industries contributes to businesses’ adaptability and resilience to weather and climate extremes, strengthening communities and the economy.
All Sectors
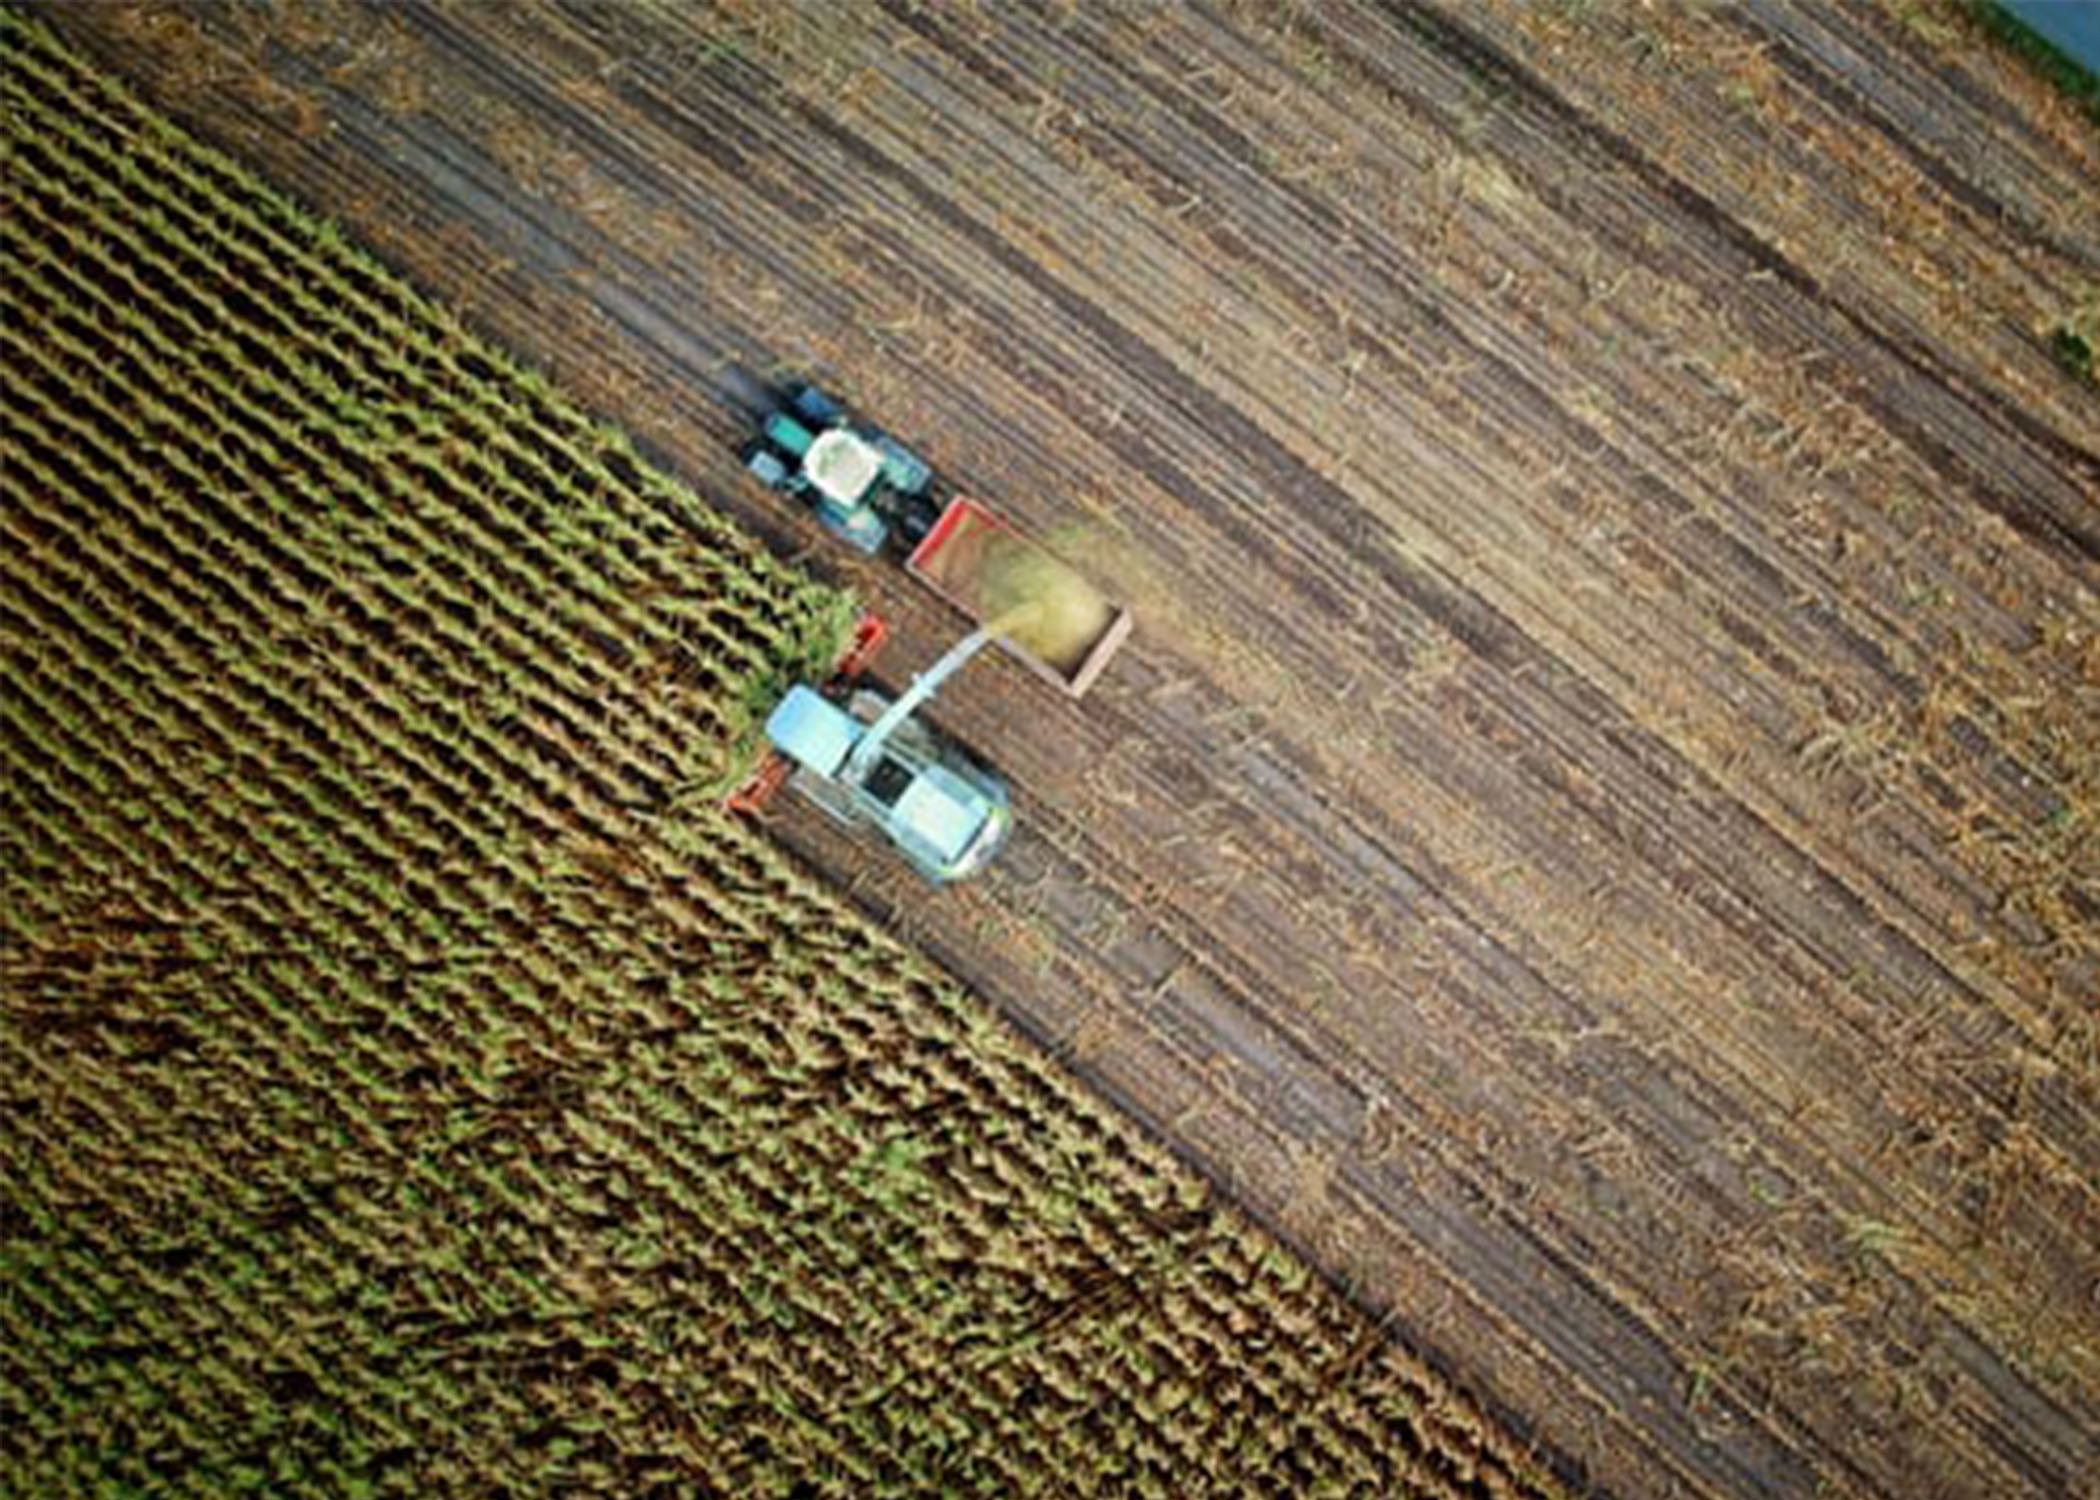
Agriculture
NCEI’s data-driven products and information help farmers make informed and economically optimal decisions and have billions of dollars of impact on the U.S. economy and federal aid allocation.

Transportation
The transportation sector relies on NCEI’s climate and weather data to avoid delays and accidents, enhance safety, and plan and optimize performance.

Legal Services
The $250.3 billion legal services sector relies on NCEI certified meteorological data to serve as evidence when weather is a factor in legal proceedings.

Energy and Utilities
Energy and utility companies rely on NCEI’s data to predict energy demand, strategic planning, risk management, and protection of assets.

Health
Relevant climate information is essential for understanding how climate trends and weather patterns affect personal health and for developing appropriate planning, adaptation, and mitigation strategies.

Coastal Hazards
Useful and timely information that aids decision makers in reducing vulnerability and increasing resiliency is critical to protecting people and maintaining healthy ecosystems and robust economies.

Ecosystems
Information on how weather and climate trends affect ecosystems and local communities is essential for developing adaptation and mitigation strategies.

Tourism
Relevant climate information is essential to understand how weather patterns and climate trends influence various aspects of the tourism industry and to effectively plan for the future.

Water Resources
Relevant climate information is essential to understand how weather patterns and climate trends influence various aspects of the tourism industry and to effectively plan for the future.
Resources for Heating, Refrigerating, and Air-Conditioning Engineers
Heating, refrigerating, and air-conditioning engineers rely on global weather and climate information to build sustainable, efficient systems, measure indoor air quality, and calibrate refrigeration needs. Engineers may find these resources helpful in their efforts to advance building standards and technologies.
Frost Protected Shallow Foundations
A frost protected shallow foundation (FPSF) is a practical alternative to deeper, more-costly foundations in cold regions with seasonal ground freezing and the potential for frost heave. An FPSF incorporates strategically placed insulation to raise the frost depth around a building.
Climate Monitoring Tools
NCEI's Climate Monitoring Services provide several tools that correlate with sector specific needs for energy, agriculture, and disaster relief.
Climate at a Glance
Climate at a Glance is an interactive tool that provides analysis of near real time precipitation and temperature data on global and national (U.S.) scales. It can be used to compare current conditions with the historical record, and is designed for climate variability and change research applications. Each spatial scale includes mapping, timeseries, ranking, and Haywood plotting applications, along with information about the project’s history and development.
Residential Energy Demand Temperature Index (REDTI)
The REDTI is based on population weighted heating and cooling degree days, and is a valuable tool for explaining year-to-year fluctuations in energy demand for residential heating and cooling. Residential energy consumption rises and falls in tandem with the increase and decrease of the number of heating and cooling degree days. Because of this strong correlation, seasonal changes in the REDTI can provide a good indication of the nation's fluctuating energy demands.
Crop Moisture Stress Index (CMSI)
The Moisture Stress Index for corn and soybean crops is a measure of the effects of drought and catastrophic wetness on national crop yield and is calculated through the use of a drought index (the Palmer Z Index) and annual average crop productivity values within each U.S. climate division.
U.S. Billion-Dollar Weather and Climate Disasters
Information and interactive tools on economic losses, deaths, and other impacts for U.S. weather and climate disasters where overall damages/costs reached or exceeded $1 billion.
Many organizations and businesses use NCEI’s environmental data to make informed decisions about their goods and services. A farmer may use our climate records to know when to plant crops; a retail chain may decide the exact time to add sweaters or rain gear to the shelves. The following case studies highlight specific products, use cases, and systems that rely on NCEI data to protect life and property, save money, and conserve natural resources.

Case Studies
- Reinsurance | Infographic
- Retail and Manufacturing | Infographic
- Drought and Livestock | Infographic
- Weather Service Providers | Infographic
- Fishing Forecast Services | Infographic
- Logistics and Shipping | Infographic
- Adapt-N for Agriculture | Infographic
- Aviation | Infographic
- Coral Reef Watch | Infographic