

For many in the Northern Hemisphere, the month of March means a heralding of spring, warmer temperatures, and longer daylight. But, for scientists studying sea ice in the Arctic, March carries a very different connotation. It is typically the month when sea ice is at its greatest extent, covering more of the Arctic Ocean than any other time of year.
What Is Sea Ice and Why Is It Important?
Unlike icebergs or glaciers, which originate on land, sea ice forms and melts in the ocean. Located in both the Arctic and the Antarctic, sea ice covers about 15 percent of the world’s oceans during at least some part of the year.
Scientists are attentive to the rapid changes taking place in the Arctic, where the massive loss of the ocean’s sea ice cover is increasing coastline erosion rates and, many argue, affecting global weather patterns. In contrast, while Antarctic sea ice grows and shrinks seasonally as it does in the Arctic, ice extent doesn’t have the same marked downward trend over the decades-long record. Ice in the Southern Hemisphere surrounds a continent that remains a constant bright white. Ice in the Northern Hemisphere occupies a polar ocean into which pulses of warm water from the south enter, originating from an area with an increasingly warm atmosphere.
Advancing during the winter as ice grows and retreating in the summer as thinner ice melts, Arctic sea ice reaches its minimum extent in September and maximum extent in March.
The importance of sea ice cannot be overstated. It has a critical role in the global energy budget that drives Earth's climate and weather. The surface of the ice is so bright that much of the sunlight reaching it reflects back into space. Areas of ocean covered by ice don’t absorb as much solar energy as darker open-water surfaces and are vital to keeping temperatures in the polar regions and Northern Hemisphere relatively cool. Without sea ice cover, more solar energy is absorbed and oceanic temperatures rise, sparking a feedback cycle of warming and melting. This increase in temperature and resulting loss of ice can lead to even greater warming over time, making the polar regions the most sensitive areas to climate change on Earth.
Indigenous people in the Arctic rely heavily on sea ice for transportation and hunting. The Yup’ik and Inuit populations closely observe the extent of sea ice for spring hunting. When that ice melts too quickly, it shortens their hunting season, affecting the lives of those who rely on a longer season.
Often, the familiar image that pops into people’s minds when they envision the Arctic is wildlife such as polar bears, seals, and walruses. The lives of many of these animals are impacted by changes in sea ice from year to year. Mammals such as arctic foxes, walruses, seals, and polar bears rely on sea ice as a resting and birthing place and a hunting, foraging, and breeding ground. A lack of sea ice or poor ice conditions can cause stress to these mammals and ultimately shrink their habitat, affecting their health and ability to reproduce.
Age Is Just a Number, Unless You're Sea Ice
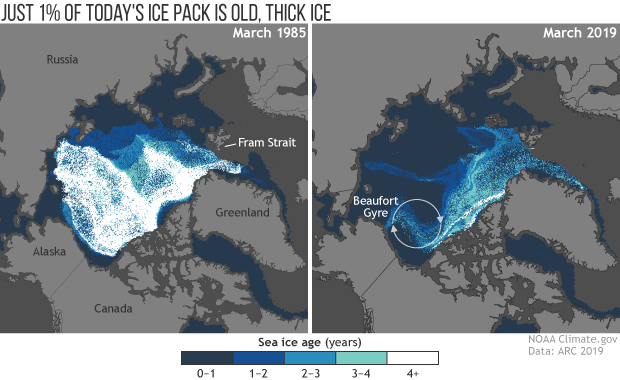
Like fine wine, sea ice gets better with age. Some of the oldest sea ice in the Arctic is over four years old, making it thicker and more resilient to atmospheric and oceanic changes than younger ice. Thinner, younger ice is more vulnerable to melting in the summer, which contributes to smaller minimum ice extents.
Unfortunately, older ice makes up only a small fraction of the current Arctic ice pack. In March 1985, sea ice at least four years old made up about 30 percent of the ice pack in the Arctic Ocean. In March 2019, ice that old made up only a little more than 1 percent of the pack. Today, more than three-quarters of the winter ice pack consists of thin ice that is just a few months old, whereas in the past it was just over half.
Tracking Trends with the Sea Ice Index
Scientists at the National Snow and Ice Data Center (NSIDC) have been collecting data and images that give a measure of sea ice extent using a data record that begins in 1978.
Sea ice can be calculated in extent, area, and concentration. Sea ice extent can be measured relatively easily with satellite data. A simplified way of understanding the difference between area and extent is to imagine a slice of swiss cheese. Extent measures the total area within the edges of the slice of cheese. Area measures only where the cheese is present, not including the holes. Concentration measures the cheese (ice) coverage per unit area.
Sea ice is observed and calculat4ed using passive microwave satellite sensors. To these sensors, ponds of melt-water that emerge on the ice surface in summer appear to be open water rather than water on top of sea ice. While reliable for measuring area most of the year, the sensor is prone to underestimating the actual ice concentration and area when the surface is melting. Ice extent is not as prone to this seasonal inaccuracy. For this and other reasons, NSIDC scientists rely primarily on extent analyzing trends in sea ice cover.
The Sea Ice Index housed at NSIDC gives users insight into Arctic and Antarctic changes in sea ice. Data and images date from November 1978 to the present, providing users with a comprehensive look at long-term trends in sea ice cover.
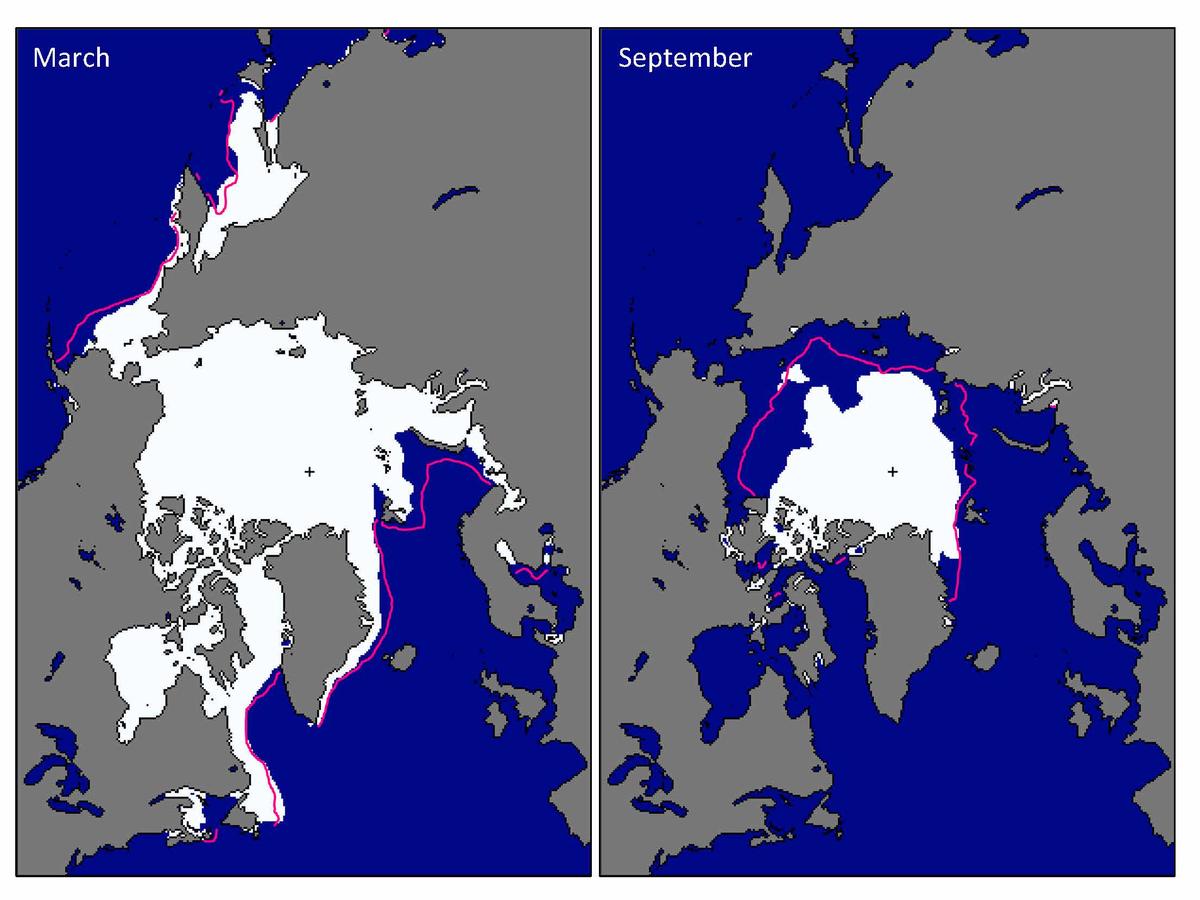 Average monthly sea ice extent in March 2016 (left) and September 2016 (right) illustrate the respective winter maximum and summer minimum events. The red line indicates the median ice extents in March and September, respectively, during 1981–2010.
Image courtesy of NSIDC
NSIDC offers tools to allow users to track and compare sea ice trends:
-
Chartic: Chartic is an interactive sea ice graphing tool.
-
Browse Image Subset Tool (BIST): The BIST allows users to quickly compare different time periods and regions, while also manipulating parameters controlling each axis.
NSIDC's NOAA-focused team (NOAA@NSIDC) is very well integrated into NOAA and NCEI's Arctic data operations. While Arctic climatology and oceanographic data come primarily from NCEI operations, there is quite a bit of data overlap between the organizations, with the NSIDC providing more data on sea ice, snow, and permafrost.
NOAA’s Earth System Research Laboratory (ESRL) Polar Observations and Processes Team utilizes NSIDC's satellite-derived sea ice data, as well as observations from other instruments in the Arctic, to try to understand how clouds, aerosols, and weather affect the energy balance at the interface of the air, ocean, and ice.
“It's critical to understand what the processes are and how they affect the sea ice,” said Janet Intrieri, ESRL scientist. “For example, clouds have different warming or cooling effects depending on their properties. Taking into account how the ocean and atmosphere transfer heat to the sea ice is one of the key processes that control whether you’re forming ice or losing ice.”
ESRL has developed Experimental Arctic Sea Ice Forecasts to better understand the processes that affect sea ice through a forecast lens.
“The Arctic is experiencing so many changes right now,” said Intrieri, “that it’s important for us to keep working to understand what changes are taking place.”
Gathering Data with DMSP Satellites
Passive microwave satellite sensors are used to collect data on sea ice. Objects on Earth’s surface emit both infrared radiation and microwaves at relatively low energy levels. When a sensor detects microwave radiation naturally emitted by Earth, that radiation is known as passive microwave. Clouds do not emit much microwave radiation compared to sea ice, so the microwaves can penetrate clouds and be used to detect sea ice during the day and night, regardless of cloud cover.
These passive microwave sensors used for sea ice detection are flying on Defense Meteorological Satellite Program (DMSP) satellites. There are three DMSP satellites in operation, the DMSP-F16, F17, and F18. The Sea Ice Index is now updated using F-18’s data.
All satellite instruments eventually malfunction, and F-18 is past its design life. Data collection will be replaced by other sensors used to track and measure sea ice. The U.S. National Ice Center, for example, uses radar, infrared, and visible band satellite imagery for producing its operations-centered daily and weekly analyses. They also have access to data from a satellite passive microwave sensor, the Advanced Microwave Scanning Radiometer 2. None of these can easily be made compatible with Sea Ice Index processing, nor do the programs that sponsor them have the continuity of the Defense Meteorological Satellite Program. With no plans to launch a new DMSP series imaging passive microwave sensor, the data product may come to an abrupt halt.
“This is a threat to the continuation of the Sea Ice Index, but aside from that, many scientists rely on having a long, continuous, and continuing record of sea ice that they can rely on for their work. Losing the DMSP instrument data one day is something that we at NSIDC are planning for, with partners in NOAA and NASA,” notes Florence Fetterer, NSIDC's NOAA liaison.
Those interested in learning more about sea ice data and trends can visit the Arctic Sea Ice News and Analysis (ASINA) site, hosted by NSIDC. ASINA provides a scientific analysis of Arctic sea ice conditions, including monthly updates during the first week of each month.


