Monthly Report Summary Information
The Monthly Report Summary Information is a synopsis of the collection of national and global summaries released each month.
National Summary Information - April 2015
See Full Report
For extended analysis of regional temperature and precipitation patterns,as well as extreme events, please see our full report that will be released on May 12th.
April was 17th warmest on record for the Contiguous United States
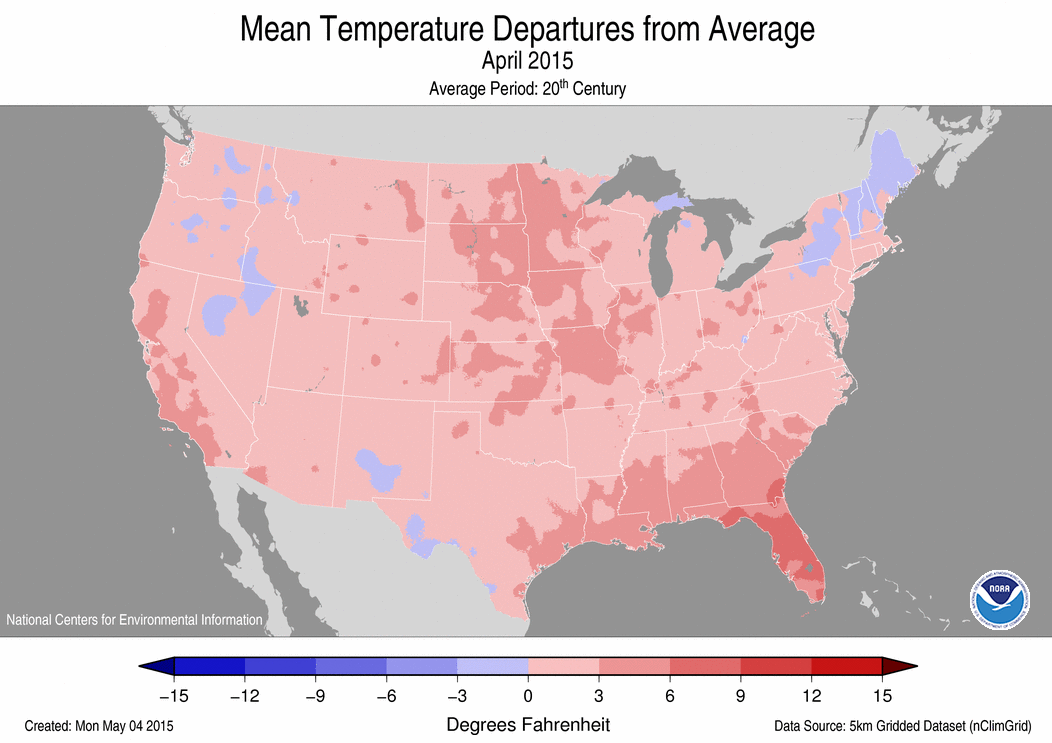
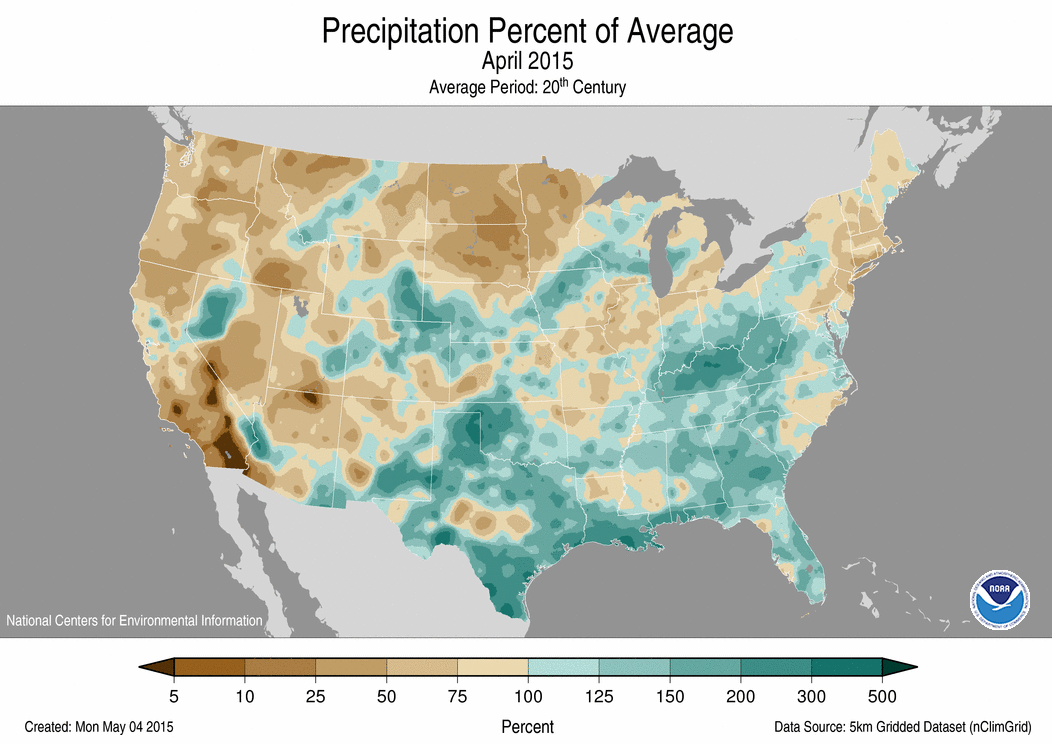
The April contiguous U.S. average temperature was 53.1°F, 2.1°F above the 20th century average — the warmest April since 2012. Much of the contiguous U.S. was warmer than average, especially the Southeast. The April Lower 48 precipitation total was 2.78 inches, 0.26 inch above average, ranking among the wettest third of the historical record.
Drought continued to intensify in the Upper Midwest and Northern Plains, while flooding rains impacted the Ohio Valley. The wet season ends in California and the Pacific Northwest with little chance for significant drought improvement going into summer.
This analysis of U.S. temperature and precipitation is based on data back to January 1895, resulting in 121 years of data.
April
- The Southeast was much warmer than average during April, driven largely by record and near-record warm nighttime temperatures. Florida had its warmest April on record with a statewide average temperature of 75.4°F, 6.1°F above the 20th century average. This exceeded the previous record set in 1908 by 0.7°F. Georgia, South Carolina and Louisiana were also much warmer than average during April.
- Wetter than average conditions stretched from the Southern Plains into the Southeast and Ohio Valley. Kentucky, Louisiana and West Virginia were much wetter than average. Kentucky had its second wettest April on record with nearly twice the average monthly precipitation. The state was plagued by widespread flooding early in the month.
- According to the April 28 U.S. Drought Monitor report, 37.4 percent of the contiguous U.S. was in drought, up slightly from 36.8 percent at the end of March. Drought conditions worsened across parts of the Northwest, Northern Plains and Upper Midwest. Over 92 percent of Minnesota and 77 percent of South Dakota were in drought — both states were nearly drought free at the beginning of 2015. Heavy precipitation across parts of the Southern Plains and central Gulf Coast improved both long-term and short-term drought conditions. Drought conditions remain entrenched in the West.
U.S. climate highlights: Year-to-date (January-April)
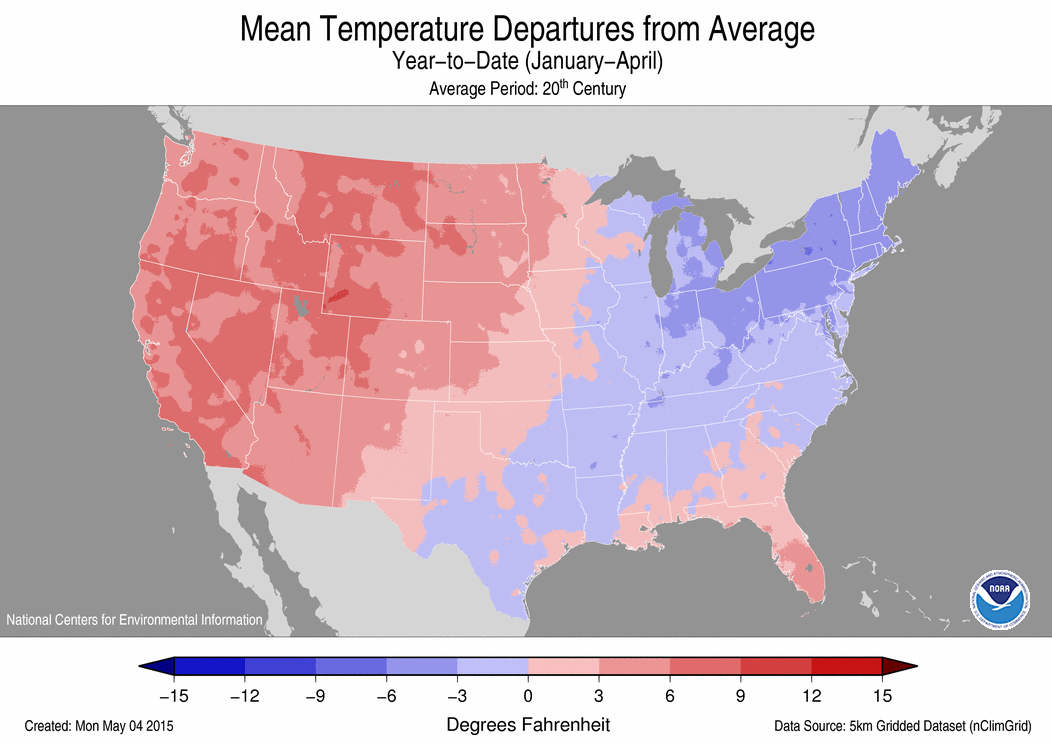
- The year-to-date contiguous U.S. average temperature was 41.1°F, 2.0°F above the 20th century average, and the 20th warmest January-April on record.
- Much-warmer-than average conditions were observed from the Rockies to the West Coast, including Alaska. Arizona and California were record warm, with temperature departures from average of 5.1°F and 6.3°F, respectively. In California, this bested the previous record warm January-April, which occurred last year, by 1.1°F.
- Below-average temperatures were observed in the Midwest and Northeast, where 11 states were much cooler than average. No state was record cold, but Massachusetts and New York each had their second coldest start to the year on record; only January-April 1904 was colder for both states.
- The year-to-date contiguous U.S. precipitation total was 8.49 inches, 0.98 inch below the 20th century average. This tied the 18th driest January-April on record.
- Above-average precipitation was observed across the Southern Plains and Ohio Valley, where Texas was much wetter than average. Below-average precipitation was observed from the West Coast, through the Northern Plains, the Midwest and into the Northeast, where 13 states were much drier than average. Following a winter with very little snow, South Dakota was record dry for the first four months of 2015, with a mere 1.68 inches of precipitation, 2.33 inches below average. The previous record dry January-April occurred in 1934, when 1.81 inches of precipitation was observed.
- The U.S. Climate Extremes Index (USCEI) for the year-to-date was 40 percent above average and the 15th highest value on record. The warm West and cold Northeast temperature pattern during January-April contributed to the much above average USCEI, with the components that measure both warm and cold daytime and nighttime temperatures being much above average. The USCEI is an index that tracks extremes (falling in the upper or lower 10 percent of the record) in temperature, precipitation and drought across the contiguous U.S.
For extended analysis of regional temperature and precipitation patterns, as well as extreme events, please see our full report that will be released on May 12th.
 NOAA's National Centers for Environmental Information


