Global Summary:
PLEASE NOTE: The ranks and temperature anomalies in this report represent the values known at the time the report was issued. The actual ranks will change as subsequent years are added to the dataset. The anomalies themselves may change slightly as missing or erroneous data is resolved. Also, in 2009, NCDC switched to ERSST version 3b (from version 2) as a component of its global surface temperature dataset. Because the versions have slightly different methodologies, the calculated temperature anomalies will differ slightly. For more information about this switch please see the Global Surface Temperature Anomalies FAQ .
Global Temperatures
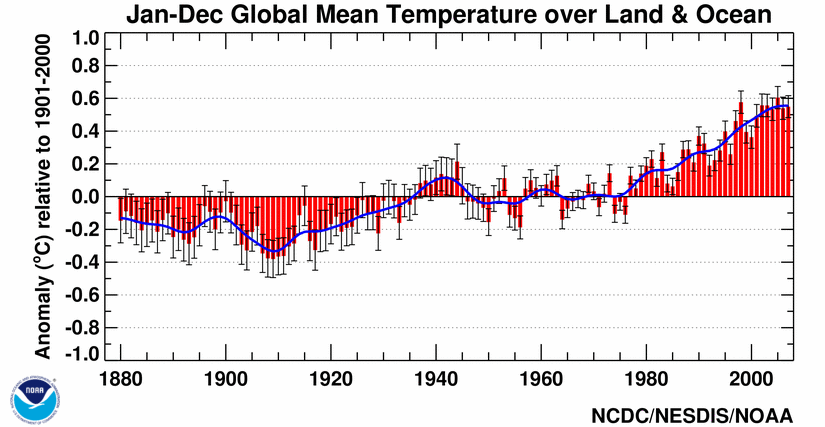
The global annual temperature for combined land and ocean surfaces in 2007 was +0.55°C (+0.99°F) above the 20th century average, ranking 5th warmest in the period of record. The effect of continued presence of La Niña conditions on the December global surface temperature resulted in a slightly lower ranking for the year as a whole. Globally averaged land temperatures were 1.02°C (1.84°F) while the ocean temperatures were 0.38°C (0.68°F) above average, ranking as the warmest and ninth warmest, respectively. The land and ocean surface temperatures for the Northern and Southern Hemisphere ranked second and tenth warmest, respectively. As discussed in the Temperature Trends section below, seven of the eight warmest years on record have occurred since 2001, part of a rise in temperatures of more than 0.6°C (1°F) since 1900. Within the past three decades, the rate of warming in global temperatures has been approximately three times greater than the century scale trend. See the global time series.
| Global Top 10 Warm Years | Anomaly °C | Anomaly °F |
|---|---|---|
| 2005 | 0.60 | 1.08 |
| 1998 | 0.58 | 1.04 |
| 2002 | 0.56 | 1.01 |
| 2003 | 0.56 | 1.01 |
| 2007 | 0.55 | 0.99 |
| 2006 | 0.54 | 0.97 |
| 2004 | 0.53 | 0.96 |
| 2001 | 0.49 | 0.89 |
| 1997 | 0.46 | 0.83 |
| 1995 | 0.40 | 0.72 |
2007 began with a weak warm phase (El Niño) ENSO which had developed during late 2006, but immediately began its transition to a neutral phase during February 2007, persisting as a neutral phase until the boreal summer. During August, sea surface temperatures (SST) anomalies were cooler-than-average in the Niño 1+2 and 3 regions indicating the first signs of a developing cold event (La Niña). By October, La Niña conditions strengthened when SST anomalies continued to decrease in the Niño 3.4. By the end of December, moderate-strength La Niña conditions were present across the equatorial Pacific Ocean. This La Niña event is likely to persist into early 2008, according to the latest information from NOAA's Climate Prediction Center. For more information on the state of ENSO during 2007, please see the ENSO monitoring annual summary.
| January- December |
Anomaly | Rank | Warmest (or Next Warmest) Year on Record |
|---|---|---|---|
GlobalLandOcean Land and Ocean |
+1.02°C (+1.84°F) +0.38°C (+0.68°F) +0.55°C (+0.99°F) |
warmest 9th warmest 5th warmest |
2005 (+0.97°C/1.75°F) 2003 (+0.48°C/0.86°F) 2005 (+0.60°C/1.08°F) |
Northern HemisphereLandOcean Land and Ocean |
+1.19°C (+2.14°F) +0.42°C (+0.76°F) +0.71°C (+1.28°F) |
warmest 7th warmest 2nd warmest |
2005 (+1.03°C/1.85°F) 2005 (+0.54°C/0.97°F) 2005 (+0.72°C/1.30°F) |
Southern HemisphereLandOcean Land and Ocean |
+0.50°C (+0.90°F) +0.35°C (+0.63°F) +0.37°C (+0.67°F) |
8th warmest 10th warmest 10th warmest |
2005 (+0.82°C/1.48°F) 1998 (+0.50°C/0.90°F) 1998 (+0.53°C/0.95°F) |
The 1901-2000 average combined land and ocean annual temperature is 13.9°C (56.9°F), the annually averaged land temperature for the same period is 8.5°C (47.3°F), and the long-term annually averaged sea surface temperature is 16.1°C (60.9°F).
Regional Temperatures
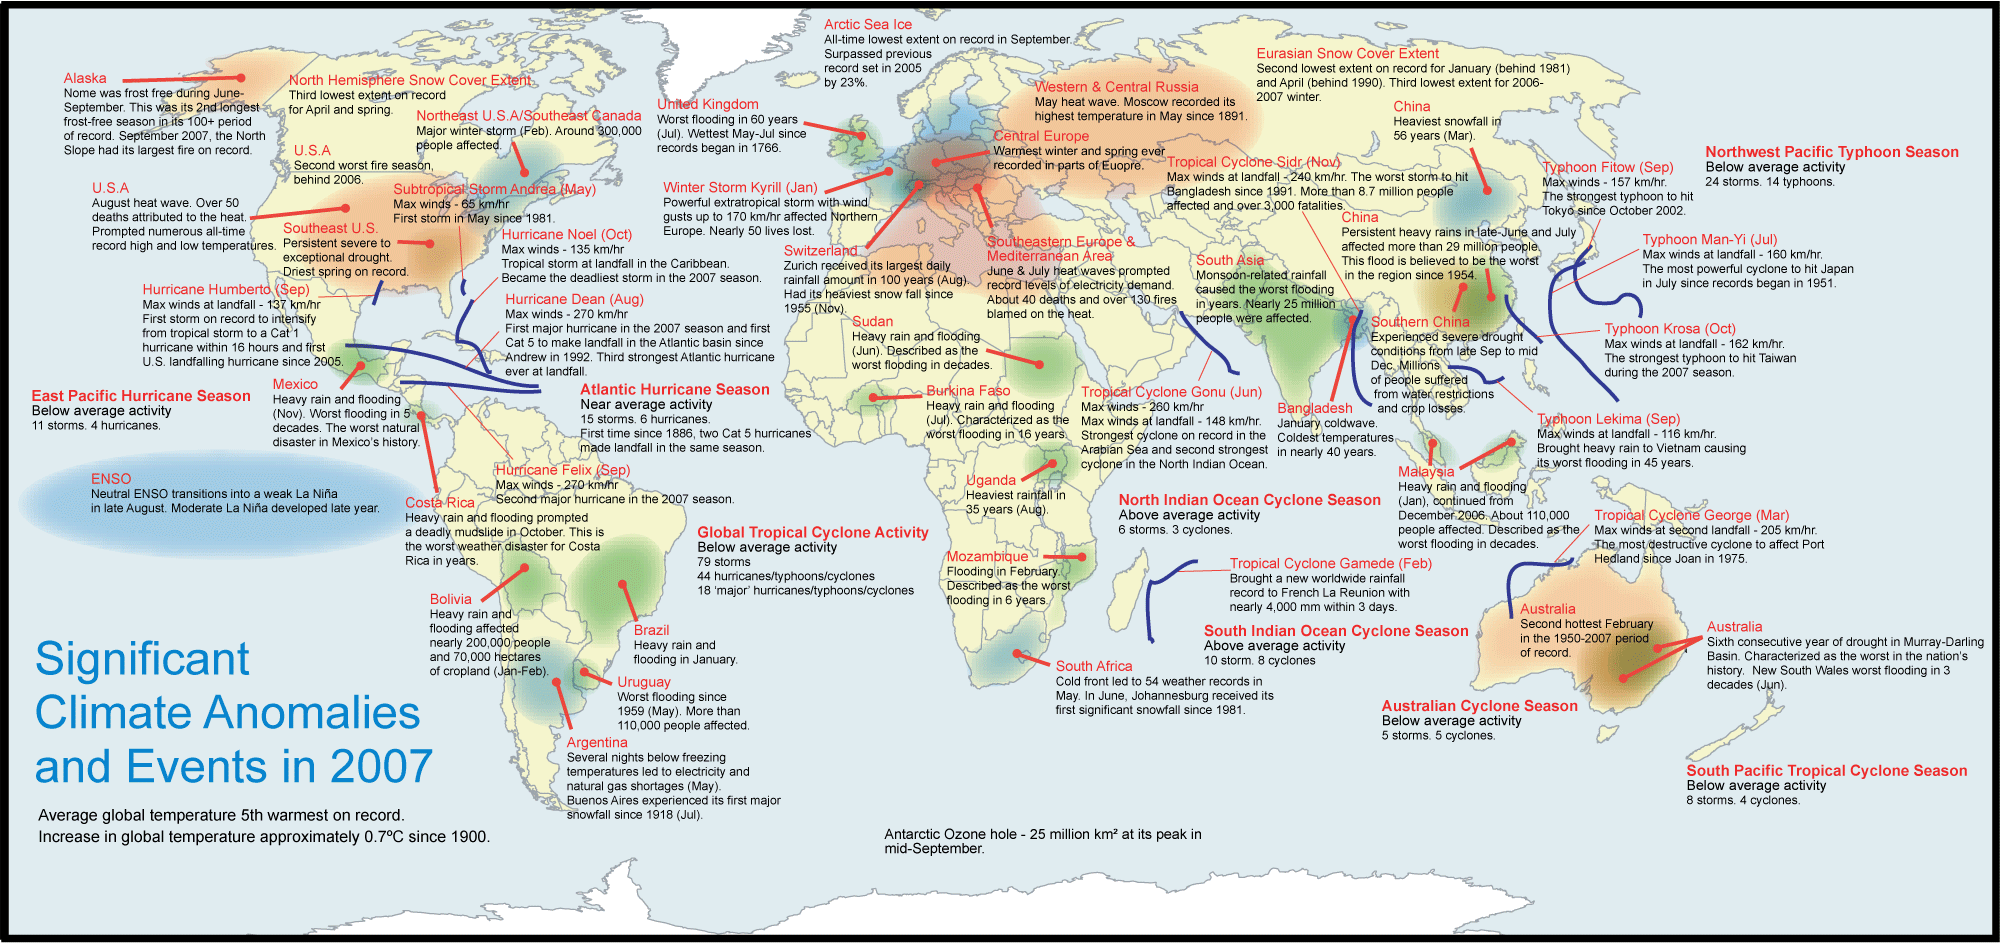
Warmer-than-average temperatures occurred throughout the year in most land areas of the world, with the exception of cooler-than-average anomalies in the southern parts of South America. The largest warmer-than-average anomalies were present throughout high latitude regions of the Northern Hemisphere including much of North America, Europe, and Asia. Temperature anomalies in these regions ranged from 2-4°C (3.6-7.2°F) above the 1961-1990 average.


The map, above left, is created using data from the Global Historical Climatology Network (GHCN), a network of more than 7,000 land surface observing stations. The map, above right, is a product of a merged land surface and sea surface temperature anomaly analysis developed by Smith and Reynolds (2005). Temperature anomalies with respect to the 1961-1990 mean for land and ocean are analyzed separately and then merged to form the global analysis. Additional information on this product is available.
Notable temperature extremes in 2007 included a heat wave that affected a large portion of the United States throughout the month of August. The Central and Southeastern U.S. were particularly affected, with over 50 deaths attributed to soaring high temperatures. The anomalous warmth exacerbated drought conditions in the southeastern region and also contributed for 29 all-time record high maximum temperatures and 35 all-time record high minimum temperatures.
Hot weather also enveloped much of the western and central parts of Russia as well as the southeastern Europe during May and June-July, respectively. Moscow, Russia recorded its highest temperature in May since 1891 and this was the first time in 128 years that the Russian capital experienced sustained 30°C (86°F) or higher temperatures. Meanwhile in southeastern Europe, temperatures were well over 40°C (104°F) in many areas prompting electricity demands to soar record levels. The warm conditions contributed to over 130 fires and over 500 fatalities.
In South Africa, a cold front which affected much of the country led to 21 fatalities and 54 weather records during May 21-22. Most of the records were for lowest maximum and minimum daily temperatures. In Argentina, the last week of May experienced unseasonably cold temperatures which led to electricity and natural gas shortages. In April, a devastating cold wave affected much of the central Plains, Midwest, and the Southeast region of the contiguous U.S. Temperatures dipped well below freezing in many areas prompting nearly 1,240 broken daily minimum temperature records and producing significant crop damages.
Additional information on other notable weather events can be found in the Significant Events section of this report.
Global Precipitation
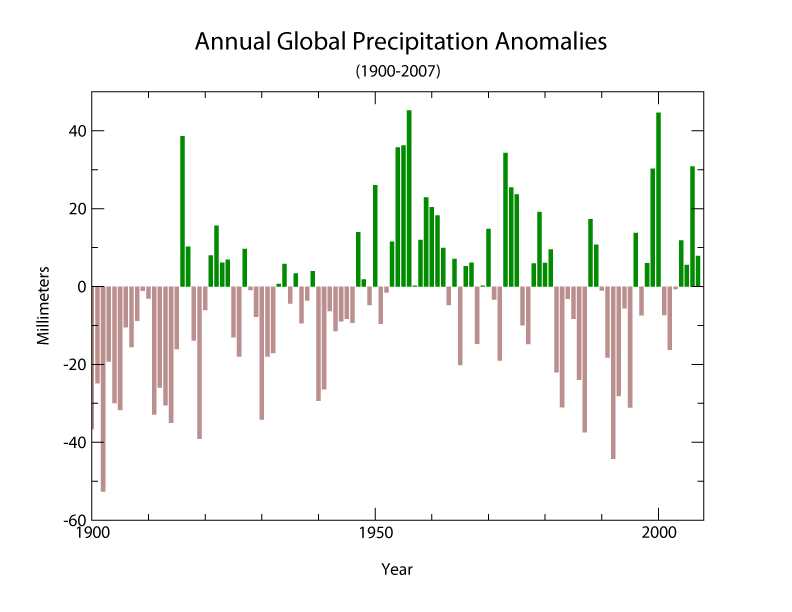
Global precipitation in 2007 was above the 1961-1990 average. Precipitation throughout the year was variable in many areas. Regionally drier than average conditions were widespread across the southeastern and western contiguous U.S., northern India, the eastern coast of Brazil, the southern and eastern parts of Australia, and parts of eastern Asia. Meanwhile the central U.S. and parts of Europe and Asia experienced wetter than average conditions.

In Australia, a six-year drought affected the Murray-Darling Basin in April. It was described as the worst drought in the nation's history. Precipitation in China was variable throughout the country with periods of heavy rain and in some areas extreme drought. The province of Gansu suffered its worst drought since 1940 during May. While in July, severe storms produced torrential rain that caused floods that affected nearly 500,000 people. In the province of Chongqing, a 24-hour rainfall record was broken when 227 mm (9 inches) of rain fell from July 16-17.
During January-February, heavy rain fell in Bolivia producing floods that affected nearly 200,000 people and 70,000 hectares (173,000 acres) of cropland. In early May, Uruguay was hit by the worst flooding since 1959 which affected more than 110,000 people and severely damaged crops and buildings.
In Costa Rica, heavy rain that fell during October 10-11 caused widespread floods that washed away over 800 homes and prompted a deadly mudslide on the 11th. The mudslide, according to reports, is the worst weather disaster for Costa Rica in years, claiming 14 lives and burying hundreds of homes in the town of Atenas. In Nicaragua, the heavy rain affected 10,000 people and destroyed homes and crops. According to reports, 600 mm (24 inches) of rain fell in a period of four days.
In November torrential rain, which commenced in late October, fell over the state of Tabasco, Mexico causing devastating floods. The heavy rain triggered widespread floods, prompted deadly landslides, and caused rivers to flow over their banks, leading to the worst flooding in more than 5 decades. Approximately 80% of the state was under water, homes and crops were destroyed, and about half a million people were left homeless.
On December 17, heavy rainfall triggered floods across southern Thailand which affected thousands of villagers and caused 8 districts to be declared as disaster zones. The flooding was characterized as the most severe to strike the region in 10 years.
For more information about precipitation extremes during 2007, see the annual report of Significant Events.
Additional information on other notable weather events can be found in the Significant Events section of this report.
NOAA's National Climatic Data Center is the world's largest active archive of weather data. The temperature and precipitation rankings are available from the center by calling: 828-271-4800.
NOAA works closely with the academic and science communities on climate-related research projects to increase the understanding of El Niño and improve forecasting techniques. NOAA's Climate Prediction Center monitors, analyzes and predicts climate events ranging from weeks to seasons for the nation. NOAA also operates the network of data buoys and satellites that provide vital information about the ocean waters, and initiates research projects to improve future climate forecasts.
References
Christy, John R., R.W. Spencer, and W.D. Braswell, 2000: MSU tropospheric Temperatures: Dataset Construction and Radiosonde Comparisons. J. of Atmos. and Oceanic Technology, 17, 1153-1170.
Free, M., D.J. Seidel, J.K. Angell, J. Lanzante, I. Durre and T.C. Peterson (2005) Radiosonde Atmospheric Temperature Products for Assessing Climate (RATPAC): A new dataset of large-area anomaly time series, J. Geophys. Res., 10.1029/2005JD006169.
Free, M., J.K. Angell, I. Durre, J. Lanzante, T.C. Peterson and D.J. Seidel(2004), Using first differences to reduce inhomogeneity in radiosonde temperature datasets, J. Climate, 21, 4171-4179.
Fu, Q., C.M. Johanson, S.G. Warren, and D.J. Seidel, 2004: Contribution of stratospheric cooling to satellite-inferred tropospheric temperature trends. Nature, 429, 55-58.
Lanzante, J.R., S.A. Klein, and D.J. Seidel (2003a), Temporal homogenization of monthly radiosonde temperature data. Part I: Methodology, J. Climate, 16, 224-240.
Lanzante, J.R., S.A. Klein, and D.J. Seidel (2003b), Temporal homogenization of monthly radiosonde temperature data. Part II: trends, sensitivities, and MSU comparison, J. Climate, 16, 241 262.
Mears, Carl A., M.C. Schabel, F.J. Wentz, 2003: A Reanalysis of the MSU Channel 2 tropospheric Temperature Record. J. Clim, 16, 3650-3664.
Peterson, T.C. and R.S. Vose, 1997: An Overview of the Global Historical Climatology Network Database. Bull. Amer. Meteorol. Soc., 78, 2837-2849.
Quayle, R.G., T.C. Peterson, A.N. Basist, and C. S. Godfrey, 1999: An operational near-real-time global temperature index. Geophys. Res. Lett., 26, 333-335.
Smith, T.M., and R.W. Reynolds (2005), A global merged land air and sea surface temperature reconstruction based on historical observations (1880-1997), J. Clim., 18, 2021-2036.