National Overview:

 June Average Temperature Departures |
 June Percent of Average Precipitation |
- Climate Highlights — June
- The June contiguous U.S. average temperature was 71.4°F, 2.9°F above the 20th century average, second only to June 1933 in the 121-year period of record. The June 1933 average temperature for the Lower 48 was 71.6°F.
- The June contiguous U.S. maximum (daytime) temperature was 83.6°F, 2.2°F above average, the 14th warmest on record. The June contiguous U.S. minimum (nighttime) temperature was 59.1°F, 3.4°F above average. This was the warmest June minimum temperature on record and 0.7°F warmer than the previous record that occurred in 2010.
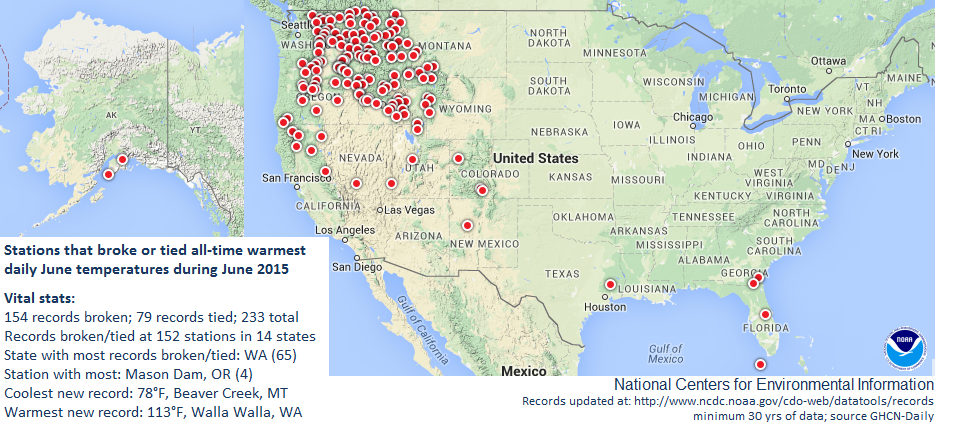
- Record and near-record warmth stretched from the Rockies to the West Coast and along the Southeast Coast, where 16 states were much warmer than average. California, Idaho, Oregon, Utah, and Washington were each record warm for June.
- Several western cities set new all-time June temperature records, due in part to an intense heatwave the second half of the month, including Boise, Idaho where the temperature soared to 110°F. During the entire month, 233 all-time warm June daily temperature records were broken or tied, mostly across the Northwest. The warmest such record was set in Walla Walla, Washington, where the temperature reached 113°F. This was 1.0°F shy of the all-time record in Walla Walla, which was set in 1975.
- The Northeast and Great Lakes region had near- to below-average June temperatures. Above-average precipitation across the region was associated with suppressed daytime temperatures, while nighttime temperatures were near- to above- average.
- The Alaska statewide average temperature for June was the sixth warmest in 91 years of record keeping at 52.4°F, 3.1°F above average. Homer, Alaska, had its warmest June on record. Prolonged-warmth and dryness and lack of winter snow created ideal wildfire conditions with dozens of large wildfires impacting central and southern areas of the state during June.
- During June, there were 5,622 record warm daily high (2,086) and low (3,536) temperature records, which is more than five times the 1,066 record cold daily high (927) and low (139) temperature records.
- Based on NOAA's Residential Energy Demand Temperature Index (REDTI), the contiguous U.S. temperature-related energy demand during June was 53.3 percent above average and the 16th highest in the 1895-2015 period of record.
- The June precipitation total for the contiguous U.S. was 3.53 inches, 0.60 inch above average. This was the ninth wettest June on record, and marked the third consecutive month of above-average precipitation for the Lower 48.
- Wetter than average conditions were widespread from the Southwest, through parts of the Great Plains, and across the Midwest and Northeast — 15 states were much wetter than average. Illinois, Indiana, and Ohio were each record wet during June with monthly precipitation totals more than twice the 20th century average. For Illinois, June 2015 was the second wettest month of any month with 9.30 inches of precipitation. Only September 1926 was wetter when 9.62 inches of precipitation was observed.
- Tropical Storm Bill made landfall along Matagorda Island, Texas on June 16th with sustained winds of 60 mph. The storm tracked across the Southern Plains and into the Ohio Valley through the 20th, dropping heavy rains. In Texas and Oklahoma, Bill contributed to many locations having 60-day precipitation totals exceeding 40 inches. Recording flooding was observed in parts of Texas.
- Below-average precipitation was observed in the Northwest, where drought conditions worsened due to both record warmth and lack of precipitation. Oregon had its ninth driest June, while Washington had its third driest. A dismal snowpack from the preceding winter also contributed to the worsening drought conditions across the Northwest, with minimal melt-water runoff occurring during the spring and early summer.
- According to the June 30 U.S. Drought Monitor report, 25.9 percent of the contiguous U.S. was in drought, up from 24.6 percent at the beginning of June. Drought conditions improved across the Southwest, Upper Midwest, and the Northeast, but worsened in the Northwest and Southeast. Drought conditions remain dire across California, with 46.7 percent of the state experiencing the worst category of drought (D4, exceptional).
Temperature
June 2015 Statewide Temperature and Precipitation ranks
Precipitation
- Climate Highlights — year-to-date (January–June)
- The average contiguous U.S. temperature for the first half of 2015 was 49.5°F, 1.9°F above the 20th century average, and the 10th warmest January-June on record. The January-June contiguous U.S. maximum (daytime) temperature was 61.2°F, 1.9°F above average, the 14th warmest on record. The January-June contiguous U.S. minimum (nighttime) temperature was 37.7°F, 2.0°F above average and the 11th warmest on record.
- Above-average January-June temperatures were observed from the Great Plains to the West Coast, as well as in Florida. California, Nevada, Oregon, and Washington each had their warmest year-to-date on record. Eight additional states were much warmer than average, including Alaska which had its second warmest January-June in the 91-year period of record with a temperature 5.1°F above average. The California year-to-date temperature was 58.5°F, 5.2°F above average, and 0.5°F warmer than the previous record set just last year.
- Record and near-record warm minimum and maximum temperatures were widespread in the West, with seven states having a record warm January-June minimum temperature, and five additional states being much warmer than average. California and Oregon had record warm maximum temperatures for the six-month period, with nine additional western states being much warmer than average.
- Below-average year-to-date temperatures were observed across the Midwest and Northeast, where Maine, New York, and Vermont were each much cooler than average. No state was record cold for the six-month period.
- Minimum temperatures were much cooler than average for much of the Northeast. New York had its fifth coolest January-June average minimum temperature on record. Massachusetts and New Hampshire each had their ninth coolest.
- Based on REDTI, the contiguous U.S. temperature-related energy demand during January-June was 7.8 percent above average and the 49th highest in the 1895-2015 period of record.
- The year-to-date contiguous U.S. precipitation total was 16.53 inches, 1.22 inches above the 20th century average, the 19th wettest January-June on record and wettest since 1998.
- Above-average precipitation was observed across the Great Plains, Southern Rockies, and Midwest where four states were much wetter than average. Texas had its wettest year-to-date on record with 24.04 inches, 10.70 inches above average. The previous record wet January-June for Texas occurred in 1941 with 21.72 inches of precipitation. This is a drastic turnaround from just four years ago, when the January-June precipitation total was just 5.71 inches in 2011, the lowest amount in the 121-year period of record.
- Below-average precipitation was observed across the West, Southeast, and New England. California had its fifth driest start to the year with only 45.9 percent of average precipitation, while Oregon had its ninth driest with 69.8 percent of average precipitation.
- The U.S. Climate Extremes Index (USCEI) for the year-to-date was 45 percent above average and the 13th highest value on record. On the national-scale, extremes in warm maximum and minimum temperatures and days with precipitation were much above average. The USCEI is an index that tracks extremes (falling in the upper or lower 10 percent of the record) in temperature, precipitation and drought across the contiguous Unites states.
- Regionally, the CEI was record high in the West due warm maximum and minimum temperatures, the spatial extent of drought, and days without precipitation. CEI was near-record high in the Northwest and Southwest due to warm maximum and minimum temperatures.
Temperature
January-June 2015 Statewide Temperature and Precipitation ranks
Precipitation
Extremes
**A comparison of the national temperature departure from average as calculated by NCDC's operational dataset (nClimDiv), the U.S. Historical Climatology Network (USHCN), and the U.S. Climate Reference Network (USCRN) is available on our National Temperature Index page.**
Regional Highlights:
These regional summaries were provided by the six Regional Climate Centers and reflect conditions in their respective regions. These six regions differ spatially from the nine climatic regions of the National Climatic Data Center.
- Northeast Region: (Information provided by the Northeast Regional Climate Center)
- The Northeast's average temperature for June was 64.7 degrees F (18.2 degrees C), which was 0.6 degrees F (0.3 degrees C) cooler than normal. Temperatures varied across the region, with departures ranging from 3.3 degrees F (1.8 degrees C) below normal in Maine, making it the state's 15th coolest June, to 2.0 degrees F (1.1 degrees C) above normal in West Virginia, making it the state's 17th warmest June. Two other states ranked the month among their top 20 warmest: Delaware had its 11th warmest June and Maryland had its 13th warmest.
- The Northeast went from a very dry May to a very wet June. The Northeast saw 7.29 inches (185.17 mm) of rainfall, which was 173 percent of normal and made it the 3rd wettest June on record. All 12 states ranked the month among their top 20 wettest: Pennsylvania, 2nd wettest; Maryland and New York, 3rd wettest; Vermont, New Jersey, and Delaware, 4th wettest; New Hampshire, 6th wettest; Massachusetts, 10th wettest; West Virginia, 12th wettest; Maine, 16th wettest; and Connecticut and Rhode Island, 18th wettest. Departures ranged from 132 percent of normal in Rhode Island to 230 percent of normal in Maryland. As for the 35 major Northeast airport climate sites, Baltimore, Maryland had a record-wet June with 13.09 inches (332.49 mm), which was 378 percent of normal.
- The U.S. Drought Monitor released on June 4 showed areas of moderate drought in New England, New York, New Jersey, and Pennsylvania (totaling 13 percent of the Northeast). In addition, 38 percent of the region was abnormally dry. Abundant rainfall throughout the month helped ease some of the dryness. By the end of June, 10 percent of the Northeast was experiencing moderate drought conditions, while 21 percent of the region was abnormally dry.
- Agriculture was impacted in areas that experienced a cool, wet June. Fieldwork was slowed, with some low-lying fields flooded. Late-planted corn and soybeans were stunted and yellow, while diseases were a concern for fruit growers. Severe storms affected the Northeast frequently during June. Thirteen tornadoes, all EF-0 or EF-1 in strength, touched down in Pennsylvania, New York, West Virginia, Massachusetts, and Maryland. Several funnel clouds were reported, and straight-line winds caused damage. Large hail fell across the region, including a 4-inch (10 cm) hailstone in Baltimore County, Maryland, on June 23. It was only the fourth time since 1950 that hail of that size has fallen in the state. In addition, heavy rain caused flash flooding.
- For more information, please go to the Northeast Regional Climate Center Home Page.
- Midwest Region: (Information provided by the Midwest Regional Climate Center)
- June average temperatures across the Midwest region ranged from the upper 50s degrees F (13-15 degrees C) in the Upper Peninsula of Michigan and Arrowhead of Minnesota, warming consistently into the lower and mid 70s F (22–24 C) into southern Iowa, much of Illinois, Indiana, Ohio, and eastern Kentucky. Western Kentucky, far southern Indiana, Illinois, and portions of southern Missouri had average temperatures in the mid to upper 70s F (24–26 C). In regards to normal, June average temperatures were colder than normal in the Upper Peninsula of Michigan by 3 to 4 degrees F (1.7–2.2 C), with eastern Wisconsin 1 to 2 degrees F (0.6–1.1 C) below normal. Much of Michigan was also 1 to 2 degrees F (0.6–1.1 C) below normal. Elsewhere, temperatures were within 1 degrees F (0.6 C) of normal across much of the Midwest region with above normal temperatures along and south of the Ohio River Valley and most of Missouri. These regions were 1 to 3 degrees F (0.6–1.7 C) warmer than normal for the month of June. The cooler than normal and close to normal temperatures over the north central portion of the region were dictated by cooler than normal average maximum temperatures. Warmer than normal average low temperatures across the southern half of the region and portions of Iowa and Minnesota moderated average temperatures for the month. Average low temperatures in the southern half of the region were 1 to 4 degrees F (0.6–2.2 C) above normal, with pockets of warmer average minimum temperatures 4 to 6 degrees F (2.2–3.3 degrees C) above normal in Missouri and far eastern Kentucky. Missouri was the warmest state, ranking the 39th warmest on record with an average temperature of 74.3 F (23.5 C). The coldest state was Michigan with an average temperature of 62.4 F (16.9 C) ranking as Michigan's 38th coldest June on record.
- The heartland of the Midwest saw prolific amounts of precipitation during June 2015, ranking June 2015 as the Midwest's 6th wettest June on record (1895-2015). Total observed rainfall exceed 10 inches (254 mm) in areas of northeast Missouri, sections of southern Illinois and northeast central Illinois, along with north central Indiana and a small portion of northwest Ohio. Missouri, Illinois, Indiana, and Ohio were by far the wettest states for the month of June receiving 158% to 221% of normal rainfall, all observing more than 5 inches (127 mm) of rain, with the heart of the precipitation falling across Illinois and Indiana where much of each state observed more than 7.5 inches (190.5 mm) of precipitation. Many local station records for daily and monthly rainfall were broken in June across Missouri, Illinois, Indiana, and Ohio with localized monthly reports of over 18 inches (457 mm) in Jasper County Indiana, 16.05 inches (407.7 mm) in St. Louis, Missouri, 20.15 (511.8 mm) inches in Troy, Missouri, 14.51 inches (368.6 mm) in Danville, Illinois, and 16.64 inches (422.7 mm) in Lima, Ohio. Areas of Iowa were also impacted by heavy rain events. A June 24th rainfall event dropped 7.3 inches of rain (185.4 mm) at Columbia, Iowa, with monthly totals in some portions central and southeast Iowa reaching more than 13 inches (330 mm). As a departure from normal, a swath of rainfall 6 to 8 inches (152.4–203.2 mm) (with a few locations in Missouri 8 to 10 inches (203.2–254 mm)) above normal, fell from just north of the Saint Louis area extending northeastward through central and north central Illinois, then onward to the east across north central Indiana and northwest Ohio. Illinois, Indiana, and Ohio experienced their wettest June on record, with Illinois observing 9.3 inches (236.22 mm) of rain beating the previous record of 8.27 inches (210.1 mm) set in 1902, Indiana observing 8.9 inches (226.1 mm) of rain beating the previous record of 8.13 inches (206.5 mm) set in 1958, and Ohio observed 8.15 inches (207 mm) of rain beating the previous record of 7.27 inches (184.7 mm) set in 1902. Missouri had its 10th wettest June on record observing 7.3 inches (185.4 mm) of rain statewide. The driest states in June were Minnesota, only receiving 86% of its normal precipitation (3.68 inches (93.5 mm)–normal of 4.29 inches (109 mm)), followed by Wisconsin which received 103% of its normal precipitation (4.35 inches (110.5 mm) — normal of 4.21 inches (106.9 mm)).
- Heading into June, Minnesota, much of Wisconsin, Michigan, northern Indiana and Ohio, the eastern half of Kentucky, and portions of the immediate Ohio River Valley in Indiana and Ohio were classified as abnormally dry by the U.S. Drought Monitor with pockets of moderate drought still present across northern Minnesota, the Minneapolis area, and northeast central Wisconsin. The abundant rainfall across much of the region in June alleviated the drought conditions across much of the Midwest with drought conditions nearly vanishing across the Midwest by June 30th, 2015. Too much rainfall, however, quickly changed what looked to be an ideal growing season into questionable growing season due to flooded fields. According to Ag Answers of Purdue University, estimates from models that use reported yields for the current year and prior years, corn and soybean crop loss reached $475 million dollars for Indiana due to ponding water in fields that starved plants of oxygen, leached away nitrogen. The spread of disease and stalk and root rot were also of concern. June 8th, USDA NASS rated the corn crop to be promising only to issue three week later that the crop would be around the second worst in 10 years. Ohio, Missouri, and Illinois have also reported crop damage from excess water. With all the rainfall came increased cloudiness as well. It was reported to be the cloudiest June on record at Chicago Midway Airport. The airport only averaged 46% sunshine. This broke the old record of 48% sunshine in June of 1942.
- The record breaking monthly rainfall in Illinois and Indiana with localized records across other states such as Missouri during June resulted in flooding across the region. The heaviest rainfall was observed along the Illinois River and the Kankakee River Valleys in Illinois, the Wabash River Valley in Indiana, and the Missouri River Valley in Missouri where major flooding occurred. As each of these rivers flow into the Mississippi River, flood warnings were issued along the Mississippi River from roughly Quincy, Illinois south all the way to Louisiana. Many warnings were still present heading into July. The Illinois River closed to vessel traffic in certain areas and all recreational traffic along much of the river on June 30th due to the high waters.
- Severe weather events were frequent across the Midwest during June. June 8th–11th was an active period that brought hail, wind damage, and tornadoes across the region. June 17th–22nd was another active period as the remnants of Tropical Storm Bill and several systems initiated thunderstorms with tornadoes, wind, and hail. A derecho event initiating in the Dakotas on the evening of the 21st tracked into Iowa and southwestern Wisconsin early in the morning of the 22nd bring winds of 72-95 miles per hour (116-153 km per hour) resulting in widespread damage to trees, power lines, grain bins, homes, and fields. After the derecho on June 22nd, storms initiated later that evening that generated an EF-3 tornado which damaged Coal City, Illinois. A total of 12 tornadoes were confirmed from this event by NWS-Chicago Romeoville, 8 of which were EF-1 intensity.
- For details on the weather and climate events of the Midwest, see the weekly summaries in the Midwest Climate Watch page.
- Southeast Region: (Information provided by the Southeast Regional Climate Center)
- Mean temperatures in June were above average across much of the Southeast region. The greatest departures were found across the Carolinas and southern Virginia, where monthly temperatures were 3 to 5 degrees F (1.7 to 2.8 degrees C) above average. Winnsboro, SC (1896–2015) tied its second warmest mean temperature for June on record, and Wilmington, NC (1874–2015) observed its third warmest June mean temperature on record. The unusual warmth during June was also exceptionally persistent at a few locations across the region. Raleigh, NC (1887–2015) observed 12 consecutive days (13th through the 24th) with a maximum temperature of at least 95 degrees F (35 degrees C), which is both the longest and earliest streak on record for this location. Charlotte, NC (1879–2015) observed the greatest number of June days (5) on record with a maximum temperature of at least 100 degrees F (37.8 degrees C). In addition, Charlotte's streak of three consecutive days (22nd through the 24th) with maximum temperatures of 100 degrees F or greater was both the earliest and tied for fifth longest streak on record for this location. Mean temperatures were also above average in Puerto Rico and the U.S. Virgin Islands. Guayama, PR (1914–2015) observed its warmest mean temperature for June on record. The warmest weather of the month occurred from the 15th through the 18th, as the subtropical Bermuda High expanded westward across the region. During this four-day period, maximum temperatures reached the middle 90s F (34.4 to 35.6 degrees C) across much of the region, with widespread portions of the Carolinas surpassing 100 degrees F. On the 22nd, a possible heat-related fatality was reported at a factory with limited air conditioning in Fayetteville, NC, where a 63-year-old woman collapsed and later died at a local hospital. In contrast, the coolest weather of the month occurred on the 3rd and 4th, as a modified Arctic high wedged into the region from the northeast. Daily maximum temperatures did not exceed 90 degrees F (32.2 degrees C) across much of the region excluding Florida, with temperatures remaining below 70 degrees F (21.1 degrees C) in portions of North Carolina and Virginia.
- Precipitation was generally below normal across the Southeast region, with pockets of exceptional wetness in portions of North Carolina and Virginia. The driest locations were found across northern Alabama and far southern Florida, where monthly precipitation totals were 3 to 8 inches (76 to 203 mm) below normal, or 50 to as little as 5 percent of normal. Stuart, FL (1935–2015) observed its driest June on record with only 1.83 inches (46 mm) of precipitation. Precipitation was also below normal for much of Puerto Rico and the U.S. Virgin Islands during June. Coloso, PR (1905–2015) observed its driest June on record with only 2.40 inches (61 mm) of precipitation. The wettest locations were found across portions of eastern North Carolina and Virginia, where monthly precipitation totals exceeded 200 percent of normal. Roanoke, VA (1912–2015) and Washington, DC (1872–2015) observed their second wettest June on record with 9.07 (230 mm) and 11.94 inches (303 mm) of precipitation, respectively. In addition, several locations tied their greatest number of June days on record with measurable precipitation, including Raleigh, NC (16 days), Roanoke, VA (16 days), Richmond, VA (1887–2015; 18 days), and Washington, DC (18 days). On the 2nd of the month, Norfolk, VA (1874–2015) observed its sixth wettest June day on record with 3.01 inches (76 mm) of precipitation.
- There were 1,287 severe weather reports across the Southeast during June, and nearly 90 percent of these reports were for damaging thunderstorm winds. At least one severe weather report was recorded within the region on all but one day during the month (7th), and there were a total of 12 days with 50 or more severe weather reports across the region. Large hail was reported in several states during June, including 2 inch (hen egg-sized) hail in Tift County, GA on the 3rd and 3 inch (tea cup-sized) hail in Powhatan County, VA on the 25th. At least 17 reporting stations across the region recorded 50 mph or higher thunderstorm wind gusts during the month. On the 10th, a 97 mph wind gust associated with a severe thunderstorm downburst was recorded on a 54-foot United States Air Force tower at Kennedy Space Center, FL. On the 20th, a 43-year-old female postal worker was killed when damaging straight-line winds caused a tree to fall on her vehicle in Lincoln County, NC. Eleven tornadoes (7 EF-0s, 4 EF-1s) were confirmed across the Southeast, which is slightly below the long-term (1950–2014) average of 15 tornadoes for the region during June. On the 27th, two EF-1 tornadoes associated with the same supercell thunderstorm touched down in Robeson County, NC, resulting in significant roof damage to a home near the town of Lumberton due to a fallen pecan tree. Later that day, another EF-1 tornado touched down in Lee County, NC, damaging one home and blowing a trampoline 130 yards downwind. A lightning strike on the 19th resulted in the death of an 81-year-old man in his front yard in Clearwater, FL. In addition, a woman was injured by a lightning strike while deboarding a plane at Columbia Metropolitan Airport in South Carolina on the 27th of the month.
- The development of moderate-to-severe drought conditions was observed across portions of the Southeast during June. The percentage of the region under drought-free conditions (less than D1) decreased from approximately 96 percent on June 2nd to 85 percent on June 30th. Moderate (D1) drought conditions developed across widespread areas of northern Alabama, central South Carolina, and west-central North Carolina, while severe (D2) drought conditions emerged in pockets of southeastern Georgia and northeastern Florida. In addition, severe drought continued to expand across far southern Florida, covering most of Miami-Dade and Broward Counties by the end of the month. The unusual warmth and extended periods of direct sunlight were detrimental to the watermelon crop in southern Georgia. Farmers were concerned that the nearly ripe watermelons could be susceptible to sun scalding, which reduces their exterior attractiveness and ability to be sold. Heavy irrigation was required to maintain the viability of the citrus crop in central and southern Florida, but the lack of rainfall during June aided in crop planting across the Florida Panhandle.
- For more information, please go to the Southeast Regional Climate Center Home Page.
- High Plains Region: (Information provided by the High Plains Regional Climate Center )
- It was a month of extremes across the U.S. this June. After having their wettest month ever, Texas and Oklahoma were dealt another blow with flooding triggered by Tropical Storm Bill. Flooding also occurred in neighboring states as its remnants moved off to the north and east. On the other end of the spectrum, hot and dry weather continued in the West, while drought conditions started to emerge in portions of the Southeast. A strong ridge in the West brought record breaking warmth to the Pacific Northwest, with numerous shattered records. Preliminary data suggest that two locations in Washington set a new all-time record high for June of 113 degrees F (45.0 degrees C). The strong ridge in the West impacted portions of the Missouri River Basin as areas of Wyoming, Montana, and northwestern Colorado had average temperatures in the 4.0-8.0 degrees F (2.2-4.4 degrees C) above normal range. Elsewhere across the High Plains region, temperatures were generally within 2.0 degrees F (1.1 degrees C) of normal, while larger departures on the warm side occurred in areas of Kansas, Colorado, and Wyoming. Meanwhile, precipitation varied across the region with heavy precipitation falling in areas of southeast Nebraska, the Black Hills of South Dakota, and parts Colorado including the Four Corners area and some locations along the Front Range. Most other areas of the region were near normal, however most of Kansas, northwestern Colorado, and southwestern Wyoming largely missed out on precipitation this month. The severe weather season continued with 980 reports across the High Plains region. Of this total 68 were tornado reports, 574 were hail reports, and 338 were wind reports. A notable event occurred during the afternoon and evening of June 27th in eastern North Dakota. According to the National Weather Service in Grand Forks, North Dakota, a tornado outbreak occurred with at least 19 confirmed tornadoes (18 in North Dakota and 1 in Minnesota). Luckily, these tornadoes tracked through open lands and did minimal damage.
- After a cool May, June was on the warmer side, especially for western portions of the High Plains region. Much of Nebraska, South Dakota, and North Dakota had monthly temperature departures within 2.0 degrees F (1.1 degrees C) above or below normal, while large areas of Kansas, Colorado, and Wyoming were at least 2.0 degrees F (1.1 degrees C) above normal. Western Wyoming was the warm spot this month, with departures in excess of 4.0 degrees F (2.2 degrees C) above normal. These warmer conditions caused many locations to be ranked in the top 10 warmest Junes on record, including Alamosa, Colorado (2nd), Lander, Wyoming (7th), Wichita, Kansas (9th), and Cheyenne, Wyoming (10th). Much of the warmth experienced this month was not due to extreme maximum temperatures, but rather very warm minimum temperatures. This is illustrated well by Cheyenne, Wyoming where not a single minimum temperature went below normal this month. Cheyenne's minimum temperatures for the month of June ranked as the second warmest on record (period of record 1872-2015). An interesting impact to temperatures occurred at the end of the month when smoke from fires in Alaska and Canada made its way down through the Plains, extending as far south as northern Oklahoma. The smoke created hazy conditions which reduced incoming solar radiation (important for plant development), suppressed temperatures, and allowed for beautiful sunsets and moonrises. For some areas, the smoke also impacted air quality, making it unhealthful for sensitive groups to be outside.
- For many parts of the High Plains region, heavy rain continued to fall this month. Areas receiving greater than 200 percent of normal precipitation included parts of southeastern Nebraska, the Black Hills of South Dakota, the Four Corners region, and parts of the Front Range in Colorado. The only widespread dryness occurred in Kansas where much of the state had precipitation totals that were less than 75 percent of normal. Many interesting precipitation records have occurred over the past two months. For instance, after having its wettest month ever in May, Colorado Springs, Colorado had its 4th wettest June with 5.72 inches (145 mm). This precipitation pushed Colorado Springs' two month total to 13.85 inches (352 mm), marking the wettest May/June on record (period of record 1894-2015). Additionally, this has been the wettest first half of any year on record in Colorado Springs with 17.95 inches (456 mm). Southeast Nebraska continued to receive heavy rainfall this month as well, with many locations topping 10 inches (254 mm). Crete, Nebraska, located to the southwest of Lincoln, had an impressive June total of 12.22 inches (310 mm), which ranked 4th wettest in its 122 year record. Like Colorado Springs, Crete also had its wettest May/June with 25.68 inches (652 mm). For perspective, the annual normal precipitation for Crete is 29.46 inches (748 mm). Western South Dakota was also a wet area, with stations in and around the Black Hills ranking in the top 10 wettest Junes on record. With 7.12 inches (181 mm), Rapid City, South Dakota had its wettest June on record (period of record 1942-2015). The old record of 7.00 inches (178 mm) occurred back in 1968. The bulk of the precipitation occurred during the first half of the month, which, in addition to flooding, created issues for producers. Some low lying fields were inundated or muddy, making it difficult or impossible to work in those fields. Additionally, rains have proved to be a challenge for the application of agricultural chemicals as applications have either been delayed or even lost due to the rainy conditions. Winter wheat continued to be impacted, especially across Kansas, Nebraska, and South Dakota where diseases such as stripe rust, leaf rust, and head scab have been reported. Additionally, a rare wheat disease called flag smut has been found in some fields in central and western Kansas. This is the first time in 80 years that the disease has occurred in Kansas. According to the Kansas Department of Agriculture, infestation levels are low and the disease is controllable.
- After a record setting May, heavy rains continued into June, alleviating much of the remaining drought conditions in the High Plains region. Over the past month, the total area in drought (D1-D4) decreased from around 7 percent to a little over 1 percent. The last time the High Plains region had this little drought coverage was back in the summer of 2010 when, for several weeks, the region had an areal drought coverage of only 1-2 percent. Over the past month, all drought was eliminated in Colorado and abnormally dry conditions (D0) were all that remained at the end of June. Additionally, drought conditions improved or were eliminated in eastern South Dakota, northeastern Nebraska, and southwestern Kansas. Only a few areas of moderate drought conditions (D1) remained at the end of the month, including a small area of northwestern Kansas, a sliver of southwestern Wyoming, and spotty areas extending from northeastern Nebraska into southeastern South Dakota. D0 decreased over the past month and is now confined to western portions of Wyoming and Colorado, in addition to some areas of western Kansas, northeastern Nebraska, southeastern South Dakota, and western North Dakota. The latest outlooks indicate that all drought conditions in the region should be eliminated over the summer or early fall, with the exception of extreme southwestern Wyoming. The small area of D1 is expected to persist through September, however further expansion into Wyoming is not anticipated.
- For more information, please go to the High Plains Regional Climate Center Home Page.
- Southern Region: (Information provided by the Southern Regional Climate Center)
- With the exception of south western Texas, the Southern Region experienced a warmer than normal month, with most stations averaging between 2-4 degrees F (1.11-2.22 degrees C) above normal. In southern Texas, temperature anomalies were near normal to slightly below normal, with some stations ranging between 2-4 degrees F (1.11-2.22 degrees C) below expected values. The state-wide average temperatures for the month are as follows: Arkansas averaged 78.10 degrees F (25.61 degrees C), Louisiana averaged 80.60 degrees F (27.00 degrees C), Mississippi averaged 79.10 degrees F (26.17 degrees C), Oklahoma averaged 78.60 degrees F (25.89 degrees C), Tennessee averaged 76.00 degrees F (24.44 degrees C), and Texas averaged 79.30 degrees F (26.28 degrees C). For Tennessee it was the sixteenth warmest June on record, while Arkansas experienced its twenty-third warmest June on record. Oklahoma reported its twenty-eighth warmest June on record. All other state rankings fell within the two middle quartiles. All records are based on data for the period 1895-2015.
- June precipitation in the Southern Region was quite variable, with several pockets of above normal precipitation and several pockets of below normal precipitation. Areas of above normal precipitation included: south central Oklahoma, Northern Arkansas, southern Texas, and the Texas Gulf Coast region. The remainder of the Southern Region mostly averaged between 70 and 90 percent of normal. The state-wide average precipitation totals for the month are as follows with: Arkansas reporting 3.90 inches (99.06 mm), Louisiana reporting 5.21 inches (132.33 mm), Mississippi reporting 4.13 inches (104.90 mm), Oklahoma reporting 4.79 inches (121.67 mm), Tennessee reporting 4.66 inches (118.36 mm), and Texas reporting 3.78 inches (96.01 mm). Although it was a wetter than normal month for all states except for Arkansas, all state rankings fell within the two middle quartiles.
- Heavy May rainfall values have all but eliminated all drought in the Southern Region. Near normal June precipitation has allowed for a continuation of May drought conditions. As of the June 30, 2015 map from the National Drought Mitigation Center, only approximately 0.92 percent of the region is in moderate drought. Most of this drought is concentrated in the easternmost counties of Tennessee.
- Due to June being drier than normal, severe weather was not much of an issue throughout the month. There were several wind reports in Arkansas and Tennessee on June 26, but most of the damage that was reported is limited to downed trees and power lines. There were only about a dozen tornadoes in the Southern Region in June, and fortunately no reported fatalities or injuries.
- In Texas, farmers are having a tough time with the recent rainfall as it is delaying their harvesting of hay. Farmers need about 4 weeks of dry weather in order for them to harvest, which seems a bit too much to ask for with the current wet pattern. The wet weather is also bringing an abundance of stripe rust, which is causing issues for wheat crops in the Southern Plains. Ecologically, conditions for cattle and other livestock have never been better since the abundance of rainfall provided plenty of water and tall, healthy grass. The highlight of the month was Tropical Storm Bill, which brought over 13 inches (333.20 mm) of rain near Ganado and El Campo. Bill brought rain to a large portion of the state including from Houston all the way up the Dallas-Fort Worth area. Even though the state has seen a lot of rain, wildfires are still possible problems. A lightning strike early in the month caused a grassfire in Jeff Davis County; 15 acres (.06 sq km) of land were burned before the fire was put out. (Information provided by the Texas Office of State Climatology).
- For more information, please go to the Southern Regional Climate Center Home Page.
- Western Region: (Information provided by the Western Region Climate Center)
- June was warmer than normal throughout the West, especially along the northern tier of the region where many locations set both daily and monthly high temperature records. Above normal precipitation fell in the Southwest due to tropical storm remnants during the first half of the month and monsoon onset in the latter half.
- During the first half of June, remnants of Hurricanes Andres and Blanca streamed moisture into the Southwest and Great Basin. Scattered areas of California coast that typically receive very little June rainfall observed monthly totals significantly above normal. Santa Barbara observed 0.3 in (8 mm) for the month, all on the 9th, for 428% of normal, the 6th wettest June in a 75-year record. In the western Great Basin, Hawthorne, Nevada recorded 1.22 in (31 mm) for the month, most of it (0.9 in/23 mm) on June 5. This was 469% of normal and the 5th wettest June in Hawthorne's 62-year record. In Arizona, Flagstaff observed 1.7 in (43 mm) for June, 1.0 in (25 mm) of which fell on June 5, the 5th wettest June in Flagstaff since records began in 1893. The same tropical storm remnants brought 1.15 in (29 mm) for the month, to Moab Utah, 280% of normal. Of this, 0.91 in (23 mm) was recorded on the 6th. The Southwest monsoon circulation reached Tucson, Arizona during late June, a week earlier than usual. Locations (Yuma, Phoenix, Tucson, Flagstaff) favored by the monsoon observed above normal precipitation during the second half of the month. Albuquerque, New Mexico saw roughly 50% of its normal late June precipitation and Las Vegas, Nevada received no measurable precipitation following the monsoon onset. Rains this month helped to ameliorate drought conditions in the Four Corners region and parts of the northern Great Basin.
- Drier than normal conditions dominated the northern states. Seattle, Washington reported 0.23 in (6 mm) this month, 15% of normal the 4th driest June since records began in 1945. In central Washington, Yakima received only 0.01 in (0.4 mm), far below the normal of 0.62 in (16 mm) and tied for second driest June since records began in 1946. In eastern Oregon, Burns received no measurable June precipitation for the first time since modern records began in 1973. The dryness exacerbated drought conditions in Northwest, favoring expansion and intensification of drought classifications over a large area of western Montana and northern Idaho as well as coastal Washington and Oregon.
- A strong ridge of high pressure during the latter half of the month produced extreme high temperatures across the Northwest and northern Great Basin. The monthly average temperatures described for the following locations all set warmth records at the respective locations for June. Seattle, Washington reported 67.7 F (19.8 C, +6.8 F/+3.8 C departure) and Yakima 74.9 F (23.8 C, +11 F/+6.1 C departure). Records for Seattle began in 1945 and at Yakima in 1946. Boise, Idaho recorded 75.9 F (24.3 C) for the month, +8.4 F (+4.7 C) above normal, with records spanning 76 years. Missoula, Montana, averaged 67.9 F (19.9 C) in June, a +7 F (+3.9 C) departure; records there began in 1948. Portland, Oregon, had an average temperature of 70.3 F (21.3 C), +6.7 F (+3.7 C) departure, and highest in a 78-year record. Reno, Nevada, reported 74.1 F (23.4 C), +6.4 F (+3.6 C) departure, where records began in 1937. Many locations also observed record daily temperatures during the late month heat wave. On June 28, Walla Walla, Washington, hit 113 F (45 C) breaking the previous June statewide record temperature of 112 F (44.4 C) set in 1961. On the same day, the temperature reached 110 F (43.3 C) in Boise. This was the warmest June temperature ever and just shy of their all-time daily maximum temperature record of 111 F (43.9 C) observed in July 1960.
- Temperatures were near normal in Interior Alaska with some stations along the North Slope and southern coast observing above normal temperatures. Homer, on the Kenai Peninsula, observed its warmest June in an 84-year record averaging 57.8 F (14.3 C) for the month. Precipitation varied across the state, though large areas in the central region are experiencing abnormally dry conditions and in some areas, signs of moderate drought are apparent. Hawaii saw areas of expanding drought conditions on the four major islands this month as well. Precipitation was near to well below normal throughout the state.
- June 5: Tornado in Hawthorne, Nevada: An EF-1 tornado touched down June 5 in Hawthorne, western Nevada, damaging 10-15 homes and businesses and causing power outages. Tornadoes are rare in Nevada.
- June 6: Flooding and tornados in Utah: Minor flooding was reported in the Salt Lake City area of northern and more severe flash flooding was observed in southern Utah in association with thunderstorms and locally heavy precipitation. Two weak tornadoes touched down west of Salt Lake City in the afternoon. No damage was reported.
- June (all month): Wildfires in California: Lightning ignited the Washington Fire near Markleeville on June 19. It grew to nearly 18,000 acres (7,300 hectares) by the month's end. No structures were damaged, but smoke from the fire reduced air quality in western Nevada. The Lake Fire near Big Bear Lake has charred 31,000 acres (12,500 hectares) since it began on June 17 and has closed or reduced air quality in several popular recreation spots in the area. The cause of the Lake Fire is under investigation.
- June (all month): Wildfires in Alaska: Warm and dry conditions in May and again in the latter half of June favored the development of large wildfires in Alaska. Over 400 fires charred 1.8 million acres (728,000 hectares) this month, breaking the previous record of 1.1 million acres (445,000 hectares) burned by 216 fires.
- For more information, please go to the Western Regional Climate Center Home Page.