Note: This Synoptic Discussion describes recent weather events and climate anomalies in relation to the phenomena that cause the weather. These phenomena include the jet stream, fronts and low pressure systems that bring precipitation, high pressure systems that bring dry weather, and the mechanisms which control these features — such as El Niño, La Niña, and other oceanic and atmospheric drivers (PNA, NAO, AO, and others). The report may contain more technical language than other components of the State of the Climate series.
Summary
The Earth's ocean-atmosphere system was technically in an ENSO-neutral state during July 2017. Like last month, an upper-level ridge dominated the western half of the contiguous United States (CONUS) with attendant warmer- and drier-than-normal weather, which set the stage for an active wildfire season. An upper-level trough set up over the eastern CONUS and its associated short-wave troughs, fronts and low pressure systems brought cooler- and wetter-than-normal weather. Monsoon rain in the Southwest contracted drought and abnormal dryness, but persistent dry conditions in the Far West, northern Rockies, and, especially, northern Plains expanded and intensified drought. Without ENSO-related inhibitors shearing tropical systems, the Atlantic and East Pacific basins saw slightly more active tropical cyclone activity than average. The upper-level circulation, temperature, and precipitation anomaly patterns suggested that the atmospheric drivers originating in the Arctic and North Atlantic had the greatest influence on the month's weather. See below for details.
Synoptic Discussion
 Animation of daily upper-level circulation for the month.
|
 Animation of daily surface fronts and pressure systems for the month.
|
In the Northern Hemisphere, July marks the middle of climatological summer which is the time of year when solar heating is at maximum with the high sun angle, arctic air masses are weakest, and the circumpolar vortex and jet stream have retreated far northward. Polar air masses influence the weather over the contiguous U.S. (CONUS) less, and the warm, dry subtropical high pressure belts dominate the weather.
During July 2017, the North Pacific High and an upper-level ridge with above-normal 500-mb height anomalies controlled the weather in the West. Upper-level troughs settled over the eastern CONUS most of the month, resulting in a mean long-wave trough, but at the surface the North Atlantic High extended into the southeastern CONUS.
- Cold fronts and surface low pressure systems moving in the jet stream flow rode over the top of the western ridge and, as they crossed the Rockies, were funneled into the eastern and southern CONUS by the long-wave trough where they tapped moisture from the Gulf of Mexico and Atlantic Ocean. The frontal lifting and convergence around the surface lows wrung out the moisture to produce areas of above-normal precipitation. The ridge kept much of the West and Great Plains drier than normal. But Pacific moisture made its way underneath the ridge to fuel a Southwest monsoon which resulted in a large area of above-normal precipitation across the Four Corners States. On a statewide basis, the circulation and precipitation pattern this month left Montana with the second driest July in the 1895-2017 record, Washington with the fifth driest, and North Dakota eleventh driest. On the other end of the scale, the rain in the Southwest and Midwest to East ranked six states in the top ten wettest category for July — Maryland (fifth wettest), Delaware (sixth wettest), Colorado (eighth wettest), Pennsylvania (ninth wettest), and Indiana and Ohio (tenth wettest). The overall circulation and precipitation anomaly pattern gave the CONUS the 55th driest July on record.
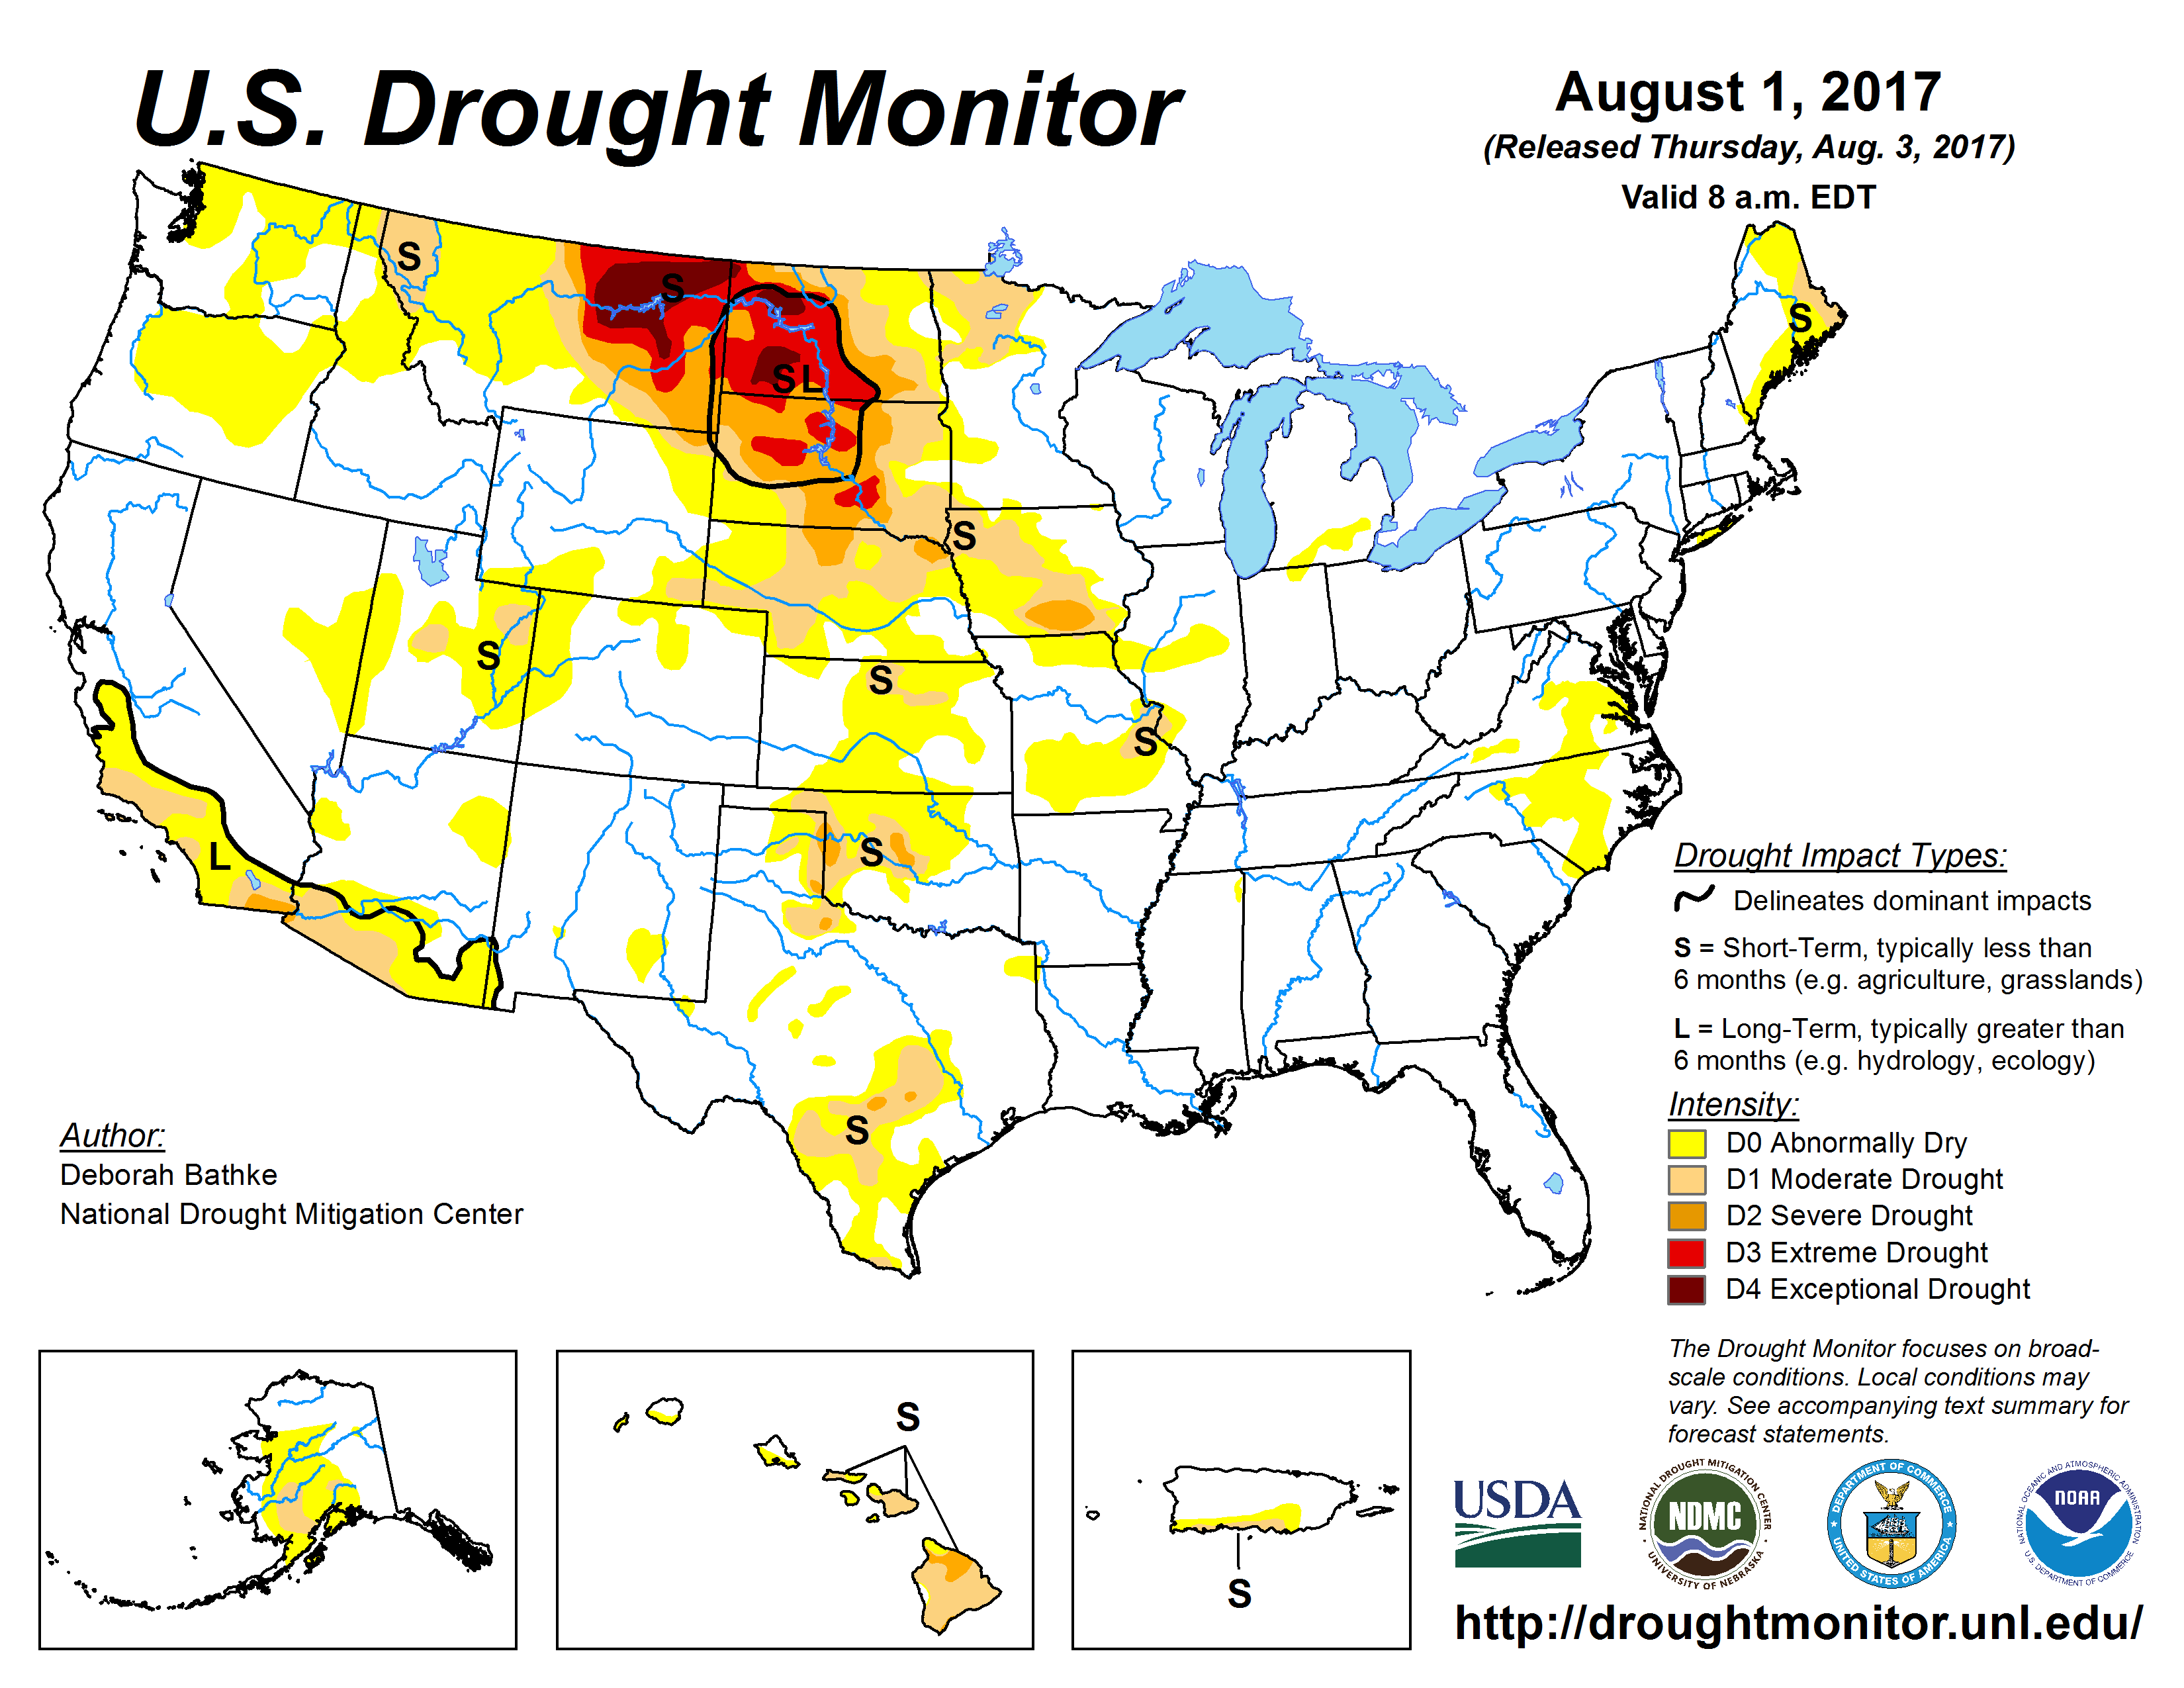
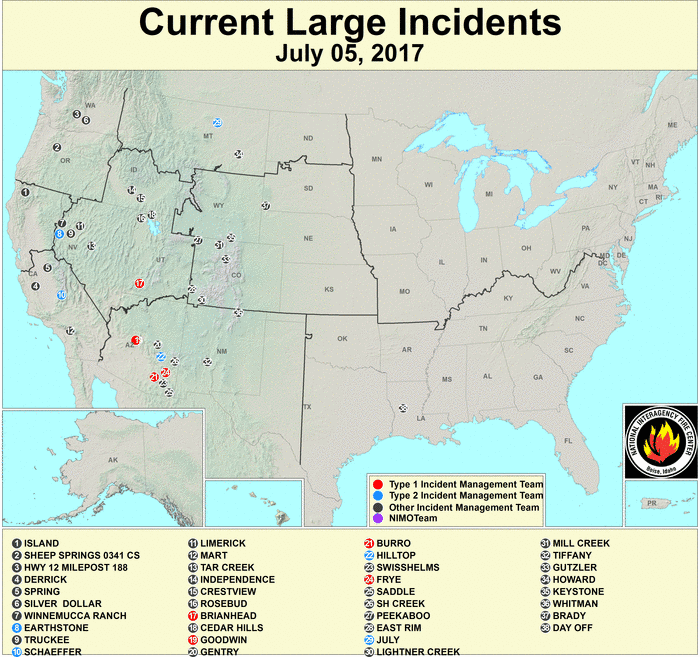
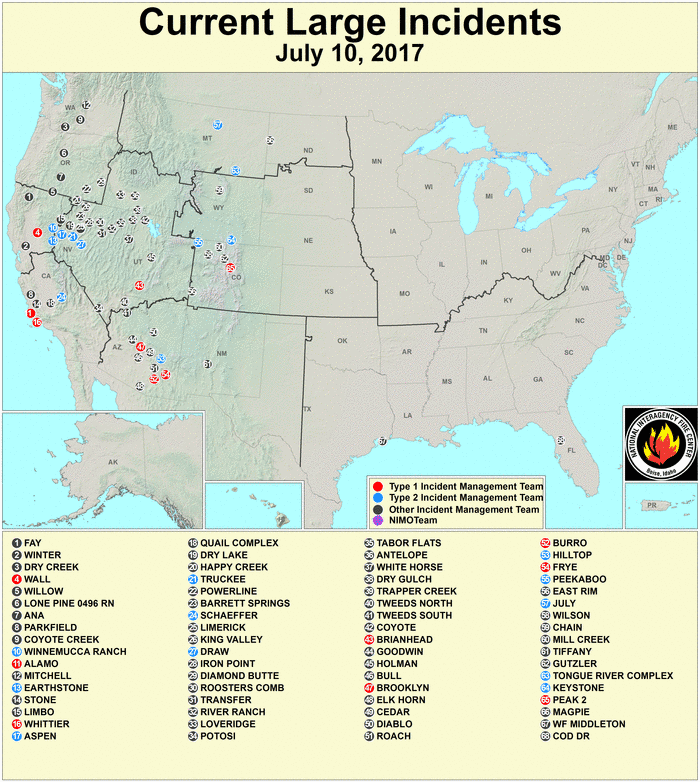
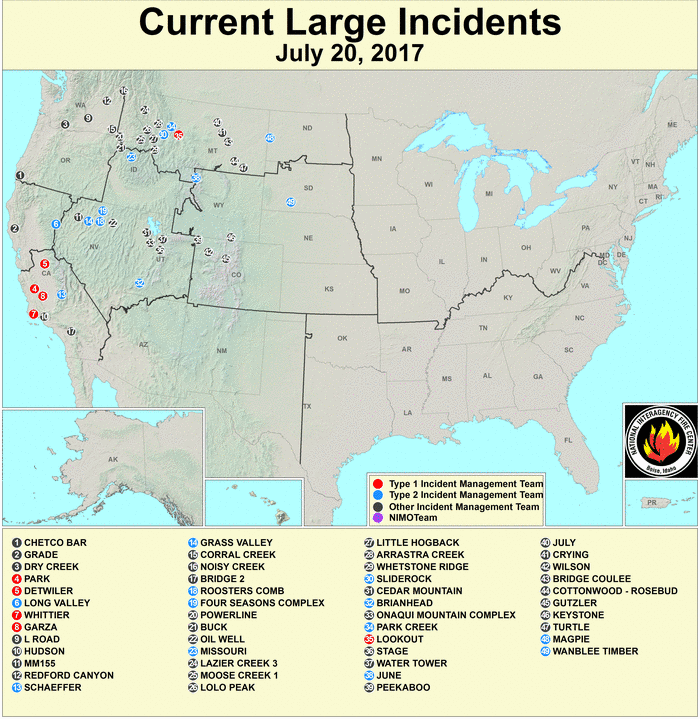
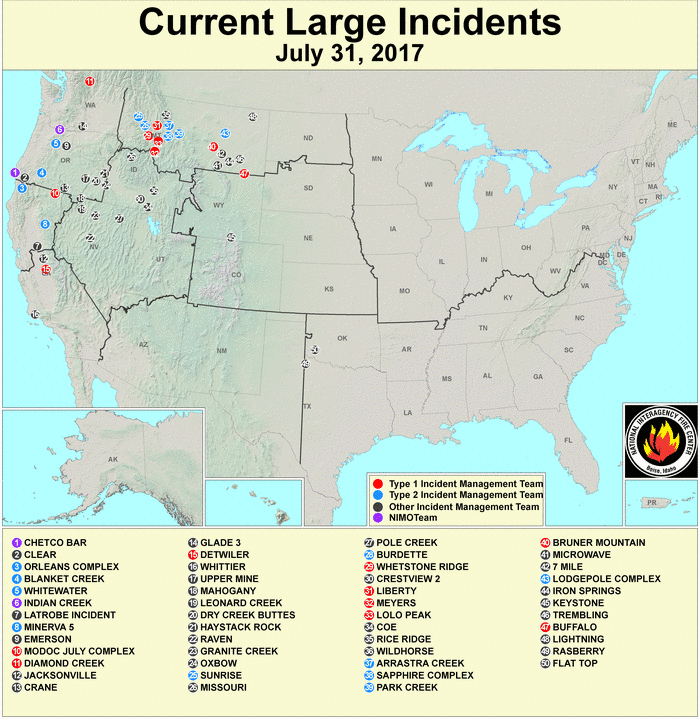
- The above-normal precipitation helped shrink drought and abnormally dry areas in the Southwest and parts of the southern Plains. But the dry weather in the Northwest to northern Plains, and parts of the central to southern Plains and Midwest, during July was just a continuation of dryness that has lasted for much of the last three months. In the northern Plains, the dryness extends back four to ten months, and for some areas, even 24 months. North Dakota, for example, had the fourth driest May-July and third driest January-July in the 1895-2017 record, and even the 31st driest August-July. Montana had the third driest May-July. Drought and abnormal dryness expanded across this area — from the Pacific Northwest to northern Plains, across the central Plains to Midwest, and in parts of the southern Plains. Drier-than-normal conditions for the month in Alaska, Hawaii, and Puerto Rico resulted in expansion of drought and abnormal dryness there as well. As a result, the national moderate-to-exceptional drought footprint increased from 8.0 percent at the end of June to 11.8 percent at the end of July (from 7.8 percent to 11.0 percent for all of the U.S.). The heat and dry weather set the stage for continuation of several large wildfires in the West and into the High Plains (wildfire maps for July 5, 10, 20, 31).
- Without ENSO-related inhibitors shearing tropical systems, the Atlantic and East Pacific basins saw slightly more active tropical cyclone activity than average. The Atlantic hurricane season runs from June 1st through November 30th and three tropical systems developed in the North Atlantic during July, which is a little above average. Two were tropical storms (Don and Emily) while one was a tropical depression which didn't develop further. Tropical Storm Emily soaked Florida at the end of the month. The Eastern North Pacific hurricane season runs from May 15th through November 30th, and five named storms and three minor disturbances developed during July — Tropical Storm Greg and Hurricanes Eugene, Fernanda, Hilary, and Irwin. With the upper-level ridge, and a strong North Pacific High, blocking their path, all developed off the coast of Mexico and tracked westward away from the CONUS, or dissipated before they could approach the CONUS. Several tropical disturbances developed in or near the western tropical Pacific near the U.S.-Affiliated Pacific Islands (USAPI) in Micronesia. None of them developed within USAPI waters, but several developed west or north of the USAPI, including Typhoons Noru and Nesat, and Tropical Storms Sonca, Kulap, and Roke.
With the upper-level ridge dominating the weather in the West, July temperatures averaged warmer than normal across the West and much of the Great Plains. Seven states in the West, plus Florida, ranked in the top ten warmest category for July. The trough in the East funneled cold fronts into the East. The cooler air masses moderated monthly temperatures, but July still averaged warmer than normal for most Southeast states and some further north, thanks in part to the North Atlantic (Bermuda) High. When averaged across the CONUS, July 2017 ranked tenth warmest for July.
- Warm temperature records beneath the ridge dominated cold temperature records associated with the fronts. When integrated across the month, there were 2,495 record warm daily high (814) and low (1,681) temperature records. This was more than three times the 763 record cold daily high (516) and low (247) temperature records.
- The REDTI (Residential Energy Demand Temperature Index) for July 2017 ranked as 16th highest in the 123-year historical record for July. The excessive warmth in the West and along the southern and eastern coasts contributed to the high rank, but near-normal temperatures in the high population centers of the Midwest tempered the REDTI rank.
 North America monthly upper-level circulation pattern and anomalies. The upper-level circulation pattern, averaged for the month, consisted of above-normal height anomalies associated with a ridge over the West. The core of the ridge occasionally vacillated between the West and Plains. A downstream trough developed across the eastern CONUS. |
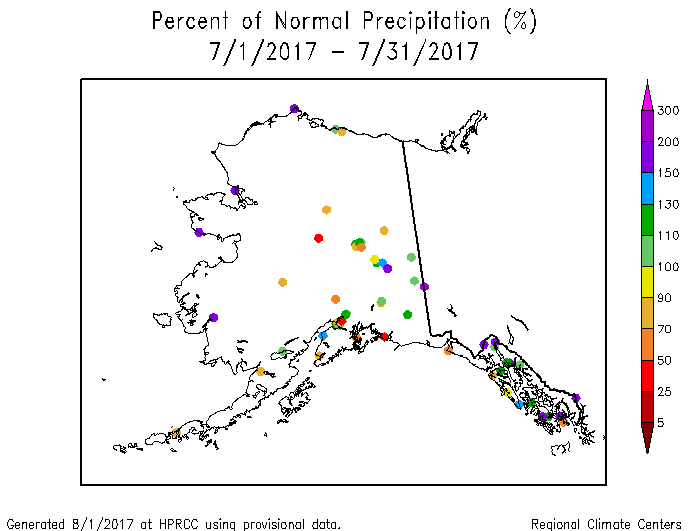
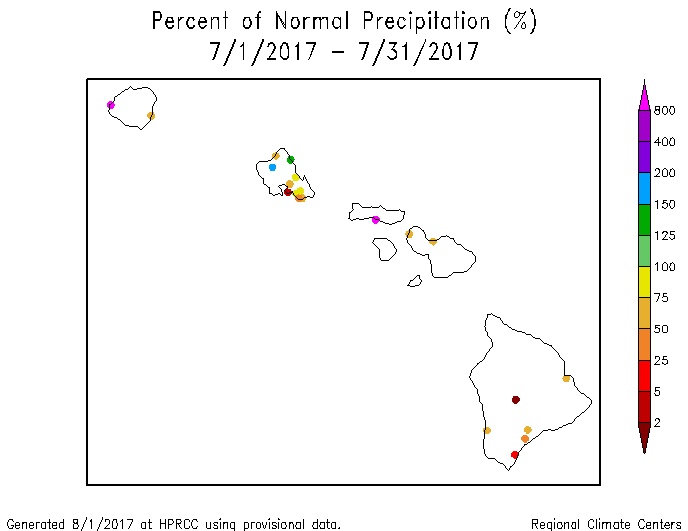
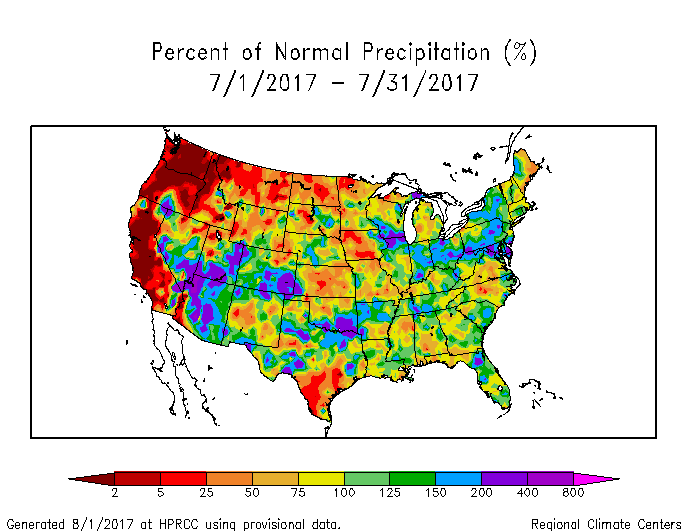 Map of monthly precipitation anomalies. Monsoon showers gave much of the Southwest above-normal precipitation while frontal thunderstorms left parts of the southern Plains, Midwest, Southeast, and Northeast with above-normal precipitation. July was drier than normal across the rest of the West beneath an upper-level ridge, across much of the Plains, and parts of the Southeast and New England. Hawaii was mostly drier than normal. Alaska had a mixed precipitation anomaly pattern, with drier-than-normal conditions across the south and into the interior, and wetter-than-normal conditions along the west coast and parts of the southeast. |
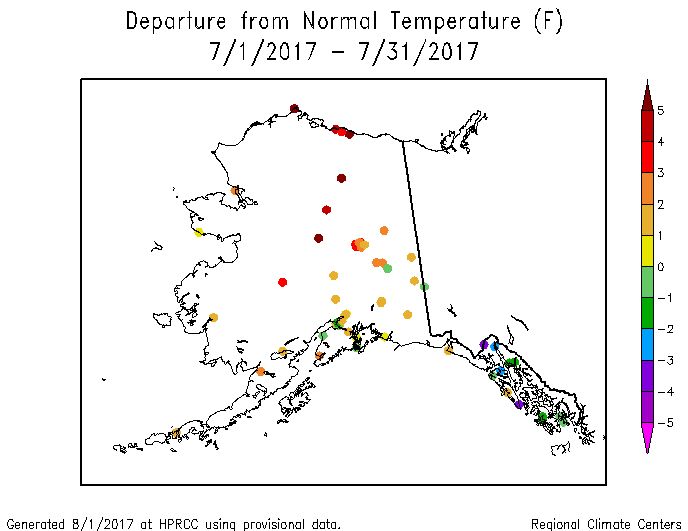
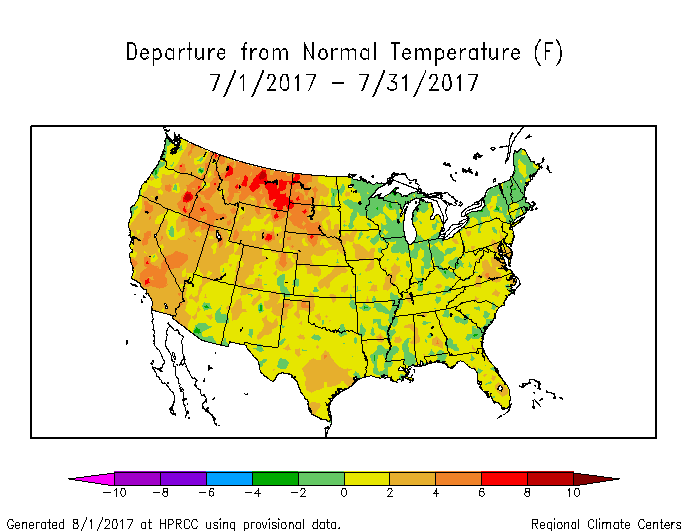 Map of monthly temperature anomalies. The upper-level ridge brought above-normal temperatures to the West and much of the Plains, while the month was near- to cooler-than-normal along and east of the Mississippi Valley and in parts of the Southwest. July was warmer than normal in Alaska, except in the panhandle. |
Atmospheric Drivers
Subtropical highs, and fronts and low pressure systems moving in the mid-latitude storm track flow, are influenced by the broadscale atmospheric circulation. The circulation of the atmosphere can be analyzed and categorized into specific patterns. The Tropics, especially the equatorial Pacific Ocean, provides abundant heat energy which largely drives the world's atmospheric and oceanic circulation. The following describes several of these modes or patterns of the atmospheric circulation, their drivers, the temperature and precipitation patterns (or teleconnections) associated with them, and their index values this month:
-
El Niño Southern Oscillation (ENSO)
- Description: Oceanic and atmospheric conditions in the tropical Pacific Ocean can influence weather across the globe. ENSO is characterized by two extreme modes: El Niño (warmer-than-normal sea surface temperature [SST] anomalies in the tropical Pacific) and La Niña (cooler-than-normal SST anomalies), with the absence of either of these modes termed "ENSO-neutral" conditions.
- Status: ENSO-neutral conditions were present during July 2017 with near-average SSTs across most of the equatorial Pacific Ocean.
- Teleconnections (influence on weather): The NWS CPC has no teleconnections for ENSO-neutral conditions.
- Comparison to Observed: The July 2017 temperature and precipitation anomaly patterns do not match the teleconnection patterns for either a La Niña or El Niño.
-
Madden-Julian Oscillation (MJO)
- Description: The MJO is a tropical disturbance or "wave" that propagates eastward around the global tropics with a cycle on the order of 30-60 days. It is characterized by regions of enhanced and suppressed tropical rainfall. One of its indices is a phase diagram which illustrates the phase (1-8) and amplitude of the MJO on a daily basis. The MJO is categorized into eight "phases" depending on the pattern of the location and intensity of the regions of enhanced and suppressed tropical rainfall. The MJO can enter periods of little or no activity, when it becomes neutral or incoherent and has little influence on the weather. Overall, the MJO tends to be most active during ENSO-neutral years, and is often absent during moderate-to-strong El Niño and La Niña episodes.
- Status: The MJO Wheeler-Hendon index spent the entire month within or on the edge of the unit circle, reflecting a mostly incoherent status. Other aspects of the tropical ocean-atmosphere system (referred to in the CPC reports as the background or low frequency state, Kelvin and Rossby waves) appeared to play a role in influencing the month's climate (especially Kelvin waves) (MJO updates for July 3, 10, 17, 24, and 31).
- Teleconnections (influence on weather): The MJO's temperature and precipitation teleconnections to U.S. weather depend on time of year and MJO phase. But there are no teleconnections for an incoherent MJO.
- Comparison to Observed: The MJO is transitory and can change phases (modes) within a month, so it is usually more closely related to weekly weather patterns than monthly. In the case of July 2017, the monthly temperature and precipitation anomaly patterns do not match the teleconnection patterns for any of the MJO phases.
- The Pacific/North American (PNA) pattern
- Description: The PNA teleconnection pattern is associated with strong fluctuations in the strength and location of the East Asian jet stream. PNA-related blocking of the jet stream flow in the Pacific can affect weather downstream over North America, especially the West and especially in the winter half of the year.
- Status: The daily PNA index began the month strongly positive then turned negative during the last half of the month, averaging positive for the month as a whole. The 3-month-averaged index was also positive.
- Teleconnections (influence on weather): To the extent teleconnections are known, a positive PNA for this time of year (July on the quarterly teleconnection maps) is associated with above-normal precipitation from Montana to Texas; below-normal precipitation across the Great Lakes; below-normal upper-level circulation anomalies over southeastern Canada and the northern North Pacific; and above-normal upper-level circulation anomalies across the central North Pacific, but all of the teleconnections are weak. The temperature teleconnections are weak to non-existent across North America.
- Comparison to Observed: The July 2017 precipitation and upper-level circulation anomaly patterns do not agree with the teleconnections.
- The Arctic Oscillation (AO) pattern
- Description: The AO teleconnection pattern relates upper-level circulation over the Arctic to circulation features over the Northern Hemisphere mid-latitudes and is most active during the cold season.
- Status: The daily AO index was positive throughout the month and averaged positive for the month. The 3-month-averaged index was slightly positive.
- Teleconnections (influence on weather): To the extent teleconnections are known, a positive AO in July (June-August in the AO Composites table) is typically associated with dry conditions across the Great Plains and Midwest to Northeast; wet conditions in parts of the Southwest and Southeast; above-normal temperatures in the northern Plains; near-normal temperatures elsewhere across the CONUS; below-normal upper-level circulation anomalies over the Arctic Ocean extending into the North Atlantic; and above-normal upper-level circulation anomalies spanning both the North Pacific and central North America to the North Atlantic.
- Comparison to Observed: The July 2017 monthly upper-level circulation anomaly pattern agrees with the general pattern of below-normal heights over the polar latitudes and above-normal heights over the North Pacific and Atlantic Oceans, but there are some deviations. The precipitation anomaly pattern has some agreement in the Southwest and Southeast. The temperature anomaly pattern agrees over the northern Plains and generally in the East and South, but not over the West.
- The North Atlantic Oscillation (NAO) pattern
- Description: The NAO teleconnection pattern relates upper-level circulation over the North Atlantic Ocean to circulation features over the Northern Hemisphere mid-latitudes.
- Status: The daily NAO index was positive for most of the month then turned negative near the end of the month, averaging positive for the month. The 3-month-averaged index was slightly negative.
- Teleconnections (influence on weather): To the extent teleconnections are known, a positive NAO during this time of year (July on the quarterly teleconnection maps) is associated with above-normal upper-level circulation anomalies over the western CONUS and southern Canada, centered over Montana, and over the North Atlantic; below-normal circulation anomalies over northern Canada to Greenland and Iceland, and in the northeast North Pacific; above-normal temperature anomalies across the Pacific Northwest to northern Plains and adjacent southern Canada; below-normal temperatures over the southern Plains to Southeast; and drier-than-normal precipitation anomalies in the northern Plains and Iowa-Missouri; and wetter than normal in parts of the South (although few precipitation teleconnections exist).
- Comparison to Observed: The July 2017 upper-level circulation anomaly pattern is a very good match to the teleconnections; the temperature anomaly pattern mostly agrees, especially in the Northwest to northern Plains; and the precipitation anomaly pattern agrees where the few teleconnections exist).
- The West Pacific (WP) pattern
- Description: The WP teleconnection pattern is a primary mode of low-frequency variability over the North Pacific and reflects zonal and meridional variations in the location and intensity of the (East Asian) jet stream in the western Pacific.
- Status: The monthly WP index was slightly positive, and the three-month average WP index was near zero.
- Teleconnections (influence on weather): To the extent teleconnections are known, a positive WP during this time of year (July on the quarterly teleconnection maps) is typically associated with below-normal temperatures in the southwest CONUS and eastern North America; above-normal temperatures over northwestern Canada; below-normal circulation anomalies over the southwestern CONUS, eastern North America, and northeast Asia; and above-normal circulation anomalies over western Canada and the west-central Pacific. There are no discernible precipitation teleconnections over the CONUS.
- Comparison to Observed: The July 2017 monthly upper-level circulation and temperature anomaly patterns mostly disagree with the teleconnections. There are no teleconnections to compare against the precipitation anomaly pattern.
- The East Pacific-North Pacific (EP-NP) pattern
- Description: The EP-NP teleconnection pattern relates SST and upper-level circulation patterns (geopotential height anomalies) over the eastern and northern Pacific to temperature, precipitation, and circulation anomalies downstream over North America. Its influence during the winter is not as strong as during the other three seasons.
- Status: Considerable warming of the North Pacific SSTs occurred in July, resulting in an anomaly pattern that was more uniform than during previous months. The North Atlantic High (Bermuda High) and North Pacific High were evident on the average sea level pressure (SLP) field map. The SLP anomaly field indicated that the North Atlantic and North Pacific Highs were somewhat stronger than normal, especially near their centers. The July 2017 monthly EP-NP index was zero and the 3-month running mean was near zero.
- Teleconnections (influence on weather): There are no teleconnections for a neutral (zero) EP-NP.
- Comparison to Observed: The July 2017 upper-level circulation, temperature, and precipitation anomaly patterns generally do not agree with the teleconnections for a positive or negative EP-NP.
Examination of the available circulation indices and their teleconnection patterns, and comparison to observed July 2017 temperature, precipitation, and circulation anomaly patterns, suggest that the weather over the CONUS in July was largely influenced by the Arctic and North Atlantic atmospheric drivers associated with the AO and NAO. The MJO was weak to incoherent and the equatorial Pacific was in an ENSO-neutral state, indicating little influence from the equatorial Pacific. The WP and EP-NP were either zero or near zero, and the PNA teleconnections had little agreement with observed anomaly patterns, indicating little influence from the drivers over the North Pacific. Both the AO and NAO were positive and their teleconnections showed similarities to the observed anomaly patterns. The upper-level teleconnection patterns for a positive AO and NAO, taken together, reflect very well the observed upper-level circulation anomaly pattern over the Arctic, North Pacific, North America, and North Atlantic sectors. When the temperature teleconnection patterns for a positive AO and NAO are integrated, they reflect very well the observed temperature anomaly pattern everywhere except the Southwest. Even precipitation, which in the summer largely exhibits a random convective nature, shows some agreement. The observed precipitation anomaly patterns in the Southwest, Southeast, northern Plains, and Iowa to Missouri show similarities to the teleconnections for a positive AO and NAO.
This month illustrates how the weather and climate anomaly patterns can be influenced by atmospheric drivers (or modes of atmospheric variability) originating in the Arctic and North Atlantic.