Note: This Synoptic Discussion describes recent weather events and climate anomalies in relation to the phenomena that cause the weather. These phenomena include the jet stream, fronts and low pressure systems that bring precipitation, high pressure systems that bring dry weather, and the mechanisms which control these features — such as El Niño, La Niña, and other oceanic and atmospheric drivers (PNA, NAO, AO, and others). The report may contain more technical language than other components of the State of the Climate series.
Summary
The Earth's ocean-atmosphere system continued in an ENSO-neutral state during July 2018. Like the last several months, the upper-level circulation was quite active this month with shortwave ridges and troughs migrating through the jet stream flow over the contiguous United States (CONUS). But all of this activity took place within a bigger picture wherein a large broadscale/long-wave ridge dominated the overarching circulation over the CONUS, except this month the ridge shifted to the west during the last half of the month, allowing a trough to set up in the East. The ridge was responsible for widespread anomalous warmth during the first half of the month and for above-normal temperatures in the West during the second half of the month, while the trough kept temperatures cooler than normal east of the Rockies during the second half of the month. The summer monsoon brought above-normal precipitation to parts of the Southwest, fronts and low pressure systems moving in the jet stream flow gave parts of the Plains above-normal precipitation, and a southerly flow on the east side of the trough soaked parts of the East Coast during the last half of the month. These areas ended up wetter than normal for the month as a whole. The rains helped contract drought and abnormal dryness in parts of the Southwest, Plains, and Northeast. But the ridge kept rain out of the Pacific Northwest, northern to central Rockies, and most of Texas, and a northwesterly flow moved mostly dry air masses across the Mid-Mississippi Valley and Ohio Valley to Great Lakes, so these areas remained drier than normal for the month and drought or abnormal dryness developed, expanded, or intensified. It was also drier than normal across much of Hawaii, where drought expanded. Drought expansion outpaced contraction, so the national drought footprint grew when compared to the beginning of July. The active troughs and lows, and their associated fronts, generated severe weather every day, but they were working against the broadscale ridge which generally inhibited severe weather, so the total (preliminary) tornado count was below the long-term average. The upper-level circulation, temperature, and precipitation anomaly patterns suggest that the weather during July reflected the combined influence of atmospheric drivers originating in the Pacific, Atlantic, and Arctic Oceans. See below for details.
Synoptic Discussion
 Animation of daily upper-level circulation for the month.
|
 Animation of daily surface fronts and pressure systems for the month.
|
In the Northern Hemisphere, July marks the middle of climatological summer which is the time of year when solar heating is at maximum with the high sun angle, arctic air masses are weakest, and the circumpolar vortex and jet stream have retreated far northward. Polar air masses influence the weather over the contiguous U.S. (CONUS) less, and the warm, dry subtropical high pressure belts dominate the weather.
During July 2018, a large broadscale (long-wave) ridge dominated the upper-level circulation over the CONUS during the first half of the month. Short-wave troughs and closed lows from the Pacific, moving in the jet stream flow, rode over the top of the ridge along the U.S./Canadian border. The ridge axis shifted to the western CONUS during the second half of July, with the core of the high setting up shop over the Southwest. In response, the sinuous (wavelike) nature of the jet stream protruded a trough over the eastern CONUS. This overall pattern largely controlled the temperatures across the country. More subtle variations in the circulation on a weekly basis influenced the precipitation pattern.
 500-mb mean circulation for the CONUS for July 1-17, 2018, showing a ridge dominating most of the CONUS.
|
 500-mb mean circulation for the CONUS for July 18-31, 2018, showing a trough in the East and ridge in the West.
|
For this report, the July 2018 circulation was broken down into two periods, each characterized by specific weather phenomena, temperature anomalies, precipitation anomalies, and impacts.
 500-mb circulation anomalies for the CONUS for July 1-17, 2018.
|
 Temperature anomalies (departure from normal) for the CONUS for July 1-17, 2018.
|
 Precipitation anomalies (percent of normal) for the CONUS for July 1-17, 2018.
|
With the high pressure ridge dominating the circulation during July 1-17, temperatures were warmer than normal across most of the CONUS. The ridge manifested as a dome of high pressure, acting like a "closed high" at times with a slight easterly circulation component along its southern edge. Weak low pressure troughs tip-toed in this easterly flow, moving westward along the Gulf of Mexico coast during July 1-7, causing showers and cloudiness which resulted in areas of above-normal precipitation and below-normal temperatures in this area. Pacific weather systems moving in the westerly flow at the top of the ridge dragged fronts and surface low pressure centers with them. These left above-normal precipitation in their wake across the northern Plains to Upper Mississippi Valley during both the first and second weeks of the month. The Southwest monsoon kicked in during July 11-17, bringing above-normal precipitation to that region. Its clouds and rain also kept temperatures cooler than normal across much of Arizona and New Mexico during that week. At the other end of the country, Tropical Depression 3 formed off the Carolina coast, to become Tropical Storm Chris during July 7-10. The steering currents were weak between the CONUS ridge and the Bermuda High, so the system slowly meandered along a stationary front off the Carolina coast for a few days before finally being drawn northeast by a trough in the jet stream and briefly intensifying into Hurricane Chris. The remnants of the Caribbean storm, Hurricane Beryl, were drawn north on the heels of Chris. The remains re-intensified into Subtropical Storm Beryl along another stationary front off the East Coast, then Beryl became entrained in a trough moving in the jet stream flow and quickly skirted off further into the North Atlantic. Except for those areas receiving rain from the Southwest monsoon, fronts in the north, and lows along the Gulf Coast, the upper-level ridge kept much of the CONUS drier than normal during July 1-17, especially in the Pacific Northwest and northern Rockies.
 500-mb circulation anomalies for the CONUS for July 18-31, 2018.
|
 Temperature anomalies (departure from normal) for the CONUS for July 18-31, 2018.
|
 Precipitation anomalies (percent of normal) for the CONUS for July 18-31, 2018.
|
Except for monsoon rain over the Southwest, the ridge kept much of the West, as well as the southern Plains, drier than normal as well as warmer than normal during the second half of the month. The shifting of the ridge axis to the West during July 18-31 opened the door for the development of a persistent trough over the East. Short-wave troughs and closed lows rotated into the long-wave trough in their trek eastward and became trapped between the strong ridge in the West and the strong Bermuda High to their east. This circulation pattern set up a northwesterly flow over central North America which funneled cold Canadian air masses into the eastern CONUS, bringing wave after wave of below-normal temperatures to the northern and central Plains and Midwest, and all the way to the East Coast. These cold fronts triggered heavy rains in the Plains, especially during the fourth week. This blocked circulation pattern also established a strong southerly flow across the East Coast which funneled Atlantic moisture into the region. The cold fronts stalled out along the East Coast and low pressure centers developed along the fronts. This combination of lows and stalled fronts provided a persistent lifting mechanism which wrung out the Atlantic moisture, resulting in localized flooding and above-normal precipitation from the Southeast and Ohio Valley to much of the Northeast during the third week of the month, and along the Southeast coast to the Northeast during the last week of the month.
 500-mb mean circulation for the CONUS for July 2018.
|
 500-mb circulation anomalies for the CONUS for July 2018.
|
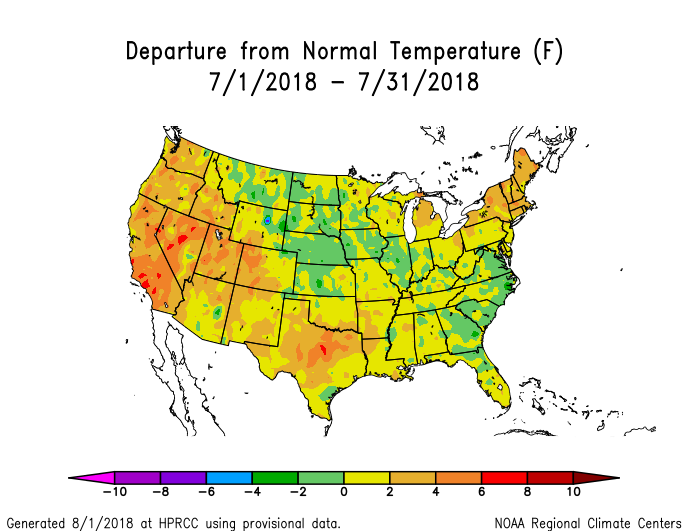 Temperature anomalies (departure from normal) for the CONUS for July 2018.
|
 Precipitation anomalies (percent of normal) for the CONUS for July 2018.
|
The long-wave circulation pattern averaged across the entire month shows the dominance of the ridge over the western to southern CONUS. The preference of troughs to congregate in the East (during the last half of the month) is reflected by a mean trough there. The dominance of the broadscale ridge is reflected in the widespread above-normal height anomalies across most of the CONUS. Even with the strong trough in the East during the last half of the month, the height anomalies averaged for the entire month were only near normal in the Southeast and still above normal further north across the East, testifying to the strength of the persistent overall ridging. Monthly temperatures were warmer than normal in the West, South, and Northeast, but the frequent passage of cold fronts during the last half of the month beneath the eastern trough resulted in near to colder-than-normal monthly temperatures from the northern Plains to Southeast. The precipitation anomaly pattern for the month represented an additive result of the anomaly patterns for the various weeks — the areas that were much wetter than normal during one or more weeks showing up wet at the monthly time scale, and those areas (especially the Pacific Northwest to northern and central Rockies, and central Texas to the Great Lakes) that were persistently dry every week, or which received a brief shot of above-normal precipitation, showing up as dry at the monthly scale. The circulation during this month was also reflected in severe weather, drought, and regional records.
- The extreme warmth was reflected in the statewide temperature ranks. In addition to being the eleventh warmest July on record nationally, July 2018 ranked in the top ten warmest category for 15 states. These included the warmest July in the 124-year record for California and second warmest for Nevada. About 38 percent of the CONUS was very warm (having July temperatures in the warmest tenth percentile of the historical record). Eight of the last nine July's have had consistently more than 20 percent of the country much warmer than normal. Since 1993, only four July's have had less than ten percent of the country much warmer than normal. A little more than a twentieth (6 percent) of the CONUS was very wet (had July precipitation in the wettest tenth percentile of the historical record) and about the same amount (5 percent) was very dry (in the driest tenth of the historical record). The wet and dry conditions balanced each other out, nationally, giving the CONUS a July precipitation rank of 60th driest. On a statewide basis, Pennsylvania had the wettest July in the 1895-2018 record, while Idaho ranked sixth driest.
- When daily temperature records are examined, the extreme warmth overwhelmed the extreme cold. When integrated across the month, there were 5,532 record warm daily high (1,945) and low (3,587) temperature records. This was over five times the 943 record cold daily high (476) and low (467) temperature records.
- As noted earlier, July is in the middle of the Northern Hemisphere climatological summer, the time of year when temperatures reach their peak seasonal warmth. The areally-averaged temperature across the CONUS resulted in the eleventh warmest July, nationally, in the 1895-2018 record (tied with July 1998). The spatial pattern of temperature anomalies included some near- to cooler-than-normal temperatures in the northern Plains to Southeast, but much of the abnormal warmth occurred in the high-population areas of the Northeast, southern Plains, and West Coast. When cooling degree days across the country are weighted by population, the result was a national REDTI (Residential Energy Demand Temperature Index) value for July 2018 that tied with July 1936 as the tenth highest July REDTI in the 124-year record. The July REDTI for much of the last decade has been well above average, reflecting an increase in energy demand for cooling. The persistent warmth of the last three months resulted in the warmest May-July on record. The 3-month REDTI for May-July 2018 ranked as the fifth highest, due in part to the largest temperature anomalies and ranks being concentrated in the Southwest, South, and Midwest, including the warmest May-July on record for Utah, New Mexico, and Arkansas.
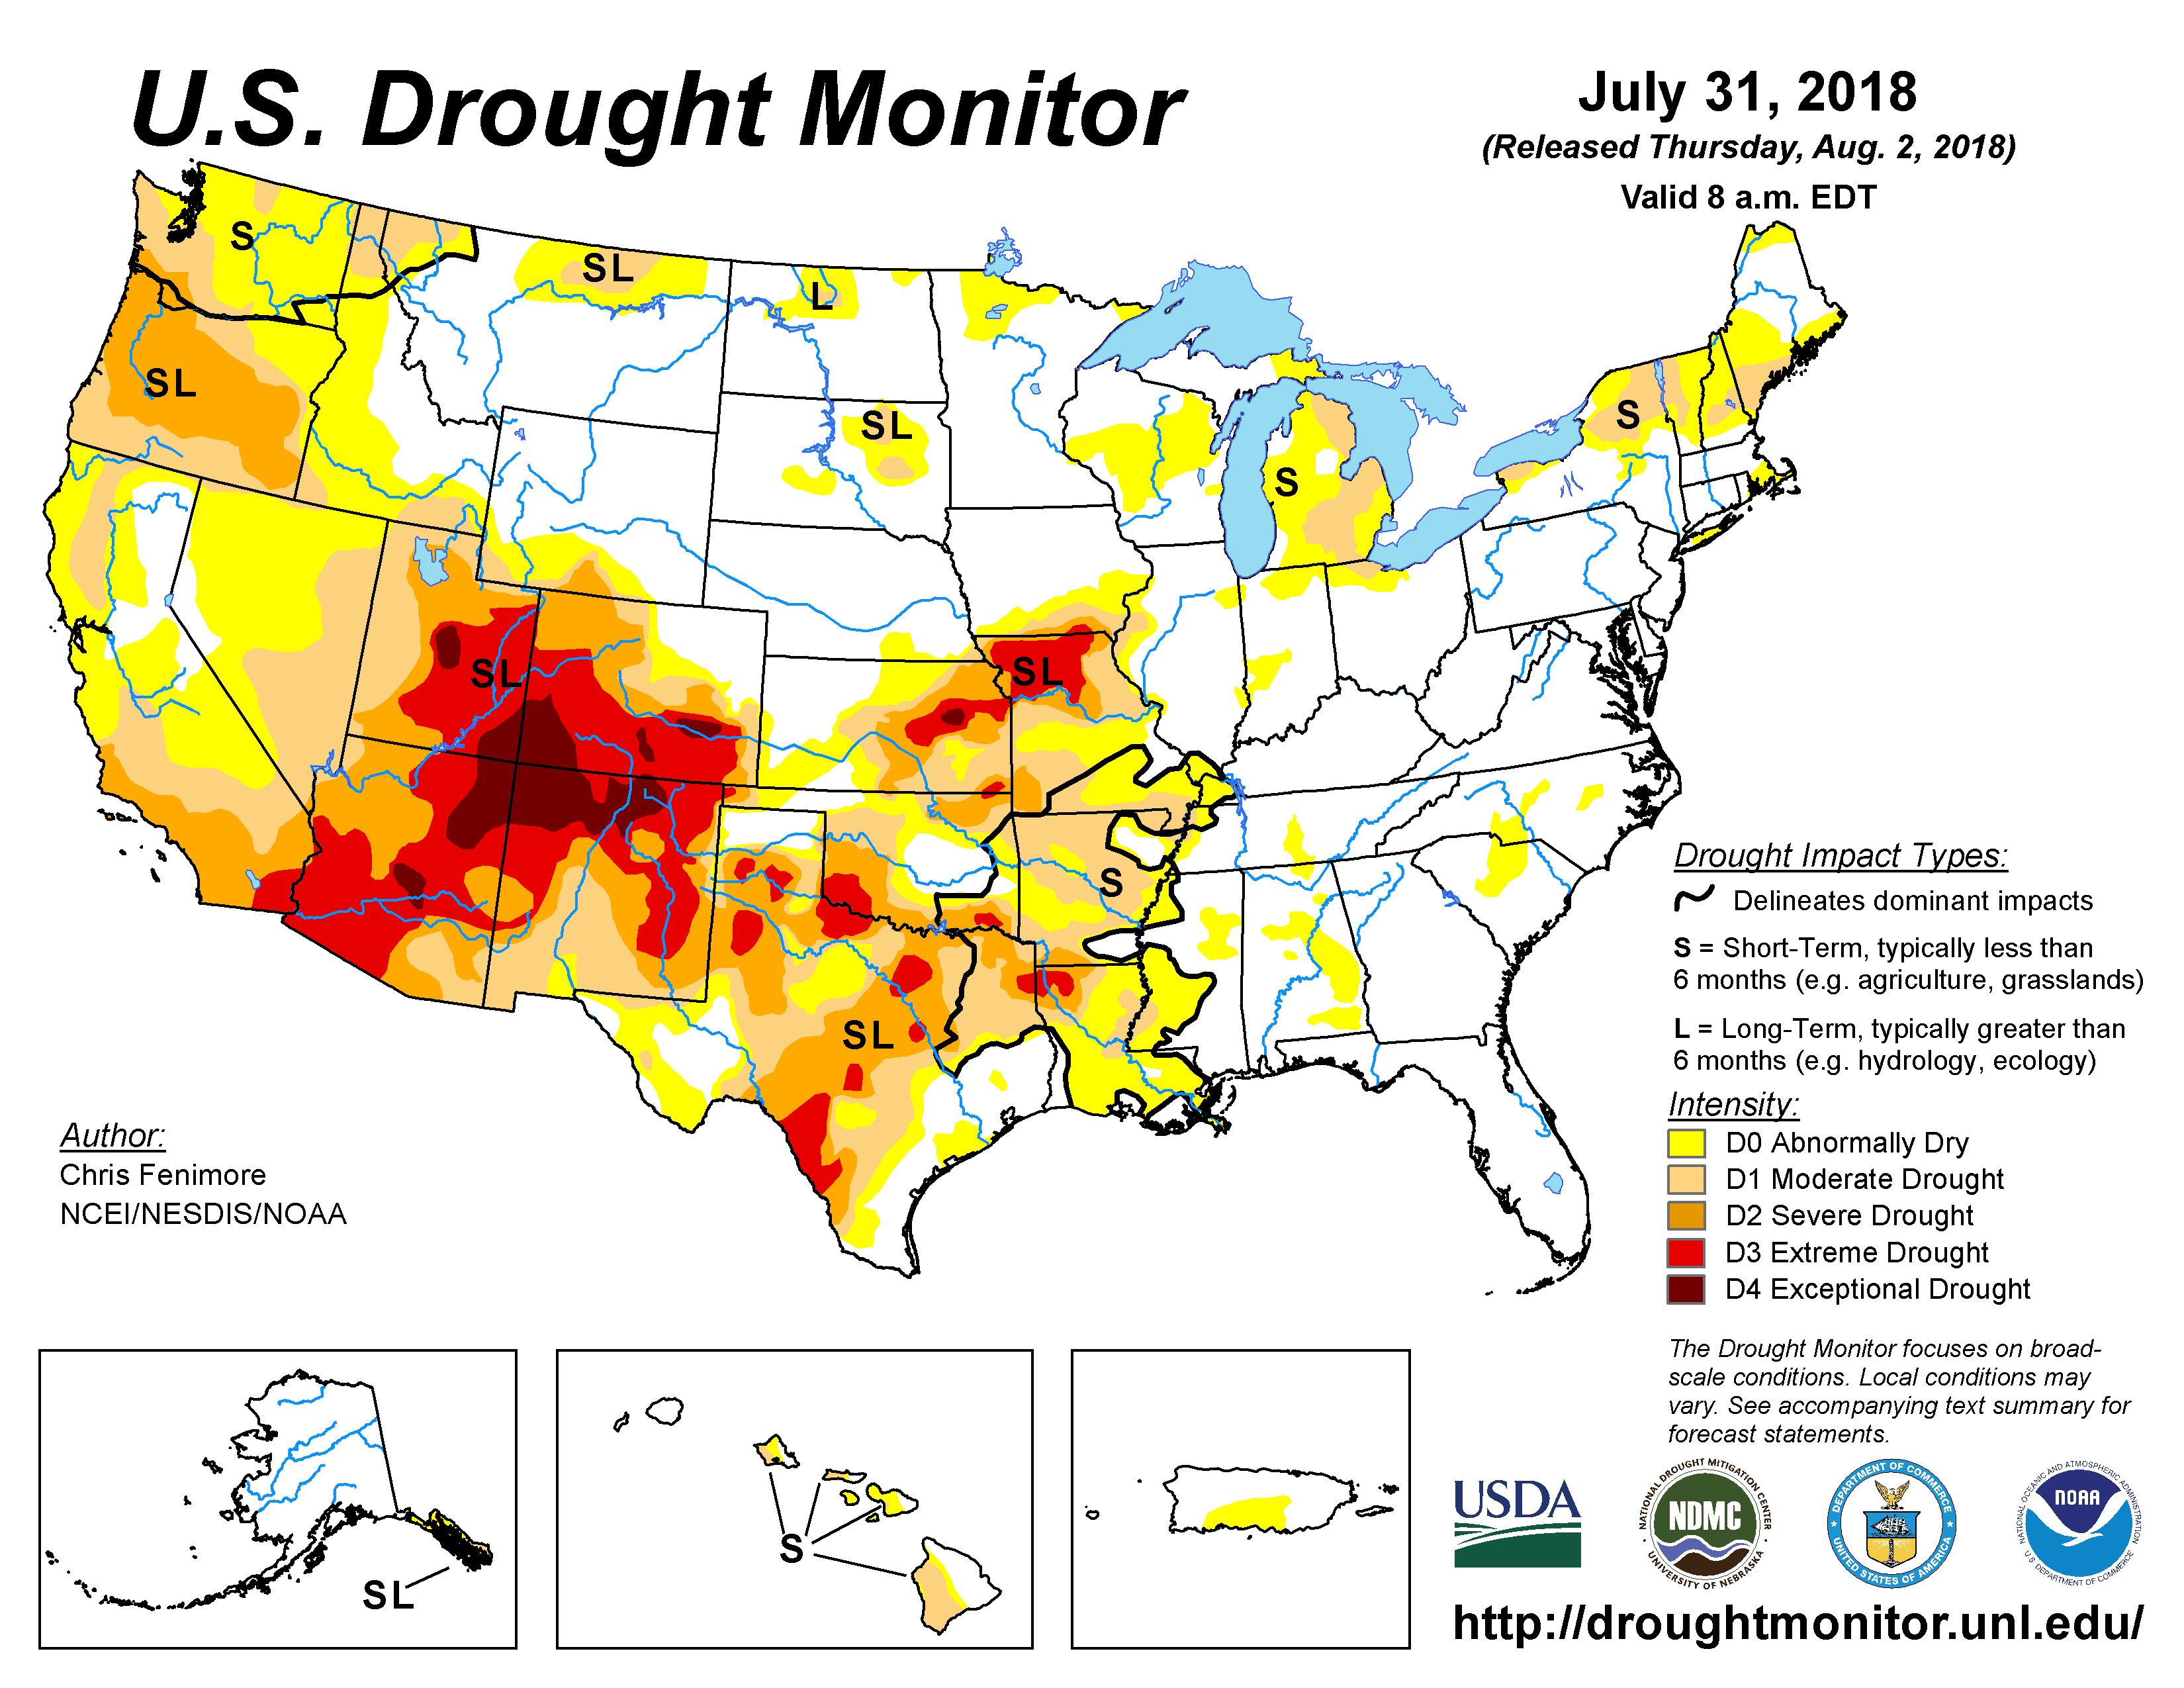
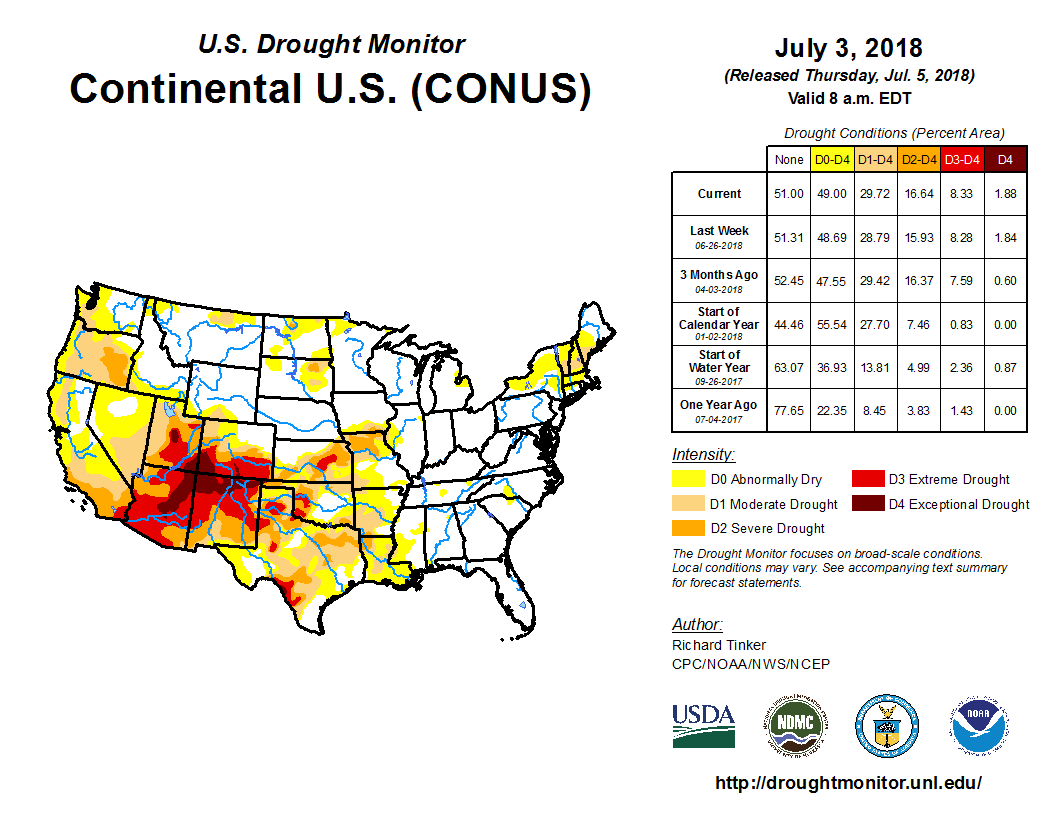
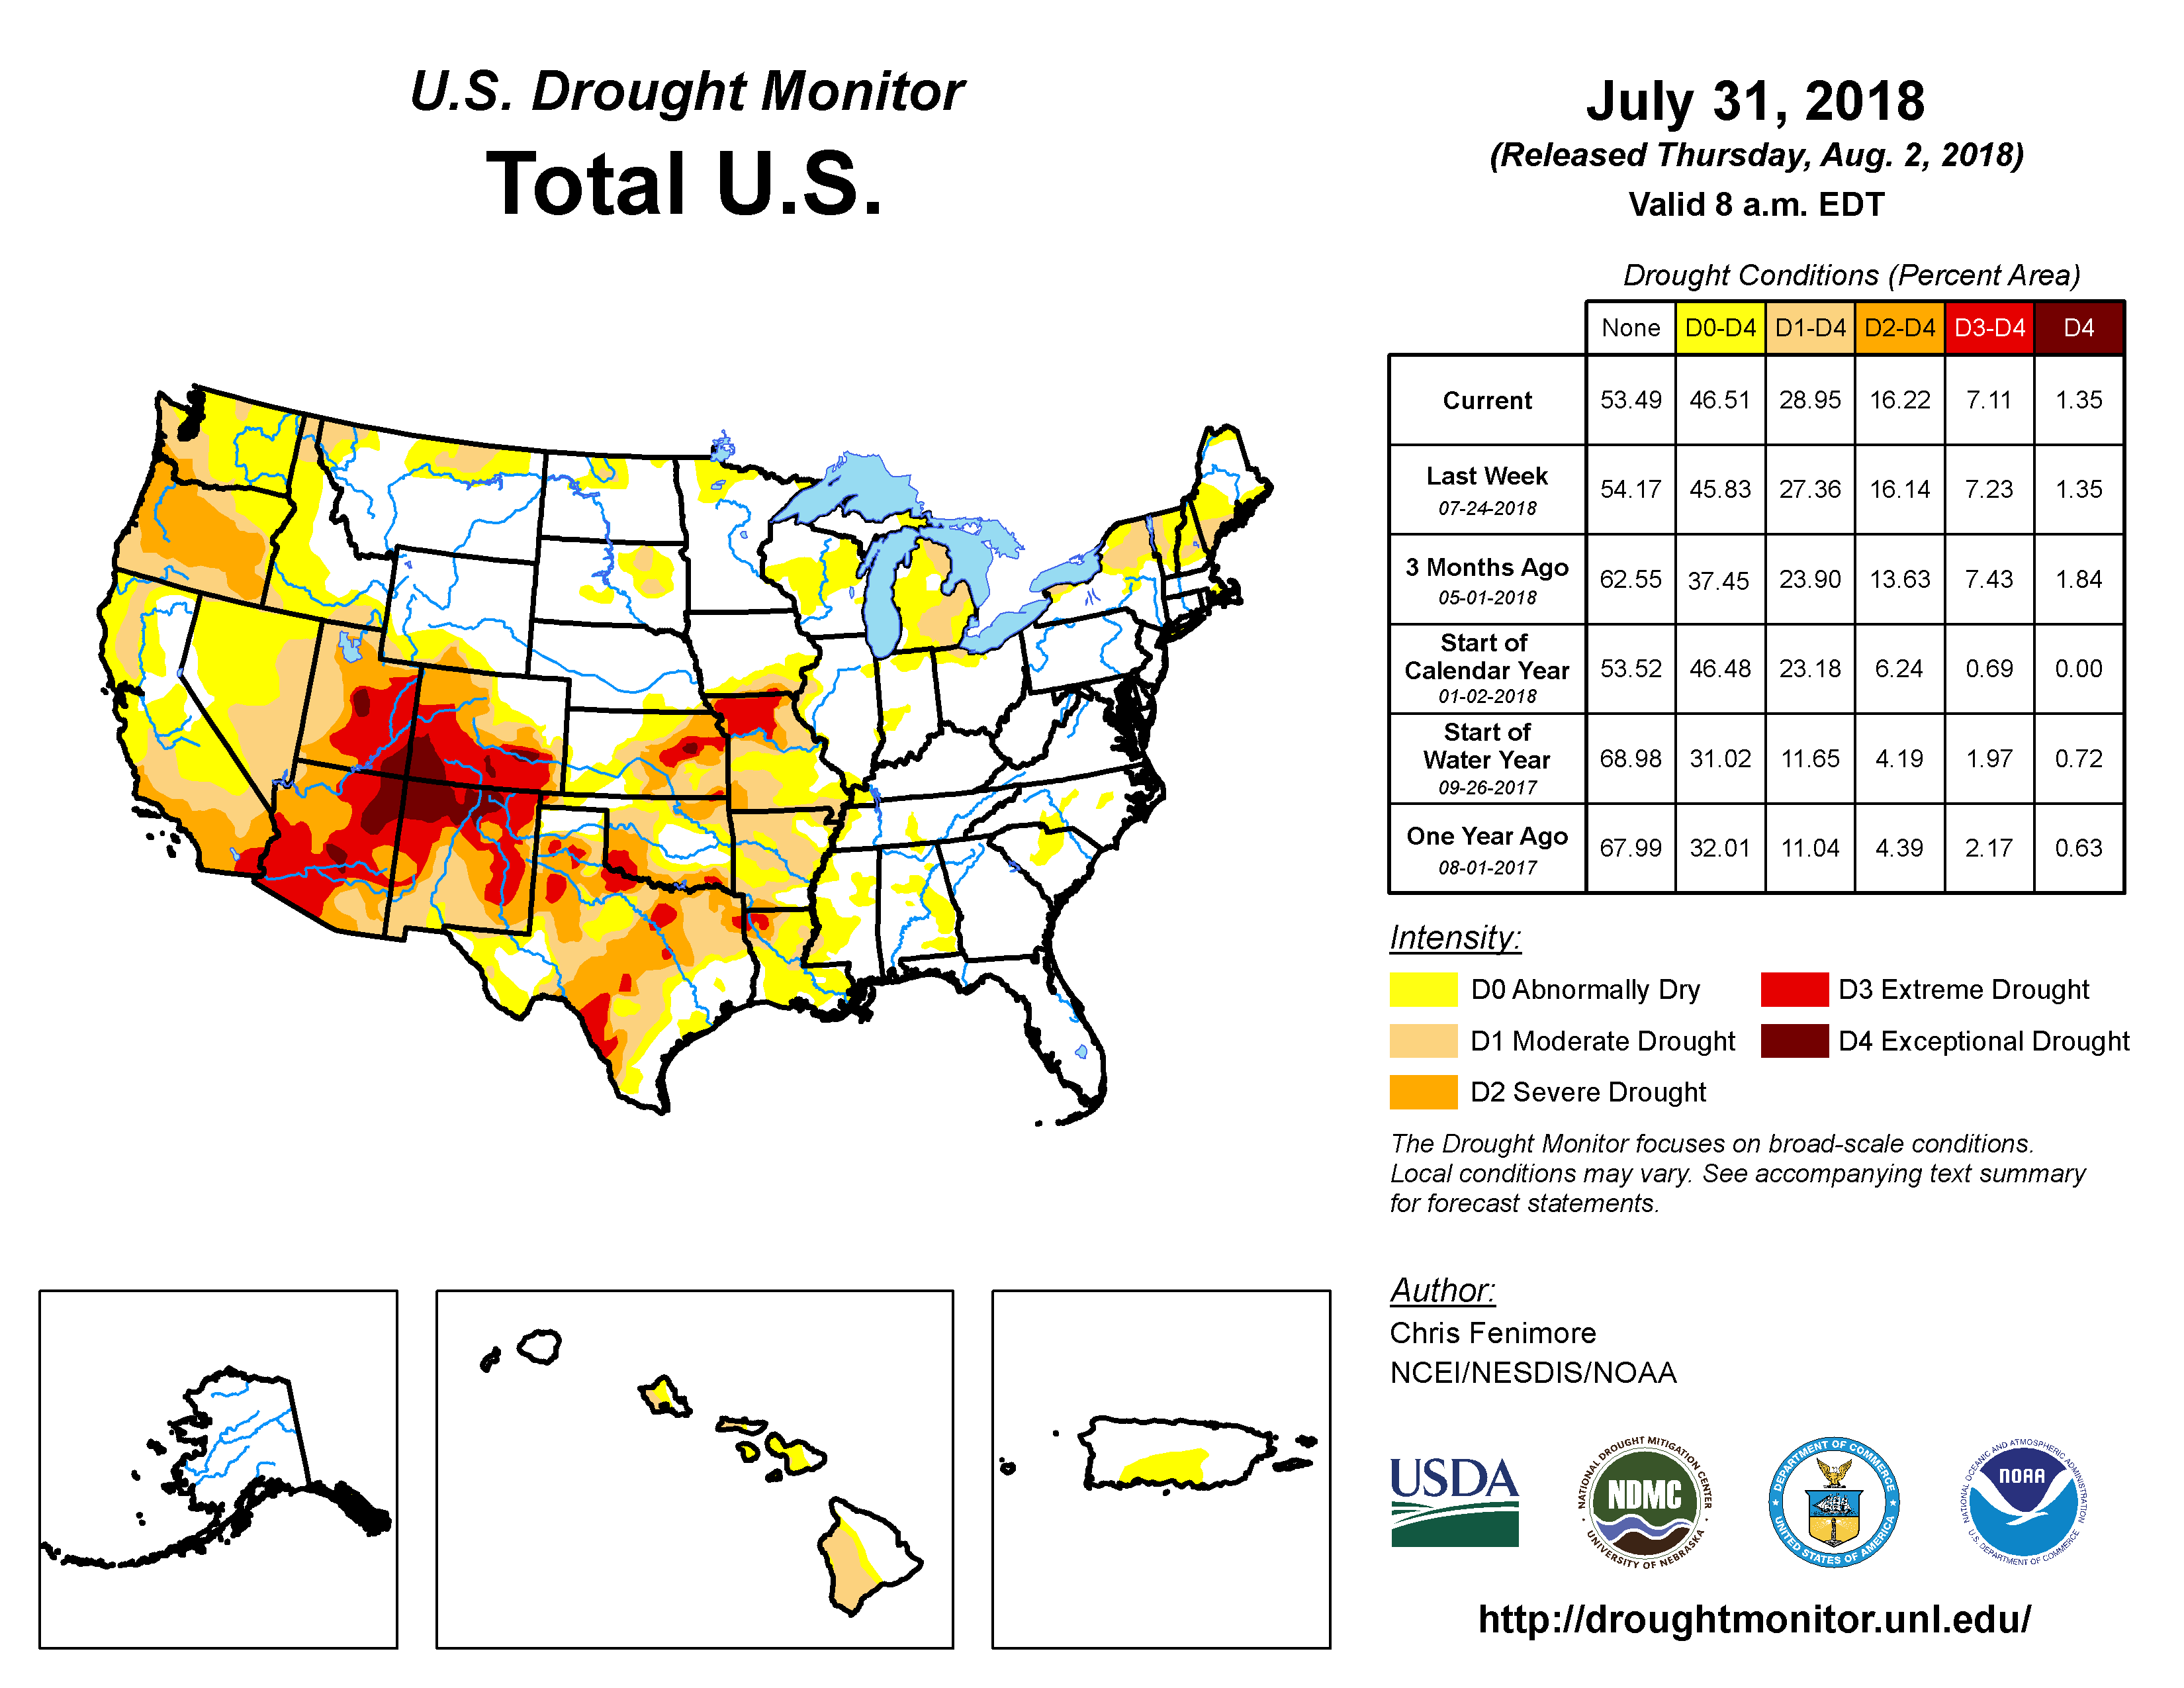
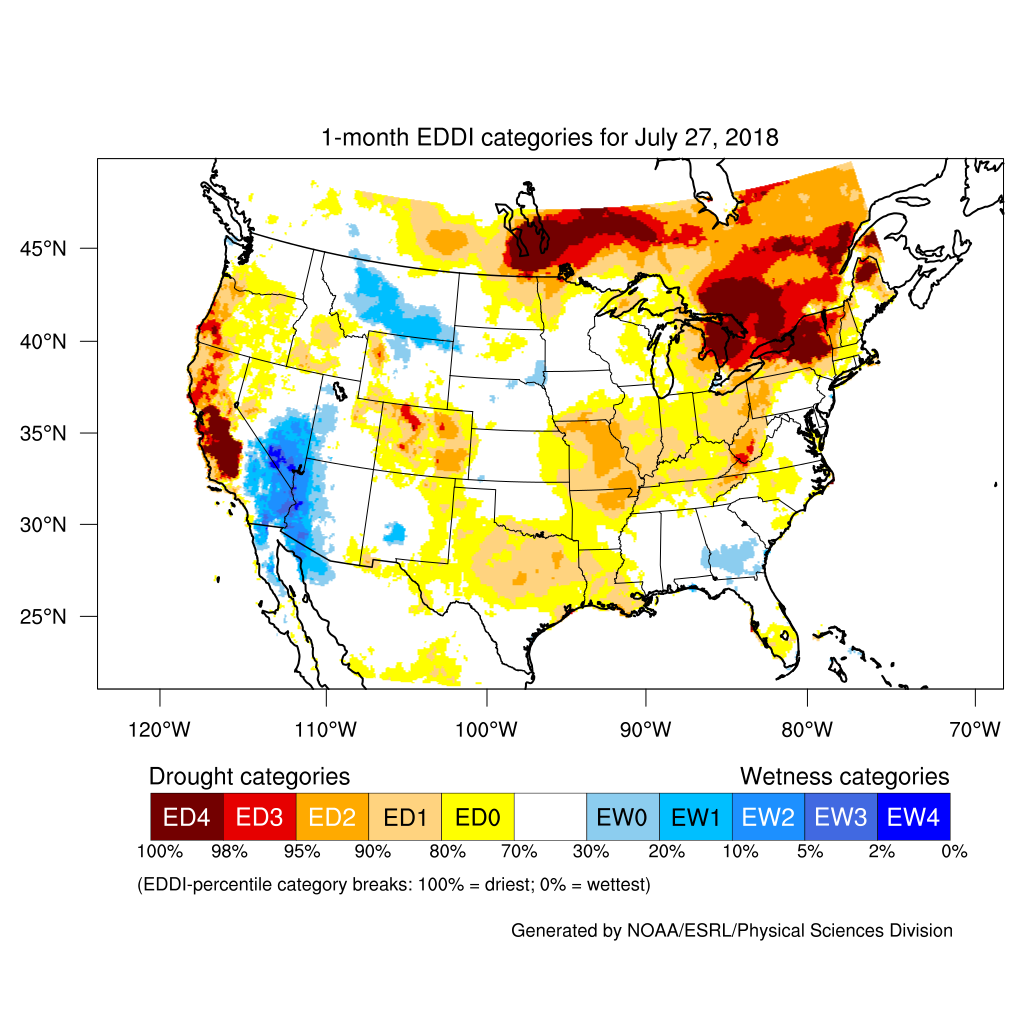
- Some of the precipitation during July fell on areas that were in drought at the beginning of the month and contracted drought and abnormal dryness, while other drought areas continued quite dry. Drought and abnormal dryness developed, expanded, or intensified in the Pacific Northwest to northern and central Rockies, central Texas to Mid-Mississippi Valley, Great Lakes, northern portions of the Northeast, and in Hawaii, while it contracted in parts of the Southwest, Plains, and Northeast, and parts of Puerto Rico. Expansion outweighed contraction, so at the national level drought expanded from 29.7 percent of the CONUS at the end of June to 34.1 percent of the CONUS at the end of July (from 24.8 percent to 29.0 percent for all of the U.S.).
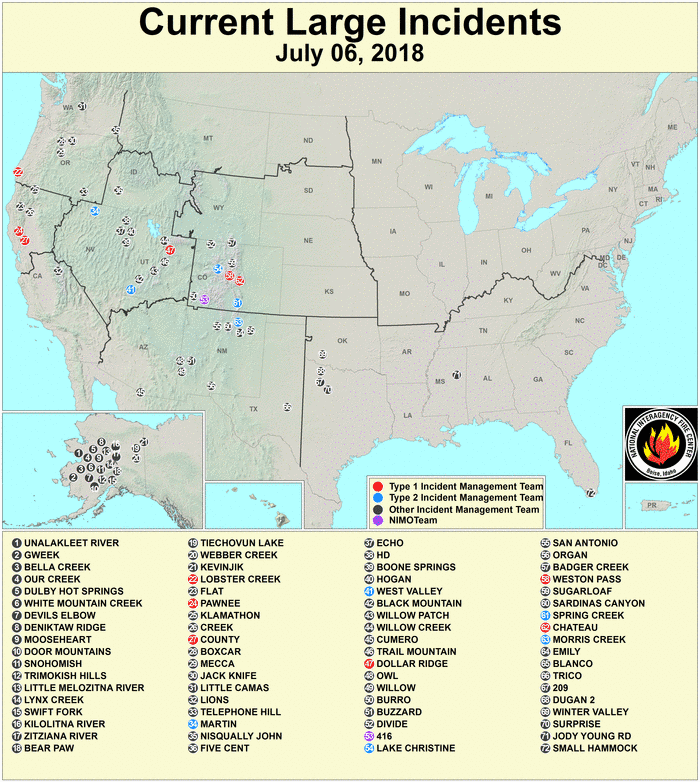
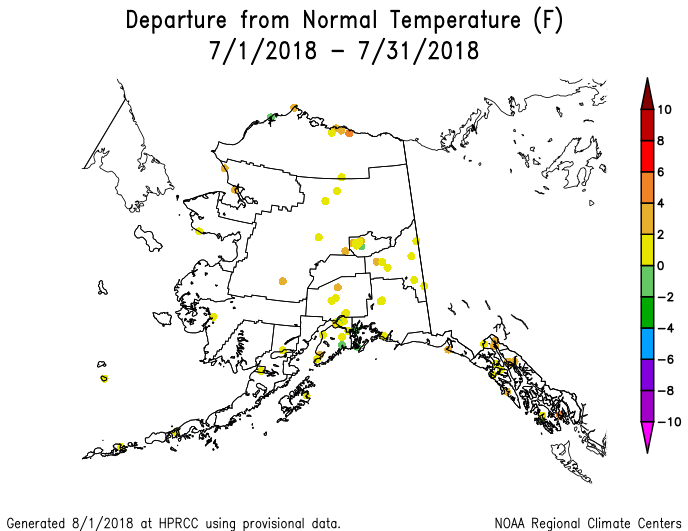
- Lack of precipitation and intensifying drought during the last one to twelve months (SPI maps for last 1, 2, 3, 6, 9, 12 months) had set the stage for the widespread development of wildfires in the Southwest to southern Plains and, more recently, in the Pacific Northwest to northern Rockies. Fire conditions were made worse by the hot temperatures and low humidity, which increased evapotranspiration and further dried out vegetation. July began with dozens of large wildfires, mostly concentrated in the Southwest and California but also some in the southern Plains and Pacific Northwest. As the month progressed, they multiplied in number and became more widespread in the Pacific Northwest and northern Rockies and, for a time, in the southern Plains (wildfire maps for July 1, 6, 10, 12, 18, 24, 26, 28, 29, 31). By the end of the month, about twice as many large wildfires were burning as at the beginning of the month. The jet stream flow, when averaged for the month, resulted in an anomalous ridge over Alaska. With the ridge came above-normal temperatures and, for the central to eastern and southeastern areas, below-normal precipitation. Numerous large wildfires burned in the central to eastern dry areas throughout the month (Alaska wildfire maps for July 1, 12, 18, 26, 28, 29, 31). But, according to the NOAA National Weather Service, due to the cooler-than-normal June and lack of convection in July, wildfire activity was well below average in July 2018 and total acreage burned for the season as of the end of July was 361,000 acres, which is 69 percent of median for this point in the season. Lightning is an important trigger for wildfires, and the lack of convective storms resulted in less lightning compared to average.
- The atmospheric circulation needed to create the instability and dynamics favorable for severe weather consists largely of a southwesterly flow across the central part of the CONUS, which funnels moist Gulf of Mexico air and its latent heat energy into the mix. Surface fronts provide additional atmospheric lifting. The changing direction of the circulation around surface lows and the upper-level troughs and lows above them adds spin to the rising air, which enhances the formation of tornadoes. This upper-level circulation pattern occurred frequently as the short-wave troughs and closed lows, and their associated surface fronts and lows, moved across the country, with some type of severe weather (hail, strong winds, or tornadoes) occurring every day. But these weather systems were fighting against the broadscale ridge and its predominantly descending stable air, so the number of tornadoes for July 2018 (96 based on preliminary data) was less than the July average of 134. The tornadoes mostly occurred from the central Plains to Midwest as the fronts and lows traversed these areas. The day with the most tornadoes was July 19th, with the passage of a strong upper-level short-wave trough and surface frontal system across Iowa. This was about the time when the long-wave trough set up over the eastern CONUS. In fact, 20 tornadoes occurred during July 1-17, when the ridge dominated, and 76 during July 18-31, when the trough held sway over the eastern CONUS.
Typically tropical cyclone activity is enhanced in the Eastern North Pacific and inhibited in the North Atlantic during El Niños, and inhibited in the Eastern North Pacific and enhanced in the North Atlantic during La Niñas, due mostly to changes in vertical wind shear during the two extreme events. The relationship is unclear during ENSO-neutral events. Warm sea surface temperatures (SSTs) fuel tropical cyclones while vertical wind shear tears them apart. The tropical Pacific Ocean was in an ENSO-neutral state during July 2018.
- The Atlantic hurricane season runs from June 1st through November 30th and the Eastern North Pacific (ENP) hurricane season runs from May 15th through November 30th.
- Two hurricanes developed in the North Atlantic basin during July 2018. Beryl developed early in the month in the middle of the tropical North Atlantic about halfway between Africa and South America. It moved westward with the steering currents along the southern edge of the North Atlantic High (Bermuda High). It quickly reached hurricane strength, then moved into a region of drier air and strong westerly vertical shear which tore Hurricane Beryl apart as it approached the Lesser Antilles. The clouds, moisture, and convection that remained were steered into the Caribbean, then northward, by the circulation along the southwestern edge of the Bermuda High. When the remnants of Beryl moved off the Carolina coast, they interacted with an upper-level trough moving over the eastern CONUS which regenerated it as a subtropical storm. Subtropical Storm Beryl then got caught up in the westerly flow and moved farther out to sea with the jet stream and fronts. While Beryl was languishing in the Caribbean, Chris developed off the Carolina coast as a low pressure trough then tropical depression. Since the steering currents between the CONUS ridge and Bermuda High at that time were weak, Chris wobbled back and forth in that area for a couple days. Eventually Chris was pulled into a trough and moved northeast with the jet stream flow, briefly intensifying into a hurricane before transforming into an extratropical cyclone and being absorbed into a cold front.
- Five tropical systems were active in the Eastern North Pacific basin during July 2018. All of them were eventually deflected west along the southern edge of the North Pacific High. Tropical Storm Emilia, which formed in June, had weakened to a tropical depression by the beginning of July and dissipated shortly thereafter. Hurricane Fabio pretty much followed in Emilia's footsteps just a few days later. Tropical Storm Gilma and Tropical Depression 9-E formed near the end of the month, moved west toward the Hawaiian Islands, but dissipated well southeast of Hawaii when they moved into an area of strong westerly shear, cooler sea surface temperatures (SSTs), and a more stable air mass. Hector developed as a tropical depression (10-E) at the end of July, and intensified into a tropical storm (and later hurricane) in early August. The Eastern North Pacific tropical cyclone activity was likely enhanced by the MJO this month.
- No tropical cyclones formed in, or moved into, the Central North Pacific during July. Three tropical disturbances (99E, 92C, and 93C) developed there, and trekked westward a bit under the steering currents along the southern edge of the North Pacific High. But none of them had the support of warm-enough SSTs or favorable upper-level winds to strengthen, and each dissipated well south of the Hawaiian Islands.
- Six tropical cyclones and one tropical disturbance were active in the Western North Pacific in or near the U.S.-Affiliated Pacific Islands (USAPI) (Micronesia) during July. Some had their start as tropical disturbances within USAPI waters, but most intensified after they left USAPI waters. The steering currents along the southwestern edge of the North Pacific High largely influenced the direction these systems traveled. Prapiroon had reached tropical storm strength by the end of June, and further strengthened into a typhoon in early July. Prapiroon moved across Japan before being swept up as an extra-tropical cyclone in the westerly flow of the mid-latitude jet stream. Maria formed as a disturbance within USAPI waters, brushed the Marianas as a tropical storm, and intensified to super typhoon status over the Philippine Sea before slamming into the coast of China. Tropical Storm Son-Tinh formed as a disturbance south of the Marianas, intensified over the Philippine Sea, and made landfall near Hanoi, Vietnam a couple weeks later. Tropical Storm Ampil began life as a tropical disturbance northwest of Palau, intensified over the Philippine Sea and headed northwest where it mated with the Chinese coast. Jongdari had its start as a disturbance southeast of the Marianas, also strengthened over the Philippine Sea, eventually achieving typhoon status. The storm headed north, flirted with southern Japan, then became embedded within a baroclinic low in the mid-latitude jet stream. Jongdari meandered in or near the East China Sea at the end of July and beginning of August. Wukong formed north of the USAPI, achieving typhoon status and being directed northward along the western edge of the North Pacific High. It eventually transitioned into an extratropical cyclone when it was picked up by a cold front in the westerlies. Tropical Disturbance 99W formed within the USAPI near the end of the month but quickly dissipated.
|
North America monthly upper-level circulation pattern. The upper-level circulation pattern during July, when averaged for the month, consisted of a large ridge over the southwestern CONUS, a trough over the eastern CONUS, and a slight trough over the Pacific Northwest coast. The ridge dominated and the troughs were weak, as indicated by the above-normal height anomalies across most of the CONUS and most of North America. |
|
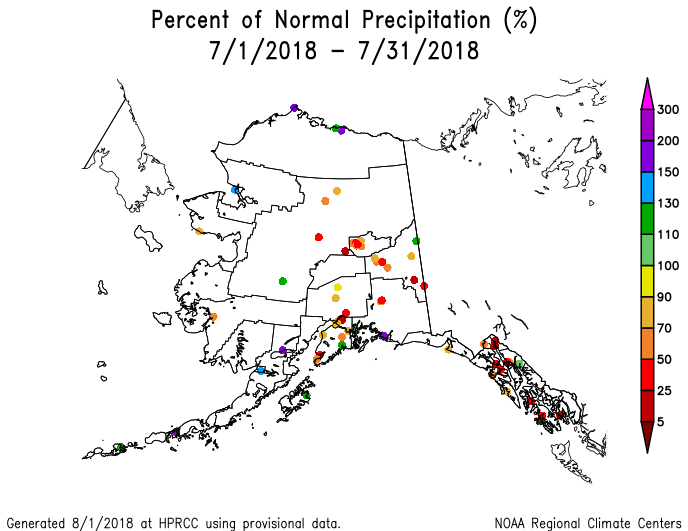
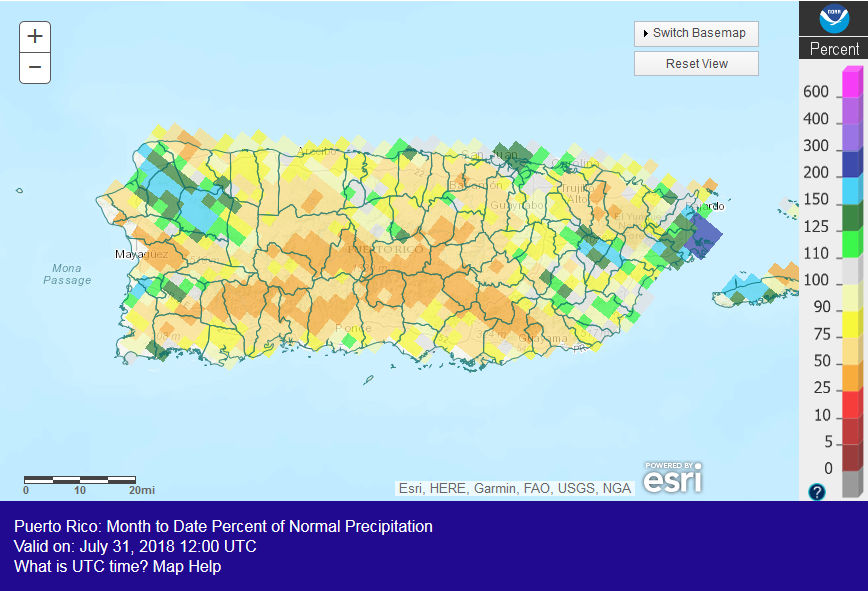
Map of monthly precipitation anomalies. Monthly precipitation for July was drier than normal across much of California, the Pacific Northwest to northern Rockies, and much of Texas and the Mid-Mississippi Valley to Great Lakes. July was wetter than normal in parts of the Southwest, central to northern Plains, coastal Southeast, and most of the Northeast. Alaska was wetter than normal at the northern and southwestern coastal stations, and drier than normal elsewhere. In Hawaii, some stations in the central islands were wetter than normal, but most of the islands were drier than normal. Puerto Rico was mostly drier than normal. |
|
Map of monthly temperature anomalies. Monthly temperatures during July were warmer than normal across most of the West, southern Plains, Northeast, and Great Lakes, and most of Alaska. July temperatures were near to cooler than normal from the northern Plains to Southeast. |
 Northern Hemisphere monthly upper-level circulation pattern. Global Linkages: The upper-level (500-mb) circulation anomaly pattern over North America was part of a complex long-wave pattern that stretched across the Northern Hemisphere. East/west couplings of circulation anomalies are evident over Eurasia, but above-normal anomalies dominated the rest of the Northern Hemisphere mid-latitudes, suggesting an abnormal contraction of the circumpolar vortex, with high pressure ridging seeming to dominate. The upper-level circulation and its anomalies are associated with the Sea Level Pressure (SLP) pattern and its anomalies which reflect the semi-permanent centers of action of SLP. The above-normal upper-level height anomalies over the North Pacific, North Atlantic, North America, and northern Europe appear to be associated with above-normal SLP. The below-normal heights and upper-level trough over north central Russia seem to be correlated with low surface pressure and near to below-normal SLP anomalies. The locations of these anomalies with respect to the long-term climatology suggests that the North Pacific High and North Atlantic High were stronger than normal and shifted to the north; the Aleutian Low was weaker than normal (although this is the time of year when the Aleutian and Icelandic Lows are their weakest); and the Icelandic Low seemed a bit stronger than normal. The pronounced ridging and troughing over northern Russia, and strong SLP anomalies, indicate an enhanced storm track in that region. During July 2018, there was a pronounced latitudinal change in sea surface temperature (SST) anomalies and the rate at which they changed in both the North Pacific and North Atlantic. The SSTs warmed considerably over the last month in a band near about 40 degrees North latitude, and cooled considerably south of that band around 30 N. The cooling extended northward in the eastern parts of both basins. The result was a latitudinally stratified pattern of monthly SST anomalies. In the North Pacific, SSTs were warmer than normal in the Bering Sea, near to cooler than normal just south of that, warmer than normal around 40-50 N, near to cooler than normal south of that band, and warmer than normal in a near-equatorial band. In the North Atlantic, warmer-than-normal SSTs at about 40 N were straddled by cooler-than-normal SSTs in bands to the north and south. The above-normal 500-mb heights were associated with upper-level ridging, or with weakened troughs, at the mid-latitudes; below-normal precipitation (over Northern to Central Europe, western and eastern Canada, and northeastern CONUS); above-normal surface temperatures (over western North America, eastern Canada, and much of Europe to western Russia); and warm SST anomalies that were getting warmer (in the northern portions of the North Atlantic and North Pacific). The areas of below-normal 500-mb heights were associated with upper-level troughing, or with weakened ridges; near- to below-normal surface temperatures (over central Russia); cool SST anomalies (in the northern North Atlantic); and above-normal precipitation (over north central Russia). Parts of Russia and South America, and a little bit of Africa, were cooler than normal, and parts of the Pacific, Atlantic, and Indian Oceans had cooler-than-normal SST anomalies. But with most of Africa, Eurasia, and Australia, and much of North and South America, having warmer- to much-warmer-than-normal temperatures, and large portions of the Atlantic, Pacific, and Indian Oceans having warmer-than-normal sea surface temperatures, the July 2018 global temperature was still well above normal. |
Atmospheric Drivers
Subtropical highs, and fronts and low pressure systems moving in the mid-latitude storm track flow, are influenced by the broadscale atmospheric circulation. The circulation of the atmosphere can be analyzed and categorized into specific patterns. The Tropics, especially the equatorial Pacific Ocean, provides abundant heat energy which largely drives the world's atmospheric and oceanic circulation. The following describes several of these modes or patterns of the atmospheric circulation, their drivers, the temperature and precipitation patterns (or teleconnections) associated with them, and their index values this month:
-
El Niño Southern Oscillation (ENSO)
- Description: Oceanic and atmospheric conditions in the tropical Pacific Ocean can influence weather across the globe. ENSO is characterized by two extreme modes: El Niño (warmer-than-normal sea surface temperature [SST] anomalies in the tropical Pacific) and La Niña (cooler-than-normal SST anomalies), with the absence of either of these modes termed "ENSO-neutral" conditions.
- Status: The ocean and atmosphere system reflected an ENSO-neutral state during July 2018, although SSTs were near to above average across most of the equatorial Pacific Ocean.
- Teleconnections (influence on weather): The NWS CPC has no teleconnections for ENSO-neutral conditions.
- Comparison to Observed: The July 2018 temperature and precipitation anomaly patterns do not match the teleconnections for El Niño or La Niña.
-
Madden-Julian Oscillation (MJO)
- Description: The MJO is a tropical disturbance or "wave" that propagates eastward around the global tropics with a cycle on the order of 30-60 days. It is characterized by regions of enhanced and suppressed tropical rainfall. One of its indices is a phase diagram which illustrates the phase (1-8) and amplitude of the MJO on a daily basis. The MJO is categorized into eight "phases" depending on the pattern of the location and intensity of the regions of enhanced and suppressed tropical rainfall. The MJO can enter periods of little or no activity, when it becomes neutral or incoherent and has little influence on the weather. Overall, the MJO tends to be most active during ENSO-neutral years, and is often absent during moderate-to-strong El Niño and La Niña episodes.
- Status: The MJO Wheeler-Hendon index indicated that the MJO began July incoherent, then transitioned to phases 5 and 6 after the first week. Other aspects of the tropical ocean-atmosphere system (referred to in the CPC reports as the background or low frequency [e.g., La Niña] state, Kelvin and Rossby waves, and tropical cyclone activity) also appeared to play a role in influencing the month's climate (especially Rossby waves and Kelvin waves and tropical cyclones) (MJO updates for July 9, 16, 23, and 30).
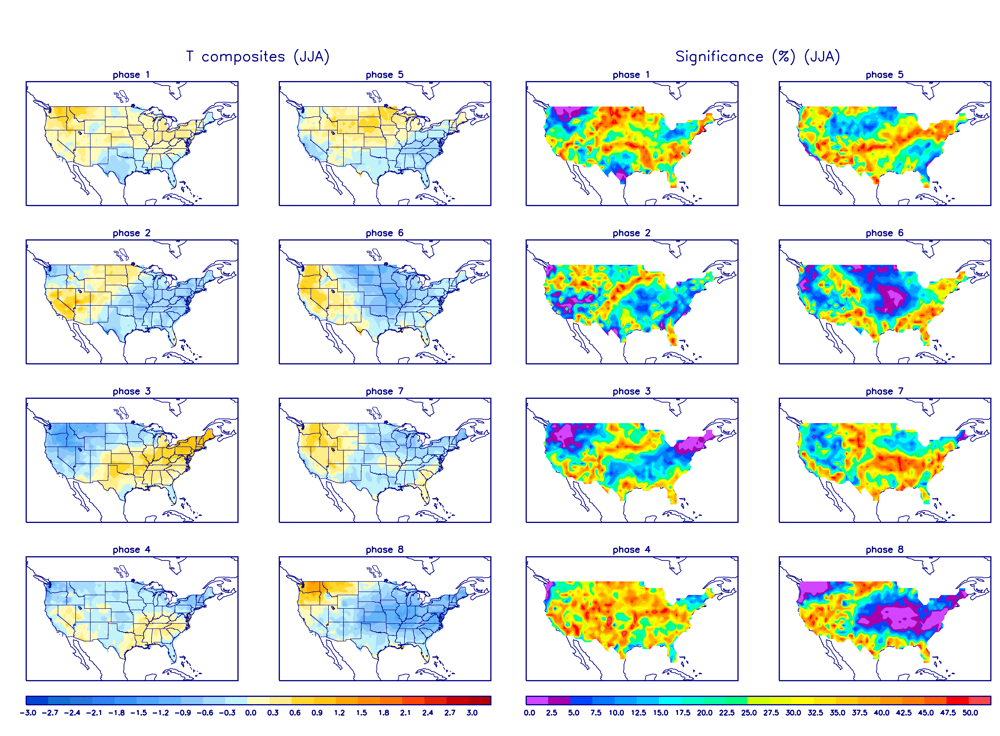
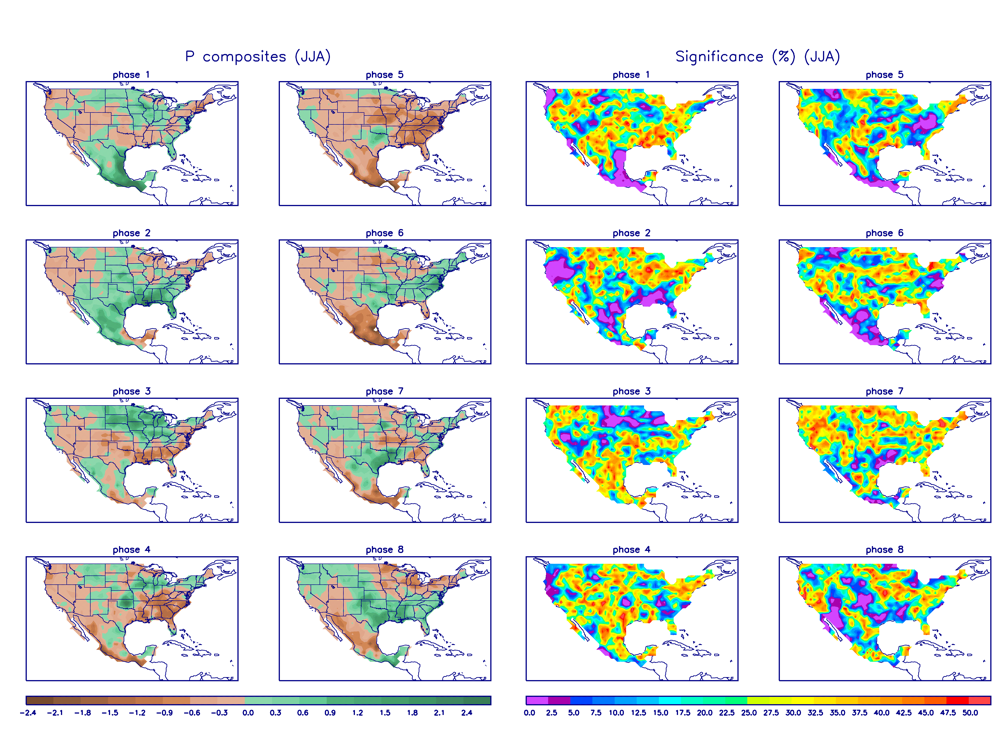
- Teleconnections (influence on weather): The MJO's temperature and precipitation teleconnections to U.S. weather depend on time of year and MJO phase; there is also a lagged component associated with the teleconnections. To the extent teleconnections are known, the July (June-August) teleconnections for temperature are shown here and for precipitation are shown here.
- Comparison to Observed: The MJO is transitory and can change phases (modes) within a month, so it is usually more closely related to weekly weather patterns than monthly. In the case of July 2018, the MJO spent some of the time (July 9-18) in phase 5, and some of the time (July 19-29) in phase 6. The teleconnections for phases 5 or 6 have little in common with the monthly precipitation and temperature anomaly patterns. But there is good agreement at the weekly scale. The weekly temperature and precipitation anomaly patterns for week 2 (July 8-14) are similar to the teleconnections for phase 5; the weekly temperature and precipitation anomaly patterns for week 4 (July 22-28) are similar to the teleconnections for phase 6; and the weekly temperature and precipitation anomaly patterns for week 3 (July 15-21) bridge the teleconnections for phases 5 and 6.
- The Pacific/North American (PNA) pattern
- Description: The PNA teleconnection pattern is associated with strong fluctuations in the strength and location of the East Asian jet stream. PNA-related blocking of the jet stream flow in the Pacific can affect weather downstream over North America, especially the West and especially in the winter half of the year.
- Status: The daily PNA index began the month negative and ended the month positive, but was near to slightly below zero for most of the month, averaging negative for the month as a whole. The 3-month-averaged index was negative.
- Teleconnections (influence on weather): To the extent teleconnections are known, a negative PNA for this time of year (July on the quarterly teleconnection maps) has no temperature teleconnections in the CONUS; is associated with cold temperature anomalies in northern Alaska; is weakly associated with below-normal precipitation from Montana to Texas, and above-normal precipitation from Iowa to the Great Lakes; and has no teleconnections with upper-level circulation anomalies over the CONUS or most of Alaska.
- Comparison to Observed: The July 2018 monthly precipitation anomaly pattern does not agree with the teleconnections for a negative PNA. The monthly upper-level circulation and temperature anomaly patterns have no teleconnections to match.
- The Arctic Oscillation (AO) pattern
- Description: The AO teleconnection pattern relates upper-level circulation over the Arctic to circulation features over the Northern Hemisphere mid-latitudes and is most active during the cold season.
- Status: The daily AO index was weakly positive for most of the month, ending the month slightly negative, and averaging positive for the month. The 3-month-averaged index was positive.
- Teleconnections (influence on weather): To the extent teleconnections are known, a positive AO in July (June-August in the AO Composites table) is typically associated with below-normal upper-level circulation anomalies over the Arctic Ocean and Greenland into Alaska and northwest Russia; above-normal upper-level circulation anomalies over the North Atlantic extending into North America along the U.S./Canadian border, and over parts of the North Pacific; above-normal temperatures across the northern to central Plains and Upper Mississippi Valley; near-normal temperatures elsewhere in the CONUS; and wetter-than-normal conditions across the Southeast and Arizona; and drier-than-normal conditions across the southern to central Plains, Midwest, and Northeast.
- Comparison to Observed: The July 2018 monthly upper-level circulation anomaly pattern agrees where there are teleconnections for a positive AO, and the precipitation anomaly pattern agrees in some places, but the monthly temperature anomaly pattern is opposite to the teleconnections where teleconnections exist. The weekly anomaly patterns, however, are a good match during the first half of the month when the AO was positive. The temperature anomaly pattern for week 2 agrees well, and the precipitation anomaly patterns for weeks 1 and 2 are a good match for the dry areas.
- The North Atlantic Oscillation (NAO) pattern
- Description: The NAO teleconnection pattern relates upper-level circulation over the North Atlantic Ocean to circulation features over the Northern Hemisphere mid-latitudes.
- Status: The daily NAO index oscillated between positive and near zero throughout the month, and averaged positive for the month. The 3-month-averaged index was strongly positive.
- Teleconnections (influence on weather): To the extent teleconnections are known, a positive NAO during this time of year (July on the quarterly teleconnection maps) is associated with above-normal upper-level circulation anomalies from the western CONUS to southern Canada all along the international border, especially over Montana and southwest Canada, and over the Atlantic just south of the Canadian Maritime provinces to Europe; below-normal circulation anomalies over northern Canada to Greenland; above-normal temperature anomalies for the Pacific Northwest to northern Plains, extending into southwest Canada; below-normal temperatures over the southern Plains to Southeast; drier-than-normal precipitation anomalies in parts of the Midwest and northern Plains; and wetter-than-normal precipitation anomalies in eastern Texas to the Lower Mississippi Valley, but the precipitation teleconnections are few and weak.
- Comparison to Observed: The July 2018 monthly upper-level circulation anomaly pattern is a very good match where the teleconnections exist for a positive NAO. The precipitation anomaly pattern has some agreement, but there are few teleconnections. The temperature anomaly pattern does not match where teleconnections exist.
- The West Pacific (WP) pattern
- Description: The WP teleconnection pattern is a primary mode of low-frequency variability over the North Pacific and reflects zonal and meridional variations in the location and intensity of the (East Asian) jet stream in the western Pacific.
- Status: The monthly WP index was negative.
- Teleconnections (influence on weather): To the extent teleconnections are known, a negative WP during this time of year (July on the quarterly teleconnection maps) is typically associated with below-normal circulation anomalies over western Canada; above-normal circulation anomalies over the southwestern CONUS and adjacent Pacific, Midwest and Northeast CONUS to eastern Canada, Western Europe, and eastern Siberia; above-normal temperatures in the Southwest, from the Midwest and Northeast into eastern Canada; and near-normal temperatures elsewhere in the CONUS and Alaska. There are no precipitation teleconnections in the CONUS.
- Comparison to Observed: The July 2018 monthly upper-level circulation anomaly pattern agrees with the teleconnections for a negative WP over most areas where teleconnections exist (except western Canada). The temperature anomaly pattern agrees well in the Southwest, Northeast, and eastern Canada. The monthly precipitation anomaly pattern has no teleconnections to compare to. There is also similarity between the upper-level teleconnections for a negative WP and the upper-level circulation anomaly maps for the first half of the month (July 1-17).
- The East Pacific-North Pacific (EP-NP) pattern
- Description: The EP-NP teleconnection pattern relates SST and upper-level circulation patterns (geopotential height anomalies) over the eastern and northern Pacific to temperature, precipitation, and circulation anomalies downstream over North America. Its influence during the winter is not as strong as during the other three seasons.
- Status: The July 2018 monthly EP-NP index was near zero (slightly negative).
- Teleconnections (influence on weather): The NWS CPC has no teleconnections for a neutral (near zero) EP-NP.
- Comparison to Observed: The July 2018 monthly temperature, precipitation, and upper-level circulation anomaly patterns have no teleconnections to compare to for a neutral EP-NP. However, the monthly upper-level circulation anomaly pattern is similar over the CONUS and eastern Canada to the teleconnections for a negative EP-NP (July on the quarterly maps, with above-normal upper-level circulation anomalies over the north central CONUS to central and eastern Canada), and the monthly precipitation anomaly pattern agrees with drier-than-normal teleconnections over Montana and Iowa (although there are few teleconnections besides those). A daily EP-NP index is not computed by CPC. However, there is similarity between the upper-level teleconnections for a negative EP-NP and the upper-level circulation anomaly maps for the first half of the month (July 1-17), and between a negative EP-NP's warmer-than-normal temperatures across the north central CONUS to central Canada and the temperature anomaly pattern for the second week.
| Week | Temperature | Precipitation | Circulation |
| July 1-7 | — | AO | WP, (EP-NP) |
| July 8-14 | MJO, AO, (EP-NP) |
MJO, AO | WP, (EP-NP) |
| July 15-21 | MJO | MJO | — |
| July 22-28 | MJO | MJO | — |
Examination of the available circulation indices and their teleconnection patterns, and comparison to observed July 2018 weekly and monthly temperature, precipitation, and circulation anomaly patterns, indicates that the weather over the CONUS in July could have been influenced by several atmospheric drivers. The equatorial Pacific was in an ENSO-neutral state and did not have an influence; the PNA teleconnections did not match the observed anomalies and thus did not have an influence. The MJO may have had an influence on the temperature and precipitation patterns on a weekly time scale. The AO and NAO were a good match for the monthly circulation pattern, and also for temperature and precipitation during some weeks. For the WP, the circulation teleconnections had good agreement in many places on both the monthly and weekly time scales. The EP-NP was technically neutral for the month, but the observed temperature and circulation anomaly patterns match up well with the teleconnections for a negative EP-NP. The circulation, temperature, and precipitation anomaly patterns were not a perfect match for any of the indices, but taken together they tell a convincing story.
This month illustrates how the atmospheric circulation for the month can reflect the combined influence of atmospheric drivers (or modes of atmospheric variability) originating in the Pacific, Atlantic, and Arctic Oceans.