Continental Temperature Anomalies
Current Month
| Continent | Anomaly (1910-2000) | Trend (1910-2020) | Rank (out of 111 years) | Records | |||||
|---|---|---|---|---|---|---|---|---|---|
| °C | °F | °C | °F | Year(s) | °C | °F | |||
| North America | +1.18 | +2.12 | +0.18 | +0.33 | Warmest | 31st | 1998 | +3.59 | +6.46 |
| Coolest | 81st | 1936 | -5.16 | -9.29 | |||||
| South America | +1.21 | +2.18 | +0.13 | +0.23 | Warmest | 4th | 2016 | +1.71 | +3.08 |
| Coolest | 108th | 1918 | -0.97 | -1.75 | |||||
| Europe | +3.86 | +6.95 | +0.17 | +0.31 | Warmest | 2nd | 1990 | +4.11 | +7.40 |
| Coolest | 110th | 1929 | -5.29 | -9.52 | |||||
| Africa | +1.18 | +2.12 | +0.13 | +0.24 | Warmest | 9th | 2010 | +2.55 | +4.59 |
| Coolest | 101st | 1918 | -1.09 | -1.96 | |||||
| Ties: 2013, 2009 | |||||||||
| Asia | +4.09 | +7.36 | +0.23 | +0.42 | Warmest | 1st | 2020 | +4.09 | +7.36 |
| Coolest | 111th | 1969 | -3.85 | -6.93 | |||||
| Oceania | +1.14 | +2.05 | +0.10 | +0.19 | Warmest | 7th | 1983 | +1.86 | +3.35 |
| Coolest | 105th | 1917 | -2.22 | -4.00 | |||||
Year To Date
| Continent | Anomaly (1910-2000) | Trend (1910-2020) | Rank (out of 111 years) | Records | |||||
|---|---|---|---|---|---|---|---|---|---|
| °C | °F | °C | °F | Year(s) | °C | °F | |||
| North America | +1.66 | +2.99 | +0.20 | +0.36 | Warmest | 17th | 2016 | +3.21 | +5.78 |
| Coolest | 95th | 1936 | -3.45 | -6.21 | |||||
| South America | +1.29 | +2.32 | +0.13 | +0.24 | Warmest | 3rd | 2016 | +1.63 | +2.93 |
| Coolest | 109th | 1918 | -0.90 | -1.62 | |||||
| Europe | +3.56 | +6.41 | +0.16 | +0.28 | Warmest | 1st | 2020 | +3.56 | +6.41 |
| Coolest | 111th | 1942 | -3.86 | -6.95 | |||||
| Africa | +0.92 | +1.66 | +0.11 | +0.20 | Warmest | 11th | 2010 | +2.09 | +3.76 |
| Coolest | 100th | 1925 | -1.37 | -2.47 | |||||
| Ties: 2014 | |||||||||
| Asia | +3.78 | +6.80 | +0.21 | +0.38 | Warmest | 1st | 2020 | +3.78 | +6.80 |
| Coolest | 111th | 1969 | -3.56 | -6.41 | |||||
| Oceania | +1.29 | +2.32 | +0.12 | +0.21 | Warmest | 3rd | 2019 | +1.89 | +3.40 |
| Coolest | 109th | 1917 | -1.59 | -2.86 | |||||
Seasonal
| Continent | Anomaly (1910-2000) | Trend (1910-2020) | Rank (out of 111 years) | Records | |||||
|---|---|---|---|---|---|---|---|---|---|
| °C | °F | °C | °F | Year(s) | °C | °F | |||
| North America | +1.67 | +3.01 | +0.19 | +0.33 | Warmest | 12th | 2016 | +3.22 | +5.80 |
| Coolest | 100th | 1918 | -2.65 | -4.77 | |||||
| South America | +1.26 | +2.27 | +0.13 | +0.24 | Warmest | 2nd | 2016 | +1.60 | +2.88 |
| Coolest | 110th | 1918 | -0.79 | -1.42 | |||||
| Europe | +3.29 | +5.92 | +0.14 | +0.25 | Warmest | 1st | 2020 | +3.29 | +5.92 |
| Coolest | 111th | 1942 | -3.11 | -5.60 | |||||
| Africa | +1.06 | +1.91 | +0.11 | +0.20 | Warmest | 5th | 2010 | +1.89 | +3.40 |
| Coolest | 107th | 1925 | -1.08 | -1.94 | |||||
| Asia | +3.22 | +5.80 | +0.21 | +0.38 | Warmest | 1st | 2020 | +3.22 | +5.80 |
| Coolest | 111th | 1969 | -2.73 | -4.91 | |||||
| Oceania | +1.76 | +3.17 | +0.12 | +0.21 | Warmest | 2nd | 2019 | +1.89 | +3.40 |
| Coolest | 110th | 1917 | -1.40 | -2.52 | |||||
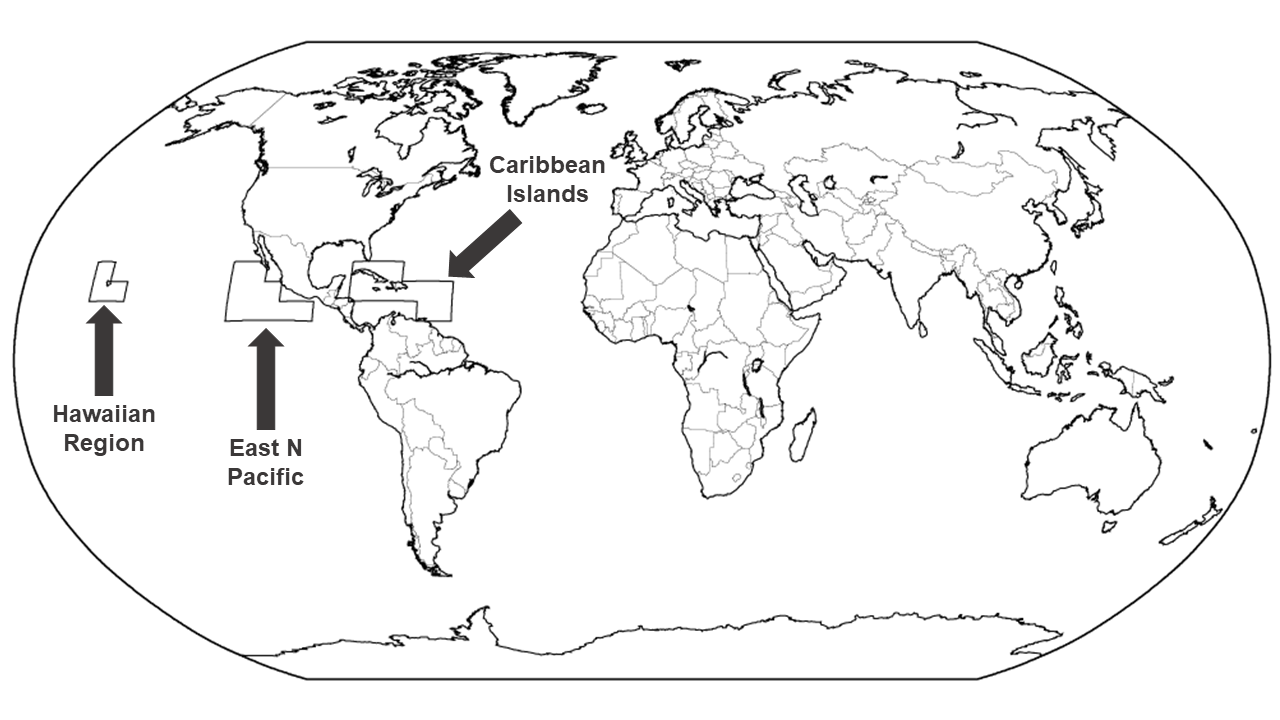
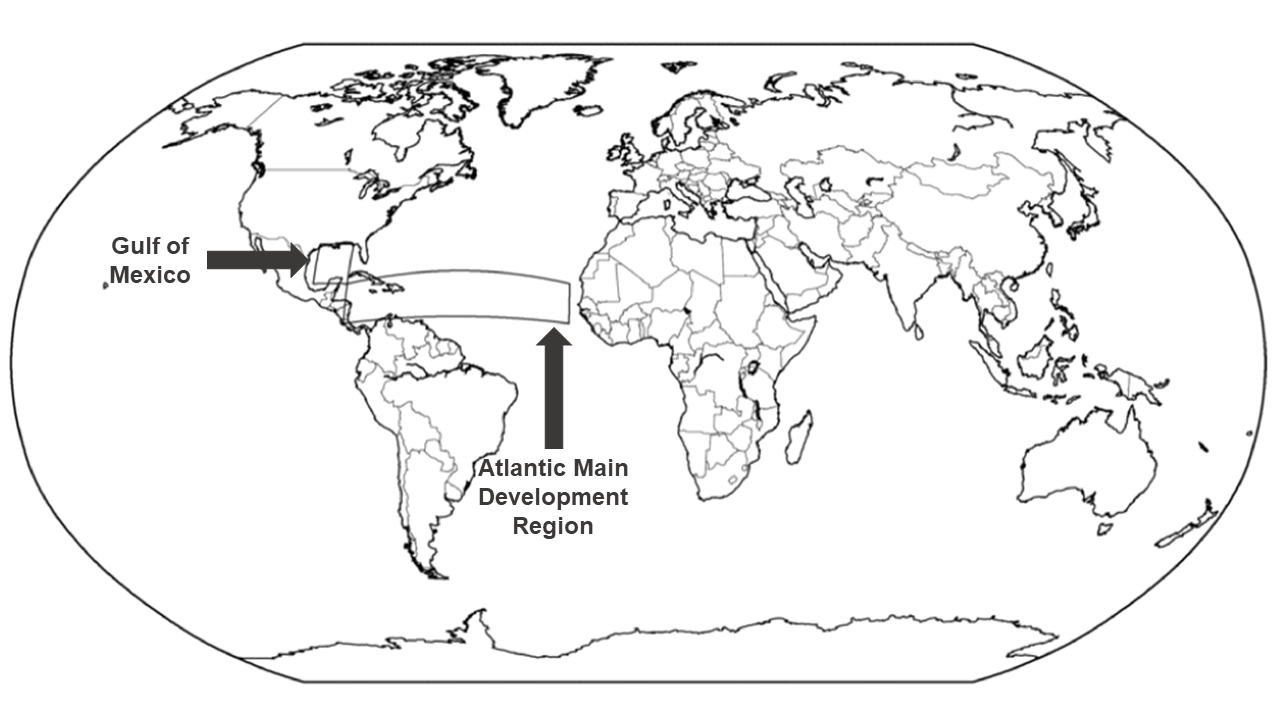
Regional Temperature Anomalies
Current Month
| Region | Anomaly (1910-2000) | Trend (1910-2020) | Rank (out of 111 years) | Records | |||||
|---|---|---|---|---|---|---|---|---|---|
| °C | °F | °C | °F | Year(s) | °C | °F | |||
| Caribbean Islands | +1.09 | +1.96 | +0.09 | +0.16 | Warmest | 1st | 2020 | +1.09 | +1.96 |
| Coolest | 111th | 1910 | -1.00 | -1.80 | |||||
| Atlantic MDR | +0.82 | +1.48 | +0.09 | +0.16 | Warmest | 3rd | 2010 | +1.26 | +2.27 |
| Coolest | 108th | 1925 | -0.90 | -1.62 | |||||
| Ties: 2016 | |||||||||
| Gulf of Mexico | +0.63 | +1.13 | +0.00 | +0.00 | Warmest | 19th | 1932 | +1.64 | +2.95 |
| Coolest | 91st | 1912 | -1.44 | -2.59 | |||||
| Ties: 2008, 1999 | |||||||||
| Hawaiian Region | +0.53 | +0.95 | +0.07 | +0.12 | Warmest | 23rd | 2015 | +0.97 | +1.75 |
| Coolest | 89th | 1910 | -1.39 | -2.50 | |||||
| East N Pacific | +0.68 | +1.22 | +0.07 | +0.13 | Warmest | 15th | 2015 | +1.33 | +2.39 |
| Coolest | 97th | 1917 | -1.36 | -2.45 | |||||
Year To Date
| Region | Anomaly (1910-2000) | Trend (1910-2020) | Rank (out of 111 years) | Records | |||||
|---|---|---|---|---|---|---|---|---|---|
| °C | °F | °C | °F | Year(s) | °C | °F | |||
| Caribbean Islands | +1.05 | +1.89 | +0.09 | +0.16 | Warmest | 2nd | 2016 | +1.08 | +1.94 |
| Coolest | 110th | 1910 | -1.06 | -1.91 | |||||
| Atlantic MDR | +0.75 | +1.35 | +0.09 | +0.16 | Warmest | 6th | 2010 | +1.08 | +1.94 |
| Coolest | 105th | 1925 | -0.89 | -1.60 | |||||
| Ties: 1998 | |||||||||
| Gulf of Mexico | +0.72 | +1.30 | +0.00 | +0.01 | Warmest | 12th | 1932 | +1.40 | +2.52 |
| Coolest | 99th | 1964 | -1.07 | -1.93 | |||||
| Ties: 1916 | |||||||||
| Hawaiian Region | +0.70 | +1.26 | +0.07 | +0.13 | Warmest | 9th | 1941 | +0.99 | +1.78 |
| Coolest | 103rd | 1910 | -1.12 | -2.02 | |||||
| East N Pacific | +0.71 | +1.28 | +0.07 | +0.13 | Warmest | 11th | 2016 | +1.35 | +2.43 |
| Coolest | 100th | 1917 | -1.33 | -2.39 | |||||
| Ties: 1958 | |||||||||
Seasonal
| Region | Anomaly (1910-2000) | Trend (1910-2020) | Rank (out of 111 years) | Records | |||||
|---|---|---|---|---|---|---|---|---|---|
| °C | °F | °C | °F | Year(s) | °C | °F | |||
| Caribbean Islands | +0.99 | +1.78 | +0.09 | +0.15 | Warmest | 2nd | 2016 | +1.07 | +1.93 |
| Coolest | 110th | 1910 | -1.05 | -1.89 | |||||
| Atlantic MDR | +0.67 | +1.21 | +0.09 | +0.16 | Warmest | 12th | 2010 | +0.99 | +1.78 |
| Coolest | 100th | 1925 | -0.80 | -1.44 | |||||
| Gulf of Mexico | +0.75 | +1.35 | +0.02 | +0.03 | Warmest | 12th | 2017 | +1.30 | +2.34 |
| Coolest | 99th | 1964 | -0.92 | -1.66 | |||||
| Ties: 2018 | |||||||||
| Hawaiian Region | +0.94 | +1.69 | +0.07 | +0.12 | Warmest | 2nd | 1941 | +1.03 | +1.85 |
| Coolest | 110th | 1910 | -0.96 | -1.73 | |||||
| East N Pacific | +0.75 | +1.35 | +0.07 | +0.13 | Warmest | 11th | 2016 | +1.41 | +2.54 |
| Coolest | 100th | 1917 | -1.44 | -2.59 | |||||
| Ties: 1940 | |||||||||
Background
The July 2015 Global State of the Climate report introduces the regional analysis report, which focuses on the analysis of temperature anomalies for six continents: North America, South America, Europe, Africa, Asia, and Oceania.
The regional values, similar to the global values, are derived from the NOAAGlobalTemp data set. The continental polygons are composed of the 5° x 5° grid points with center points in the respective continents. Then, in a similar way to the global analysis, the grid points are weighted by their area and averaged to compute a continental temperature anomaly time series. The anomalies are computed back to 1910, the approximate date by which all continents have station coverage sufficient to resolve values at the regional scale.
This regional analysis complements the global analysis by allowing us to understand and describe the state of an important climate indicator across a continent. It also helps to place the current continental temperature anomalies into historical perspective, displaying how the most current month, season, or year compares to the past.
Please note that all continental anomalies are with respect to the 1910—2000 average.
Region Definitions
References
- Peterson, T.C. and R.S. Vose, 1997: An Overview of the Global Historical Climatology Network Database. Bull. Amer. Meteorol. Soc., 78, 2837-2849.
- Huang, B., V.F. Banzon, E. Freeman, J. Lawrimore, W. Liu, T.C. Peterson, T.M. Smith, P.W. Thorne, S.D. Woodruff, and H-M. Zhang, 2015: Extended Reconstructed Sea Surface Temperature Version 4 (ERSST.v4). Part I: Upgrades and Intercomparisons. J. Climate, 28, 911-930.