Sea Ice Extent
| June 2017 | Sea Ice Extent | Anomaly 1991-2020 | Trend per decade | Rank (39 years) | Record | ||||
|---|---|---|---|---|---|---|---|---|---|
| million km² | million mi² | Year(s) | million km² | million mi² | |||||
| Northern Hemisphere | 10.76 | 4.15 | -4.78% | -4.16% | Largest | 35th | 1979 | 12.53 | 4.84 |
| Smallest | 5th | 2016 | 10.41 | 4.02 | |||||
| Southern Hemisphere | 12.41 | 4.79 | -7.80% | +1.49% | Largest | 38th | 2014 | 14.69 | 5.67 |
| Smallest | 2nd | 2002 | 12.38 | 4.78 | |||||
| Globe | 23.17 | 8.95 | -6.42% | -1.09% | Largest | 39th | 1979 | 26.72 | 10.32 |
| Smallest | 1st | 2017 | 23.17 | 8.95 | |||||
Data Source: National Snow and Ice Data Center (NSIDC). Period of record: 1979–2017 (39 years)

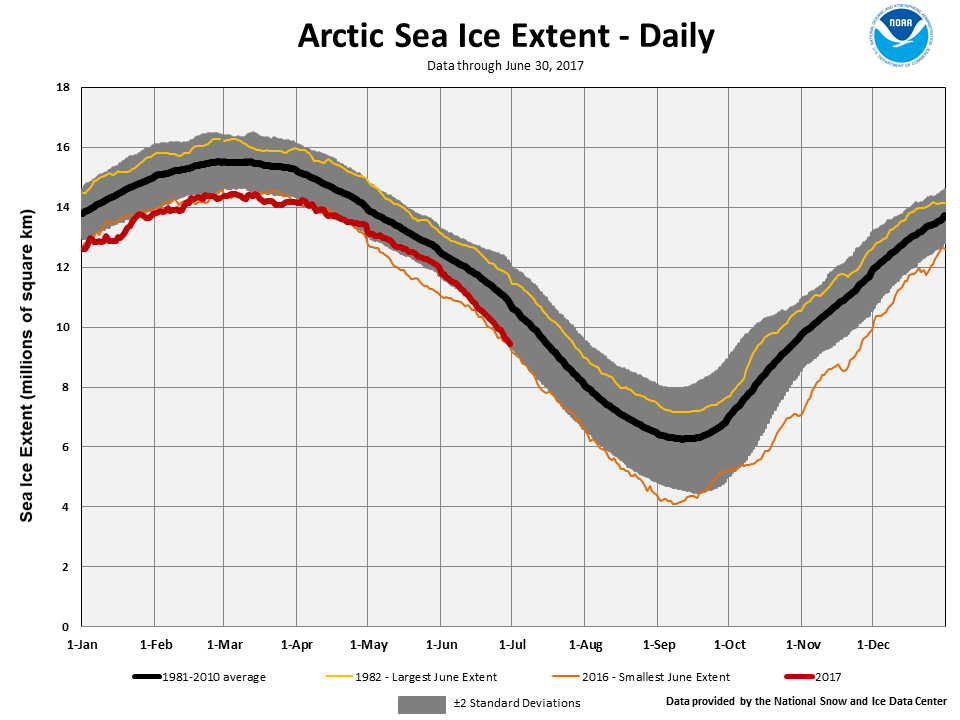
According to the National Snow and Ice Data Center (NSIDC), the Northern Hemisphere (Arctic) sea ice extent — which is measured from passive microwave instruments onboard NOAA satellites — averaged for June 2017 was 11.06 million square km (4.27 million square miles), 900,000 square km (348,000 square miles), or 7.53 percent, below the 1981-2010 average. This was the sixth smallest June Arctic sea ice extent since records began in 1979, but the largest since 2014. For the entire month, the rate of sea ice loss was 81,800 square km (31,600 square miles) per day, which was faster than the 1981-2010 average rate of 56,300 square km (21,700 square miles) per day. By the end of June, the daily sea ice extent was at near record-low levels. Regionally, sea ice extent was below-average in the Chukchi and Barents Seas with near-average ice extent in the Greenland Sea. June Arctic sea ice extent is decreasing at an average rate of 3.6 percent per decade.

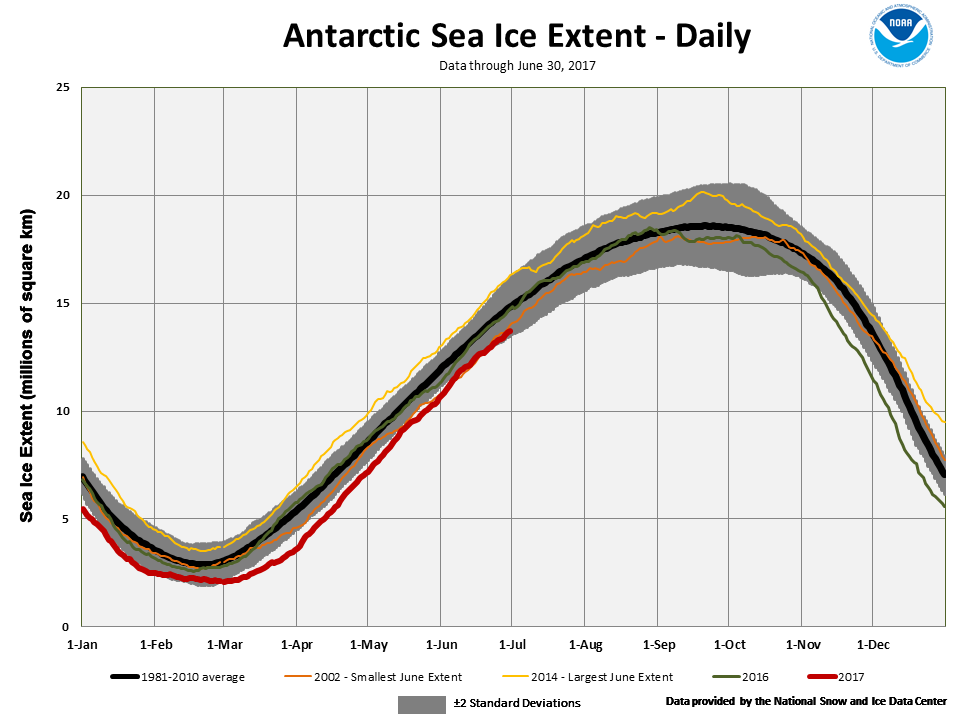
The June Southern Hemisphere (Antarctic) sea ice extent was 13.08 million square km (5.05 million square miles), which was 880,000 square km (340,000 square miles), or 6.30 percent, below the 1981-2010 average. This was the second smallest June Southern Hemisphere sea ice extent on record with only the June Antarctic sea ice extent in 2002 smaller. The rate of ice growth slowed early in the month, causing daily sea ice extent to approach near-record low levels. Sea ice was below average in the Bellingshausen Sea and parts of the Amundsen and Ross Seas. Southern Hemisphere June sea ice extent is increasing at an average rate of 1.3 percent per decade, with substantial inter-annual variability.
For further information on the Northern and Southern Hemisphere snow and ice conditions, please visit the NSIDC News page.