Temperature
Coinciding with the release of the January 2023 Global Climate Report, the NOAA Global Surface Temperature (NOAAGlobalTemp) dataset version 5.1.0 replaced version 5.0.0. This new version includes complete global coverage and an extension of the data record back in time an additional 30 years to January 1850. While anomalies and ranks might differ slightly from what was reported previously, the main conclusions regarding global climate change are very similar to the previous version. Please see our Commonly Asked Questions Document and web story for additional information.
NOAA's National Centers for Environmental Information calculates the global temperature anomaly every month based on preliminary data generated from authoritative datasets of temperature observations from around the globe. The major dataset, NOAAGlobalTemp version 5.1.0 , updated in 2023, uses comprehensive data collections of increased global area coverage over both land and ocean surfaces. NOAAGlobalTempv5.1.0 is a reconstructed dataset, meaning that the entire period of record is recalculated each month with new data. Based on those new calculations, the new historical data can bring about updates to previously reported values. These factors, together, mean that calculations from the past may be superseded by the most recent data and can affect the numbers reported in the monthly climate reports. The most current reconstruction analysis is always considered the most representative and precise of the climate system, and it is publicly available through Climate at a Glance.
January 2023
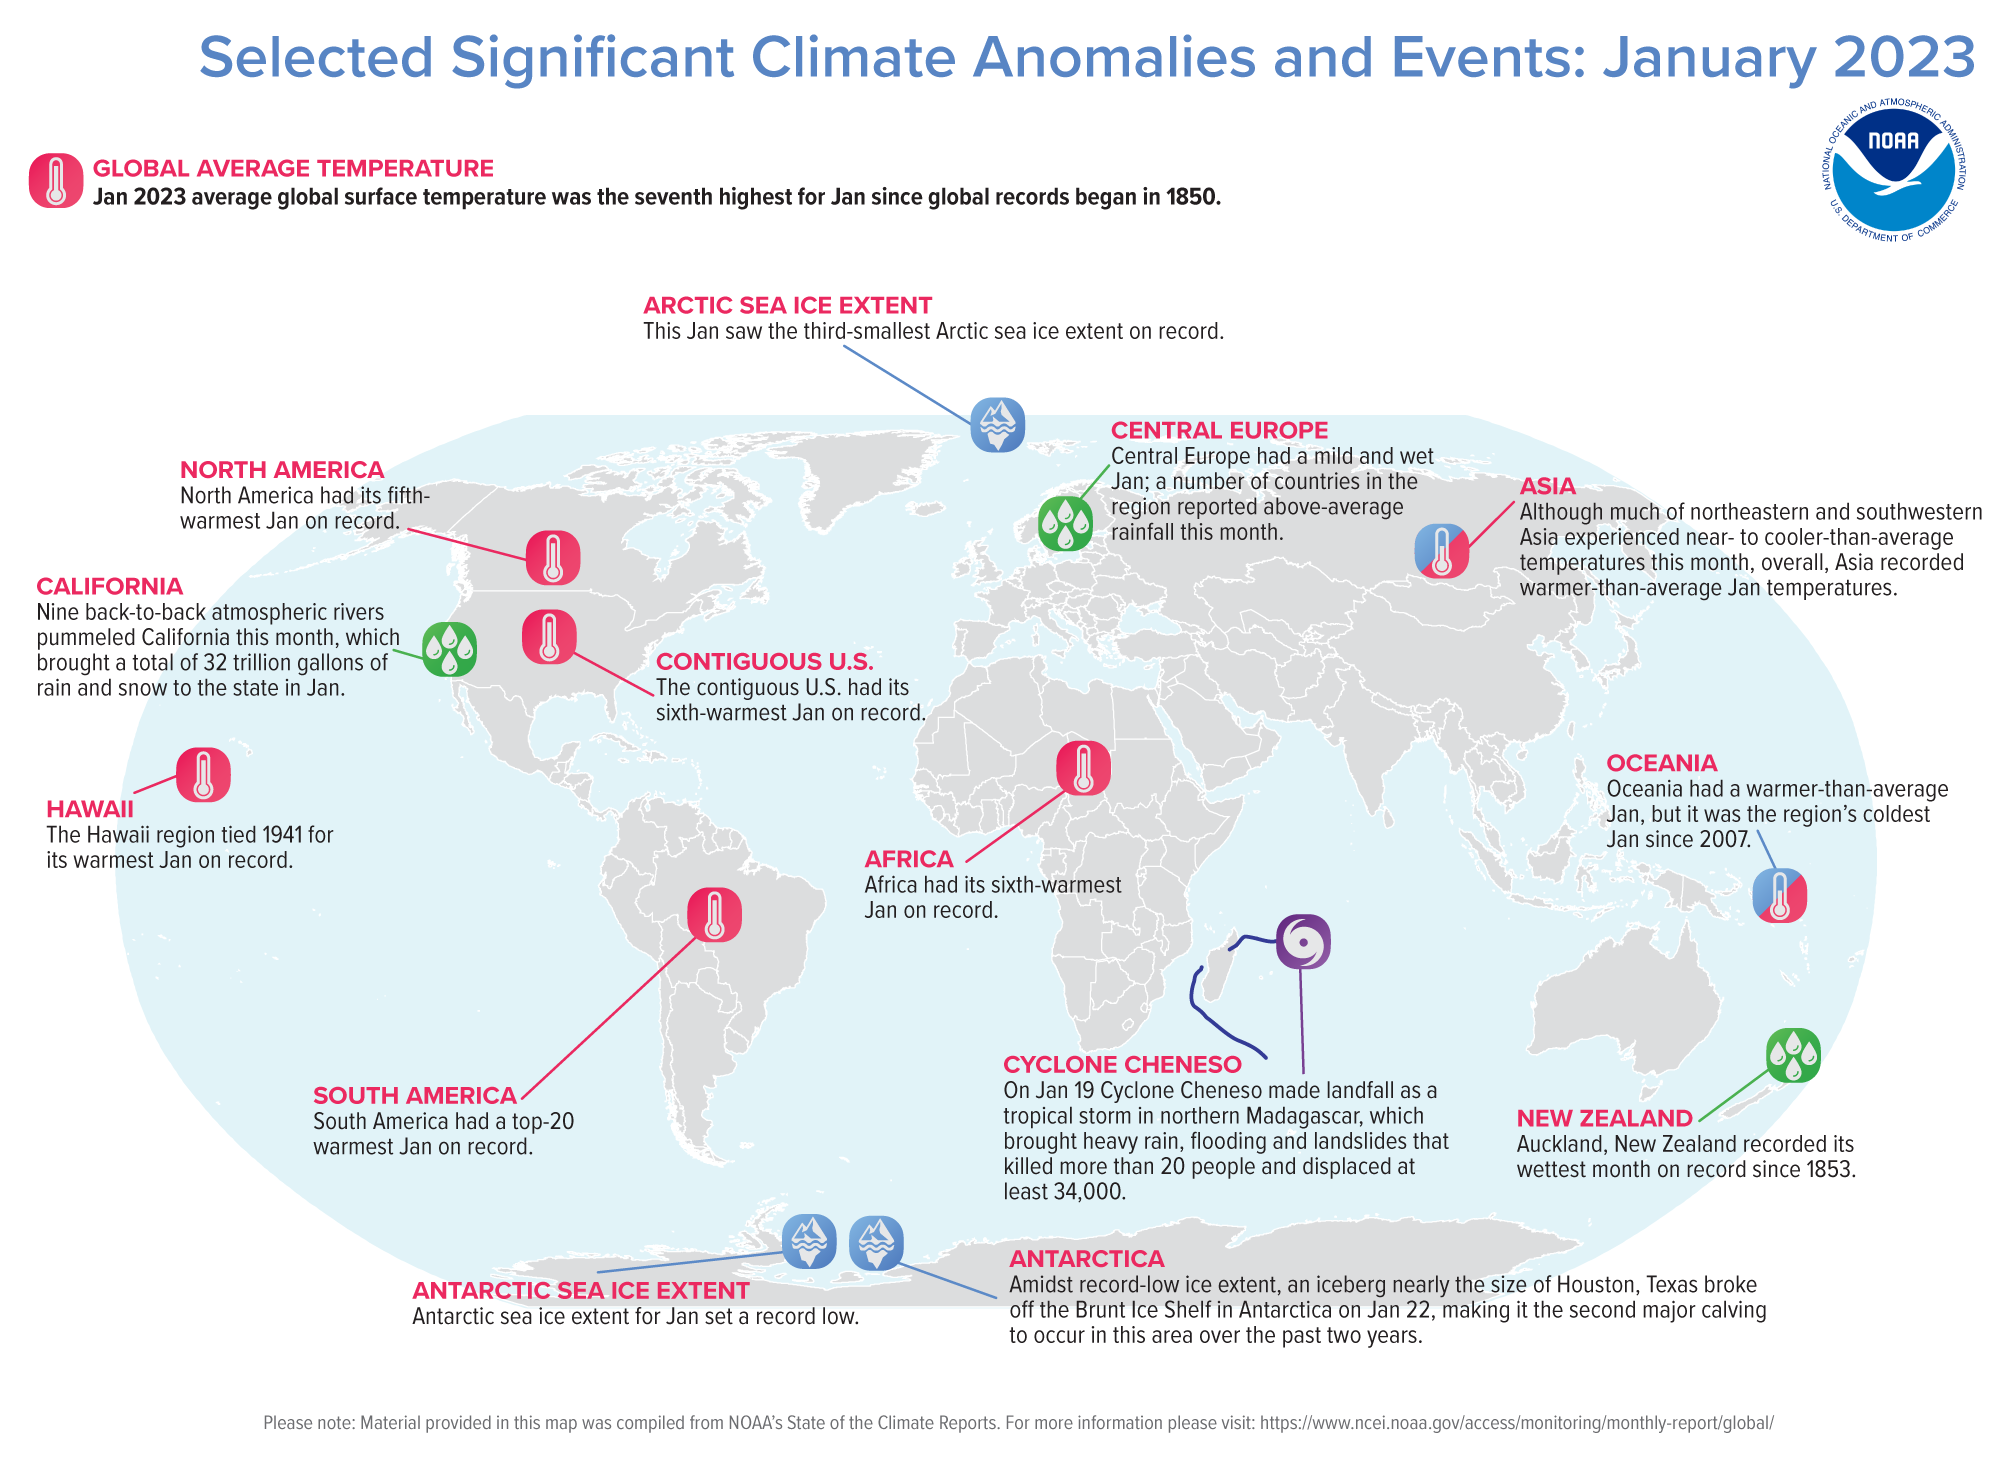
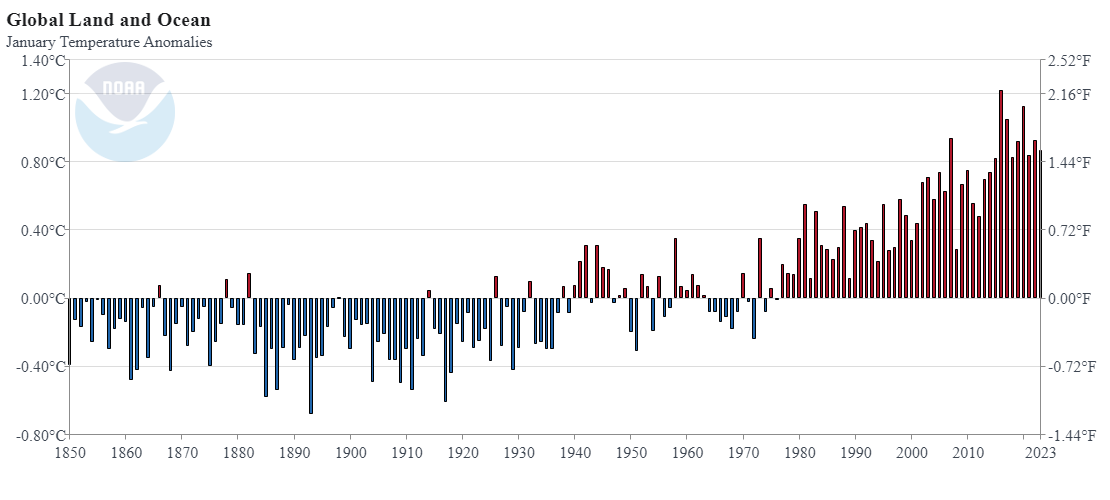
January 2023 was the seventh-warmest January for the globe in NOAA's 174-year record. The January global surface temperature was 1.57°F (0.87°C) above the 20th-century average of 53.6°F (12.0°C). January 2023 marked the 47th consecutive January and the 527th consecutive month with global temperatures, at least nominally, above the 20th-century average.
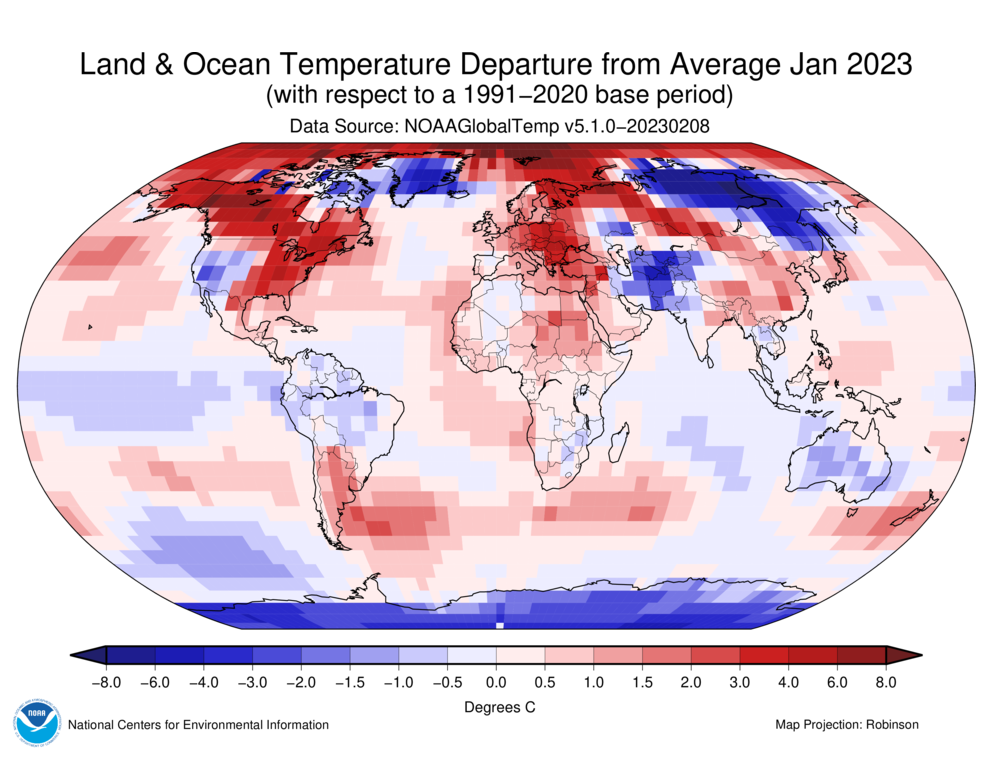
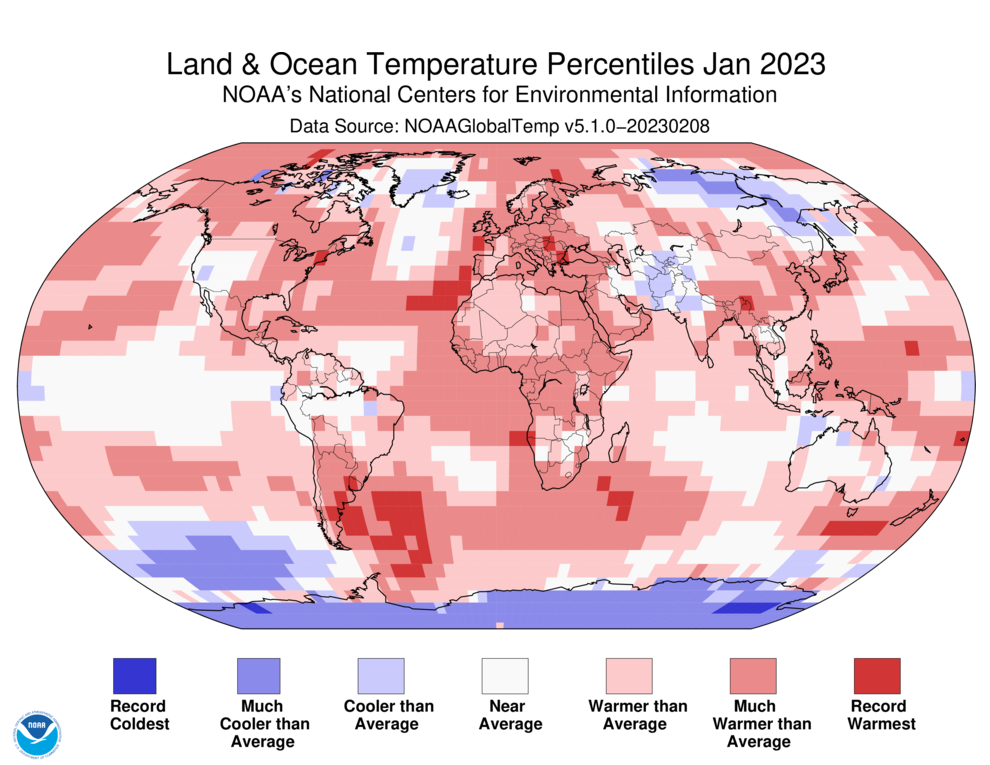
Warmer-than-average conditions were observed across most of Europe and the Arctic, much of Africa and northern and eastern North America, and across parts of southern South America and northwestern, central, and southeastern Asia. Sea surface temperatures were above average across much of the northern, western and southwestern Pacific and the Atlantic. Parts of southern South America, the southern and eastern central Atlantic, central Europe, and the southern Indian Ocean experienced record-warm temperatures this month. Overall, record warm temperatures covered nearly 4% of the world's surface this month.
Temperatures were near- to cooler-than-average throughout much of Oceania, Antarctica, and Greenland, as well as across parts of northeastern and southwestern Asia, southwestern North America, and northern and central South America. Sea surface temperatures were below average over much of the south-central, central, and eastern tropical Pacific and much of the central and southeastern Indian Ocean. Less than 0.6% of the world's surface experienced a record-cold January this month.
January 2023 in the Northern Hemisphere ranked fifth warmest on record at 1.28°C (2.30°F) above average. Northern Hemisphere ocean temperatures ranked third warmest (tied with 2022) for January, while land-only temperatures ranked sixth warmest. Following a similar pattern, ocean temperatures in the Southern Hemisphere ranked eighth warmest on record, while land-only temperatures in the southern hemisphere were 0.03°C (0.05°F) cooler than average. Combined, the Southern Hemisphere surface temperature this month ranked 22nd warmest on record (tied with 1977 and 2011).
A smoothed map of blended land and sea surface temperature anomalies is also available.
This January, Europe had an unusually mild month that set a record for the warmest January on record. Europe's surface temperature exceeded the previous January record set in 2007 by 0.16°C (0.28°F).
- January in Austria was 4.0°C above average in the lowlands and 1.6°C above average in the mountains.
- In the Netherlands , January 2023 was 1.2°C above average according to measurements at De Bilt Observatory.
- Belgium recorded a temperature this month that was 1.5°C warmer than the long-term average.
- Latvia, in addition to experiencing its 3rd-wettest January this month, recorded an average temperature 2.4°C above the long-term average.
- January in Estonia followed a similar wet and warm pattern this month to its southern neighbor. Rainfall was 137% of the average, while temperatures were 2.0°C above the long-term average.
- Across the Baltic Sea, Denmark followed a similar pattern. Average temperature this January in Denmark was ninth warmest on record at 2.2°C above the climate normal. It was also the wettest January ever recorded since records began in 1874.
- January 2023 in Norway was 1.2°C above average.
- Italy ranked 11th warmest on record for January at 0.96°C above average.
- Mean temperatures across the United Kingdom, for January were slightly above average at 0.4°C above the 1991-2020 average for the month.
- In Ireland, all mean air temperatures across the country were above their long-term averages for the month, ranging from 0.1°C warmer than average in Cork to 1.3°C warmer than average in Dublin.
North America recorded its fifth-warmest January on record. Africa recorded its sixth-warmest January.
- The Hawaiian region tied a 1941 record for its warmest January on record.
- The contiguous U.S. had its sixth-warmest January on record. Seven states in the northeastern U.S.—New Hampshire, Vermont, Massachusetts, Rhode Island, Connecticut, New Jersey and Maine—had their warmest January on record.
Although both Oceania and Asia experienced a warmer-than-average January, it did not rank among either of their top 20 warmest on record.
- January 2023 was overall warmer than average in Hong Kong at 0.5°C above average.
- Pakistan reported a January temperature that was 1.25°C below average.
- New Zealand recorded its 10th-warmest January on record with a temperature 1.2°C above the 1991-2020 January average.
- Meanwhile, Australia, while 35% wetter than average, had a January temperature equal to the long term average for the month.
| January | Anomaly | Rank (out of 174 years) | Records | ||||
|---|---|---|---|---|---|---|---|
| °C | °F | Year(s) | °C | °F | |||
| Global | |||||||
| Land | +1.35 | +2.43 | Warmest | 9th | 2016 | +2.00 | +3.60 |
| Coolest | 166th | 1893 | -1.73 | -3.11 | |||
| Ocean | +0.65 | +1.17 | Warmest | 6th | 2016 | +0.87 | +1.57 |
| Coolest | 169th | 1917 | -0.56 | -1.01 | |||
| Land and Ocean | +0.87 | +1.57 | Warmest | 7th | 2016 | +1.22 | +2.20 |
| Coolest | 168th | 1893 | -0.68 | -1.22 | |||
| Northern Hemisphere | |||||||
| Land | +1.96 | +3.53 | Warmest | 6th | 2016 | +2.54 | +4.57 |
| Coolest | 169th | 1893 | -2.34 | -4.21 | |||
| Ocean | +0.77 | +1.39 | Warmest | 3rd | 2016 | +0.99 | +1.78 |
| Coolest | 172nd | 1917 | -0.54 | -0.97 | |||
| Ties: 2022 | |||||||
| Land and Ocean | +1.28 | +2.30 | Warmest | 5th | 2016 | +1.66 | +2.99 |
| Coolest | 170th | 1893 | -1.22 | -2.20 | |||
| Southern Hemisphere | |||||||
| Land | -0.03 | -0.05 | Warmest | 71st | 2013 | +1.21 | +2.18 |
| Coolest | 104th | 1918 | -0.75 | -1.35 | |||
| Ties: 1954, 1960 | |||||||
| Ocean | +0.56 | +1.01 | Warmest | 8th | 2016 | +0.79 | +1.42 |
| Coolest | 167th | 1917 | -0.57 | -1.03 | |||
| Land and Ocean | +0.45 | +0.81 | Warmest | 22nd | 2016 | +0.79 | +1.42 |
| Coolest | 153rd | 1917 | -0.58 | -1.04 | |||
| Ties: 1977, 2011 | |||||||
| Arctic | |||||||
| Land and Ocean | +2.36 | +4.25 | Warmest | 15th | 2016 | +5.10 | +9.18 |
| Coolest | 160th | 1966 | -3.17 | -5.71 | |||
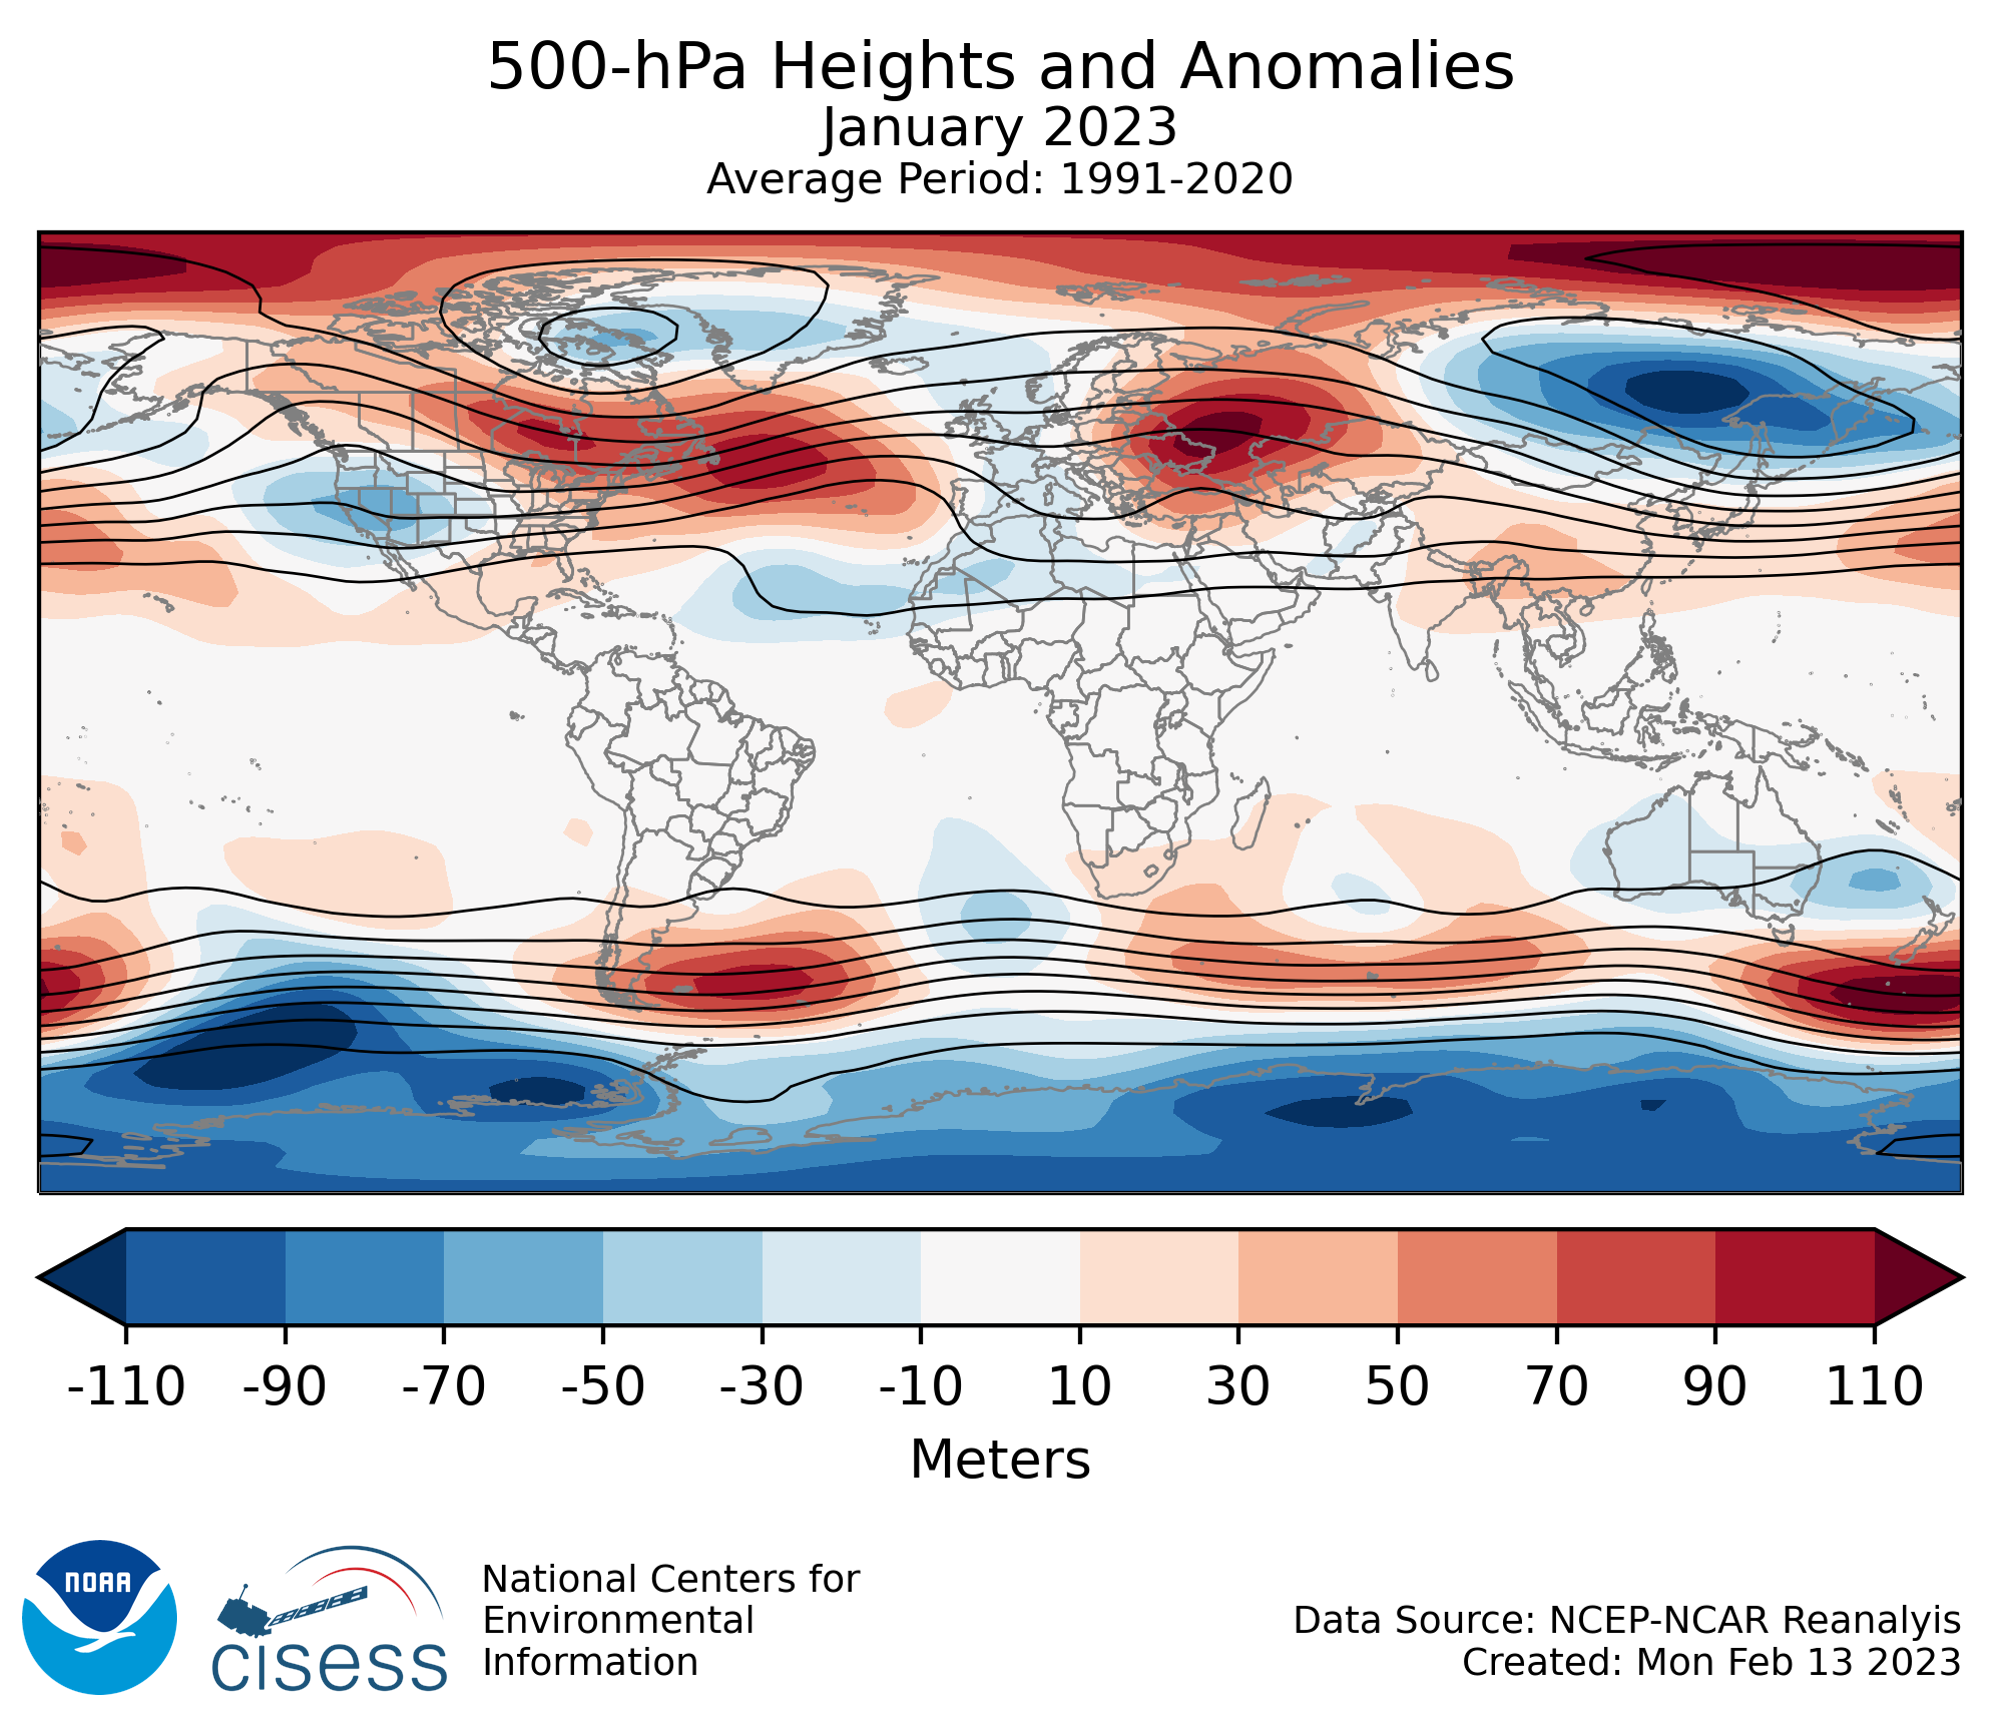
500 mb maps
In the atmosphere, 500-millibar height pressure anomalies correlate well with temperatures at the Earth's surface. The average position of the upper-level ridges of high pressure and troughs of low pressure—depicted by positive and negative 500-millibar height anomalies on the map—is generally reflected by areas of positive and negative temperature anomalies at the surface, respectively.
Precipitation
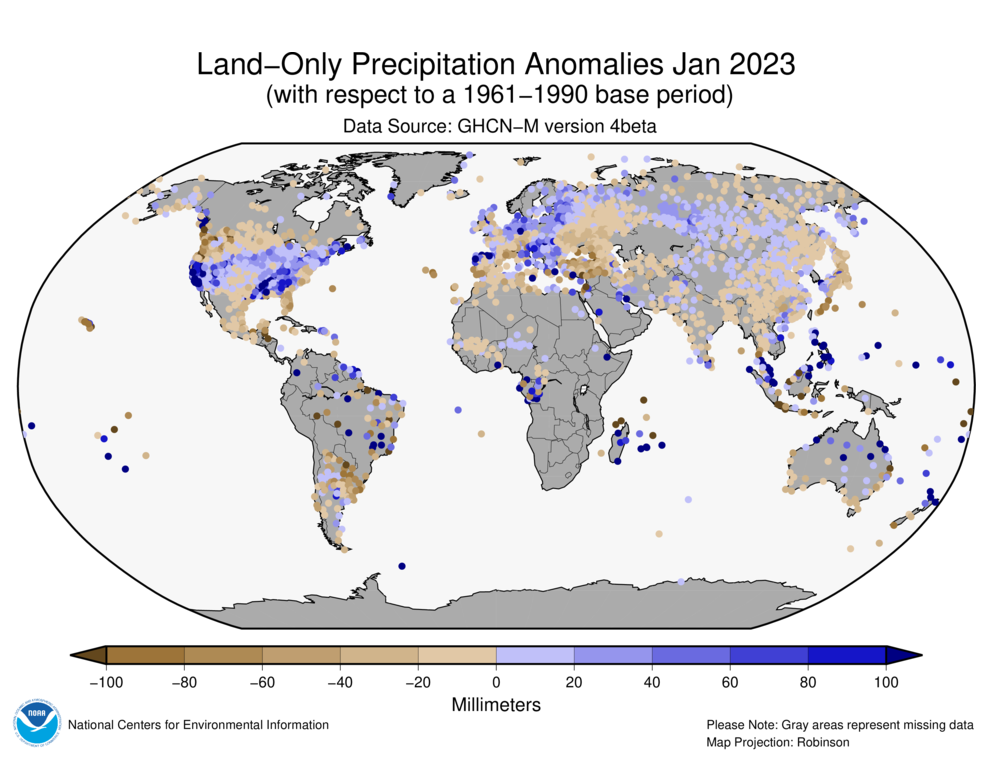
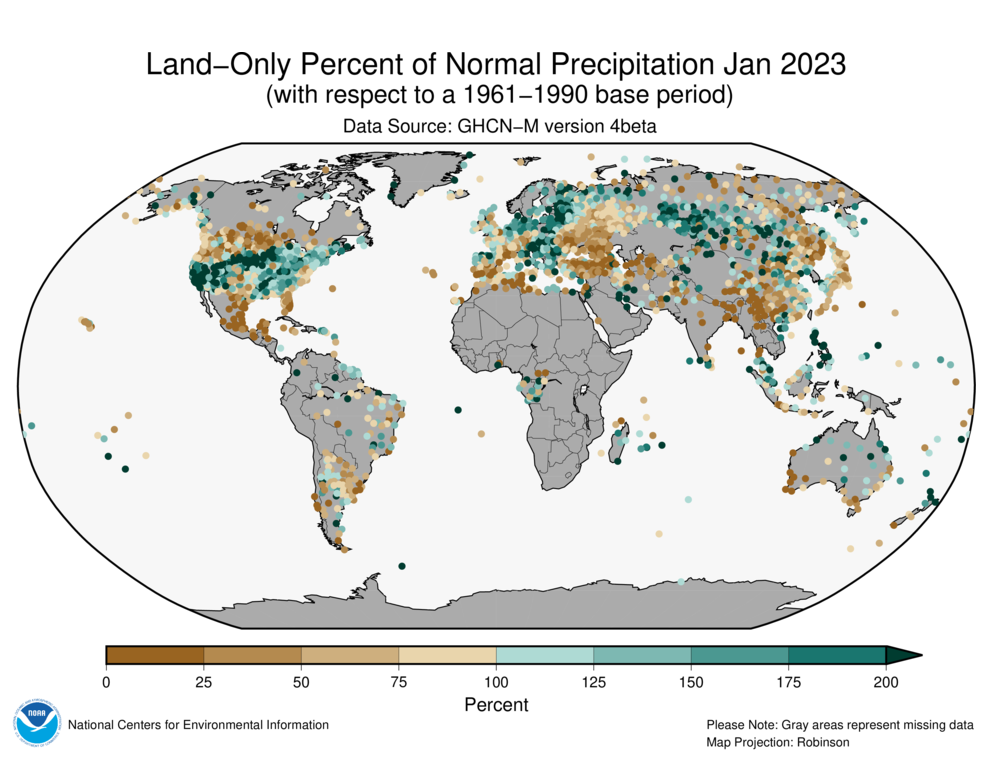
The maps shown below represent precipitation percent of normal (left, using a base period of 1961–1990) and precipitation percentiles (right, using the period of record) based on the GHCN dataset of land surface stations.
January 2023
Above-average January precipitation was observed across parts of northeastern and inland eastern U.S., the central and southern coast of the western U.S., eastern Europe, central Asia and eastern Oceania. Auckland, New Zealand recorded its wettest month on record since 1853. In the U.S., nine back-to-back atmospheric rivers pummeled California with heavy rain and snow, which brought a total of 32 trillion gallons of precipitation to the state this January. Meanwhile, drier-than-average conditions were present throughout much of Mexico, from the U.S. Pacific Northwest to southern Canada, and across parts of eastern, southern and western Asia.
Global Precipitation Climatology Project (GPCP)
The following analysis is based upon the Global Precipitation Climatology Project (GPCP) Interim Climate Data Record. It is provided courtesy of the GPCP Principal Investigator team at the University of Maryland.
January Highlights:
- Although seemingly weakening, the ongoing La Niña continued to strongly affect tropical precipitation patterns from Asia and Australia to South America.
- Floods in Saudi Arabia, New Zealand and Madagascar were easily linked to significant monthly wet anomalies.
- Atmospheric Rivers (ARs) and cyclones again this month eliminated the typical La Niña precipitation pattern in western North America, and were associated with California floods, heavy snows in the Sierras and additional drought relief in the western U.S.
- Warm temperatures and lack of snow were evident in the eastern U.S. and western Europe.
January is at the center of Northern Hemisphere (NH) winter and Southern Hemisphere (NH) summer, and its monthly precipitation features are pushed far to the south (see top panel in left figure), with the narrow intertropical convergence zone (ITCZ) across the central and eastern Pacific Ocean barely staying to the north of the Equator. The South Pacific Convergence Zone (SPCZ) extended southeastward from the Maritime Continent into mid-ocean, and in the Indian Ocean most rainfall is south of the Equator. Over Africa, Australasia and South America, the seasonal rain also shifted far to the south. At higher latitudes, the precipitation patterns also seasonally shifted southward and brought mid-latitude cyclonic systems to lower latitudes over North America and Europe.
In addition to these seasonal shifts, large-scale climate variations related to inter-annual-scale changes such as El Niño-Southern Oscillation (ENSO) combined with weather-scale events during the month to achieve the monthly total map, which at first glance always looks similar to the monthly climatology. However, relatively small differences are often related to drought, floods and other noticeable differences. For this January, the anomalies (from the January climatology) seen in the figure to the left (middle and bottom panels) still reflect the ongoing La Niña, at least across most of the tropics. The continuing relatively low Sea Surface Temperatures (SST) over the central-eastern Pacific along the Equator defining the current La Niña conditions have moderated somewhat, indicating a weakening La Niña circulation and perhaps a change in the distribution of rainfall anomalies this month. The La Niña is generally forecast to continue weakening over the next few months, so the stranglehold of this phenomenon on the global distribution of precipitation may change. The figure below to the right (top panel) is a composite anomaly map for La Niña Januarys during the GPCP period (1979-2021), while the bottom panel of the figure is a repeat of the precipitation anomaly map for this past month.
Across the tropics, at least from the Maritime Continent and Australia eastward across the tropical Pacific and through the northern half of South America, it is clear that the La Niña composite was strongly positively correlated with current January anomaly map—the La Niña was the dominating force driving the circulation pattern and the resulting rainfall anomalies. As in the composite, a strong negative or dry anomaly was centered on the Equator near and surrounding 180° longitude. The negative feature stretched to the east along the ITCZ in both maps, with an extension to the southeast, indicating a westward shift to the SPCZ.
To the west, an area of highly variable, but generally positive anomalies, was present over the Maritime Continent and surrounding areas, and across Australia and to the east to the westward shift of the SPCZ. The strong positive "blotches" across this area had much higher anomaly values (> 4 mm/d) as compared to the composite. These higher values reflect the superposition of weather-scale events onto the general La Niña circulation. One of these weather-scale events was Tropical Storm Ellie, which hit northwestern Australia early in the month. Near continuous non-cyclone tropical systems came across the Philippine Islands during the month, and caused severe flooding, landslides, and 38 deaths. Northern Sumatra and Indonesia also experienced heavy rains and floods. To the east of Australia, multiple wet features were evident in the westward-shifted SPCZ, with one extending southward to cover the North Island of New Zealand. In late January, more than 250 mm hit the city of Auckland one day, causing severe flooding and even canceling an Elton John concert.
Extending east and west from this central La Niña territory, northern South America for this January resembled the composite. The rest of the continent did not; heavy rains in southern Brazil did not match the La Niña model. To the west over the Indian Ocean, there was also a weak or non-existent match, but Tropical Cyclone Cheneso hit Madagascar after a trek across the South Indian Ocean, where it caused landslides and flooding, and later flooding in Zambia, that may have a La Niña connection.
Moving northeast of Africa, a close scrutiny of the figure to the left above (top panel) shows a relatively weak monthly precipitation feature surrounding the Persian Gulf, which shows as a positive anomaly (middle panel) covering essentially all of the Arabian Peninsula. This shows up even stronger in the percentage anomaly map (bottom panel). This area, a sub-tropical desert peninsula, experienced significant rain (more than 200m) during a short period early in the month which produced unusual flooding in Riyadh and other areas.
For North America, the La Niña composite (figure right and above, top panel) indicates that drier-than-normal conditions should have been expected over much of the U.S. and Mexico, but the observed pattern (bottom panel) this month (and December) deviated strongly from that expectation. While Mexico and the south-central U.S. were drier, to the north a feature of above-normal precipitation was evident from off the central west coast of the U.S., across most of the country, with a band of below-average precipitation across Canada, and a "wet" band across Alaska. The positive anomaly was associated with Atmospheric Rivers (ARs) and cyclonic storms hitting northern California and surrounding areas with very heavy precipitation events primarily in the first half of the month and producing floods over large areas and tremendous snowfall in the Sierra Nevada Mountains. Snowfall in the Rocky Mountains was also affected positively. These rains at lower elevations and substantial snowpack buildup at higher elevations should ameliorate drought conditions in the short-term, although long-term impact is more open to question. In the eastern U.S, overall precipitation was near normal, but there was an obvious lack of snow, due to above-average temperatures.
Western Europe was also relatively dry and warm, which added to their general drought conditions and, as in the eastern U.S., a lack of snow. To the north and east, Scandinavia was relatively wet and that feature extended into central Asia, while southern Asia was typically dry, as expected in this season.
Drought in January 2023
Drought information is based on global drought indicators available at the Global Drought Information System website, and media reports summarized by the National Drought Mitigation Center.
January Highlights: Beneficial precipitation fell across parts of the drought areas in Europe and the Americas during January 2023, but the month was drier than normal over other parts of the drought-plagued agricultural lands of North America as well as parts of Africa and Asia. Much of the world's agricultural lands were still suffering from low soil moisture and groundwater levels, with evaporative stress high for this time of year in areas of the lower latitudes and Southern Hemisphere. The afflicted areas include the Canadian Prairies, Great Plains of the United States, Brazil and Argentina in South America, Western Europe, eastern China, and northern and East Africa. Like the last three months, of the continents, Australia seems to be in the best shape.
Much of Europe was warmer and wetter than normal during January 2023, with the month ranking as the warmest January continent-wide in the 114-year NCEI record. The last 3 months have been generally near or wetter than normal with the European Combined Drought Indicator showing drought only locally in southern and eastern parts of the continent. But longer-term dryness remains, as the Standardized Precipitation Index (SPI) shows dry conditions at 6- to 36-month time scales. The excessive heat during much of 2022 has the Standardized Precipitation Evapotranspiration Index (SPEI) showing even more severe dryness at those long-term time scales, especially in southern to central Europe. Satellite-based (GRACE) indicators of groundwater and soil moisture reveal the impacts of drought lingering across much of the continent with low groundwater and soil moisture levels still evident. According to media reports (Reuters), Europe's mild winter and sparse snow cover and rainfall have some concerned that the region will be more susceptible to drought, reduced hydropower generation potential and possible logistical difficulties on key waterways later in the year. This follows from a report by The Independent that groundwater levels in Europe have not risen significantly since the summer months of 2018 and 2019 when a severe water shortage affected Central Europe.
In Asia, parts of southern to eastern China, and parts of western Asia, were drier and warmer than normal during January 2023, while large parts of northern and eastern Siberia were drier than normal. The SPI revealed persistent, widespread, and severe dryness across western to central Asia, from Turkey to the Uzbekistan region, for the last 2 months to 3 years. Unusually warm temperatures during this period caused the SPEI to show even more severe drought over a wider area spanning a longer period (last 2 months to 4 years). Above-normal temperatures over southern Asia to eastern China increased evapotranspiration (as seen in the Evaporative Stress Index, or ESI), which exacerbated the dry conditions in China. The SPI and SPEI reflect drought conditions in parts of southeast to eastern China at the 1- to 6-month time scales. GRACE data revealed widespread low groundwater and soil moisture across much of China and southwest to central Asia. Media reports noted that, in Turkey, water levels on Lake Sapanca have receded to 40 meters, setting off alarms in Sakarya, where the lake is the main drinking water source, and in Kocaeli. The lake, being one of the few lakes in Turkey that provides drinking water to the two big cities, has been affected by drought and increased urbanization.
January was drier than normal across the Atlantic and Mediterranean coasts of Africa (from Sub-Saharan Africa to Egypt) and over central to East Africa. Above-normal temperatures across much of this region increased evapotranspiration and exacerbated the drought conditions. Drought is indicated, especially for East Africa and northwest Africa (the Maghreb region), at 1-month to 4-year time scales by the SPI but more notably by the SPEI. GRACE data reveal that the prolonged drought has taken its toll on groundwater and soil moisture levels, which are very low across these regions and in central Africa. The satellite-based Vegetation Health Index (VHI) shows poor vegetative health in East Africa and northwest coastal Africa. According to media reports (Reuters), "Three years of drought have dried up Tunisian reservoirs, threatening harvests that are critical to the North African country's battered economy and pushing the government to raise tap water prices for homes and businesses. Since September only 110 million cubic meters of rain fell in Tunisia, about a fifth of the normal rate, and officials in the farmers union and the main trade union warn that grain crops will suffer - adding to existing problems of food supply. Dams are only at 25% of their capacity and some dams have only 10%. As climate change has accelerated, bringing blistering heat across the Mediterranean region in recent summers, winter rains have repeatedly diminished in North Africa, causing problems for agriculture from Morocco to Tunisia." The New York Times noted that, in Tunisia, the old life of pressing olives and herding sheep is faltering in the face of relentless drought. AfricaNews noted that, in the Horn of Africa, Ethiopia, Somalia and Kenya are enduring the worst drought in four decades as rainy seasons have failed since 2020. Nomadic herders no longer have their livestock and would face starvation if it were not for humanitarian aid.
Low soil moisture is evident in some parts of southwest and eastern Australia, as seen in GRACE data and on Australian Bureau of Meteorology analyses; the GRACE data show low groundwater levels in western Australia; and VHI data indicate some stressed vegetation in some areas. Longer time scale (12-month and longer) SPI and SPEI indicators, and the Australian Combined Drought Indicator analyses, reveal some dryness in parts of northern Australia. But with much of Australia cooler and wetter than normal during January and the last several months, drought is not an issue on the continent.
Much of the northern half of South America, and parts of Argentina, received above-normal precipitation during January, but extreme southern South America and central areas continued drier than normal. January temperatures were above normal, enhancing evapotranspiration across much of the continent. The most extreme short-term (1- to 3-month) dryness, as seen on the SPI and SPEI indicators, occurred across extreme southern Argentina, parts of Chile, and from northern Argentina and southern Brazil to Peru and western Brazil. Dryness in these areas extended to longer time scales, especially from the last 1 to 3 years. GRACE data revealed low groundwater and soil moisture and VHI data indicated stressed vegetation. Drought in southern and western Brazil was confirmed on the Brazilian Drought Monitor. According to media reports (MercoPress): "More than 60% of the Uruguayan territory is suffering from extreme or severe drought in the last three months, October 2022-January 2023, according to the Uruguayan Meteorological Institute, Inumet. Inumet reported this week that 'the whole of Uruguay's territory is under conditions of drought, in the period extending from 11 October to 10 January.'" The drought in Uruguay has affected farming production, leading to about $1.17 billion in losses or 1.9 per cent of the country's GDP, the Agriculture Ministry said. A more detailed analysis showed agriculture suffered losses of $490 million, livestock $440 million, and dairy $100 million, according to Xinhua news agency. The Buenos Aires Times reported that Argentina has lost half of its seasonal soybean harvest in the main production area, the 'pampa humeda' in the center of the country, due to drought, per the Rosario Stock Exchange. The country has faced three straight years of drought. Further north, the Amazon rainforest is being affected by drought and human activities. According to CNN: "The Amazon rainforest is nearing a critical tipping point as forest fires, habitat fragmentation in the interface between deforested areas and forest, logging, and extreme drought cause more damage to the Amazon rainforest. Amazon degradation, where the forest becomes damaged and weakened, lowering its ability to store carbon and support nature, is affecting up to 38% of remaining rainforest. This 38% of the rainforest has already been damaged by human activity and drought."
In North America, several "atmospheric river" events dumped copious amounts of Pacific moisture across large parts of the western U.S. during January, with above-normal precipitation stretching from the U.S. West Coast to the Great Lakes. Cold fronts and low-pressure systems also spread above-normal precipitation from the Gulf of Mexico coast to the U.S. Northeast, as well as over Alaska. Outside of these storm tracks, much of Canada and Mexico, as well as the northwestern U.S., were drier than normal during January. The wet areas of the western U.S. were near to cooler than normal for the month, but the rest of the continent was much warmer than normal, with January 2023 ranking as the fifth warmest January, continent-wide, in the 114-year NCEI record. The ESI indicator showed above-normal evapotranspiration over much of Mexico, as well as the southeastern and northeastern U.S. and adjacent parts of Canada, although this is the heart of winter in the Northern Hemisphere when evapotranspiration is normally low. The heavy rain and snow of the last 3 months have improved moisture conditions over the western U.S., but long-term dryness is still indicated by the SPI and SPEI indicators for the last 2 to 6 years. These indicators show dryness across the U.S. Great Plains at the 6- to 36-month time scales, across Mexico (especially northern portions) at the 1- to 3-month and 1- to 5-year time scales, across much of Canada (especially southern and central portions) at the 1- to 6-month time scales, across western Canada at 9 to 24 months, and over the southern Canadian Prairies at 3 to 6 years. GRACE data revealed low groundwater and soil moisture levels over northern Mexico, from the southern Plains to Pacific Northwest in the U.S., and extending across western to central Canada. The North American Drought Monitor product depicted drought across much of western Canada, most of the central to western U.S., the southern Great Lakes, the U.S. coastal Southeast, and much of northern to central Mexico.
References
- Adler, R., G. Gu, M. Sapiano, J. Wang, G. Huffman 2017. Global Precipitation: Means, Variations and Trends During the Satellite Era (1979-2014). Surveys in Geophysics 38: 679-699, doi:10.1007/s10712-017-9416-4
- Adler, R., M. Sapiano, G. Huffman, J. Wang, G. Gu, D. Bolvin, L. Chiu, U. Schneider, A. Becker, E. Nelkin, P. Xie, R. Ferraro, D. Shin, 2018. The Global Precipitation Climatology Project (GPCP) Monthly Analysis (New Version 2.3) and a Review of 2017 Global Precipitation. Atmosphere. 9(4), 138; doi:10.3390/atmos9040138
- Gu, G., and R. Adler, 2022. Observed Variability and Trends in Global Precipitation During 1979-2020. Climate Dynamics, doi:10.1007/s00382-022-06567-9
- Huang, B., Peter W. Thorne, et. al, 2017: Extended Reconstructed Sea Surface Temperature version 5 (ERSSTv5), Upgrades, validations, and intercomparisons. J. Climate, doi: 10.1175/JCLI-D-16-0836.1
- Huang, B., V.F. Banzon, E. Freeman, J. Lawrimore, W. Liu, T.C. Peterson, T.M. Smith, P.W. Thorne, S.D. Woodruff, and H-M. Zhang, 2016: Extended Reconstructed Sea Surface Temperature Version 4 (ERSST.v4). Part I: Upgrades and Intercomparisons. J. Climate, 28, 911-930, doi:10.1175/JCLI-D-14-00006.1.
- Menne, M. J., C. N. Williams, B.E. Gleason, J. J Rennie, and J. H. Lawrimore, 2018: The Global Historical Climatology Network Monthly Temperature Dataset, Version 4. J. Climate, in press. https://doi.org/10.1175/JCLI-D-18-0094.1.
- Peterson, T.C. and R.S. Vose, 1997: An Overview of the Global Historical Climatology Network Database. Bull. Amer. Meteorol. Soc., 78, 2837-2849.
- Vose, R., B. Huang, X. Yin, D. Arndt, D. R. Easterling, J. H. Lawrimore, M. J. Menne, A. Sanchez-Lugo, and H. M. Zhang, 2021. Implementing Full Spatial Coverage in NOAA's Global Temperature Analysis. Geophysical Research Letters 48(10), e2020GL090873; doi:10.1029/2020gl090873.
 NOAA's National Centers for Environmental Information
