
| In the United States,
severe to exceptional drought characterized conditions throughout
much of the Intermountain West, with the worst-affected areas in
parts of eastern Idaho, eastern Wyoming and adjacent areas of
Montana. |

Larger Image
|
For comprehensive drought analysis, please see the current
U.S.
drought report.

Larger Image
|
The drought conditions
throughout much of the western U.S. enhanced wildfire potential,
with several large fires scattered across the region during July
and August. |
For comprehensive analysis on the western and Alaska wildfires,
see the August 2004
wildfire pages.
| The March-May rainy
season was shorter and drier than normal across parts of the
Greater Horn of Africa, resulting in a continuation of multi-season
drought in this region. Below average precipitation persisted
through much of the region during the boreal summer 2004. In
Somalia, more than 600,000 people were directly affected by the
current drought and in need of food aid (IRIN). |

Larger Image
|
In Sri Lanka, more than a half-million families were affected by
a severe drought that had damaged crops and left people without
drinking water (Deutsche Presse Agentur).


Larger Image
|
Across South Asia,
millions of residents were displaced by flooding in early August,
with the Indian
states of Assam and Bihar the worst-affected. Throughout India,
Nepal and Bangladesh, around 1,800 deaths were blamed on flooding
brought about by heavy monsoon rains since the beginning of June
2004 (Associated Press/AFP/Reuters). |
In Hungary, flooding at the beginning of August collapsed houses
and forced dozens of people to leave their homes in the eastern
part of the country (Associated Press).
In South Africa, heavy rains produced flooding in Cape Town
around the 9th. At least 15,000 people were affected by the
flooding, with many of those displaced from their homes (DisasterRelief.org).
Heavy rains in the United Kingdom southward into France were
responsible for localized flooding during August 16-19. A landslide
trapped 57 motorists on a road in Scotland, while flash flooding
devastated the tourist village of Boscastle. The rainfall was due
in part to the remnants of Tropical Storm
Bonnie that had affected the United States a week earlier
(Reuters).
For an archive of flood events worldwide, see the
Dartmouth Flood Observatory.

In the United Kingdom, strong thunderstorms swept across London
on the 3rd causing flooding which temporarily closed down sections
of the city's underground train system. One person was killed and
four were injured by lightning (AFP).

| Hurricane Alex developed
off the southeast coast of the United States on July 31, reaching
tropical storm strength by the 1st of August. Alex attained
hurricane status by the 3rd and lashed the North Carolina Outer
Banks as the eye passed just offshore. Winds on Ocracoke Island
gusted as high as 193 km/hr (120 mph), causing significant damage
but no injuries (Associated Press). The storm continued to
strengthen as it tracked away from land areas, and became the
strongest recorded Atlantic hurricane at such a high latitude
(greater than 38 degrees north), with maximum sustained winds on
the 5th of 193 km/hr (105 knots or 120 mph) at 40 degrees north
latitude. |

Click For Animation
|

Larger Image
|
Tropical Depression
Malou
developed in the western Pacific Ocean off the coast of Japan on
the 4th and tracked across the southern part of the country on the
5th before dissipating. Locally heavy rains fell as the depression
moved across the region. |
| Tropical Storm
Bonnie
developed in the southern Gulf of Mexico on the 9th and came ashore
just west of Appalachicola, FL on the 12th. Maximum sustained winds
at the time of landfall were near 85 km/hr (45 knots or 50 mph).
Heavy rain and localized severe weather (including tornadoes)
occurred well inland. |

Larger Image
|

Larger Image
|
Hurricane Charley
developed from a tropical wave that emerged off the African coast
early in the month. The system attained tropical storm status on
the 10th as it passed south of the island of Hispañola.
Charley reached hurricane strength on the 11th, passing south of
the island of Jamaica. The hurricane then tracked across the
western tip of Cuba late on the 12th, crossing over the greater
Havana area with maximum sustained winds near 165 km/hr (90 knots
or 105 mph), or category two
strength on the Saffir-Simpson scale. Significant property
damage exceeding $1 billion (USD) was reported in western Cuba,
with 8,300 houses completely destroyed, and three fatalities in
Havana (BBC News/OCHA). It was the worst hurricane in Cuba since
Michelle in 2001 which caused $1.8 billion (USD) in damage and left
200,000 homeless (Reuters). |
| Charley entered the
southeastern Gulf of Mexico on the 13th, passing the Dry Tortugas
by mid-morning. The hurricane intensified very rapidly just prior
to a Florida landfall as it trekked northeastward into Charlotte
Harbor and came ashore near Mangrove Point in the Port
Charlotte/Punta Gorda area around 20:30 UTC (4:30PM EDT) at
category 4 intensity. At the time of landfall, maximum sustained
winds were near 230 km/hr (125 knots or 145 mph), causing massive
damage to coastal areas and barrier islands in the path of the
storm's eye. |

Click For Animation
|
 Animation Animation
|
Charley continued
northeastward as a hurricane, tracking
directly over the Orlando and Daytona Beach areas during the
evening of the 13th. Winds at the Orlando International Airport
gusted to 169 km/hr or 105 mph, a new record wind gust for the
city. |
In Florida, 25 of the state's 67 counties were declared federal
disaster areas. Tens of thousands of buildings were damaged, 12,000
destroyed and more than 2 million customers were without electrical
services at the conclusion of the storm. The Florida citrus crop
sustained severe damage. It was the strongest hurricane to hit
Florida's west coast since Donna in September 1960, and it was the
strongest hurricane to affect the state of Florida or the United
States coastline since Hurricane Andrew in August 1992. Estimated
insured losses from Charley were $7 billion (USD), while total
economic loss was estimated at nearly $15 billion (USD). Charley
was blamed for 22 deaths in Florida (AFP, CNN, Reuters).
| After emerging off the
east coast of Florida, Charley continued in a northeasterly
direction, reaching the South Carolina coast south of Georgetown
near Cape Romain on the morning of the 14th. Maximum sustained
winds near the time of this landfall were near 120 km/hr (65 knots
or 75 mph). Heavy rainfall and gusty winds spread inland across
eastern North Carolina and Virginia. Charley made a fourth and
final landfall on Long Island as a tropical storm on the morning of
the 15th with maximum sustained winds near 65 km/hr (35 knots or 40
mph). |

Larger Image
|
A table containing rainfall totals from the region affected by
Hurricane Charley is
available.
For additional resources on Hurricane Charley....

Larger Image
|
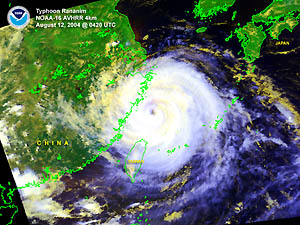
Typhoon Rananim
developed in the Philippine Sea on the 7th and reached typhoon
strength by the 10th. Rananim moved into eastern China's Zhejiang
province on the 12th with maximum sustained winds near 165 km/hr
(90 knots or 105 mph). This was the strongest typhoon to affect
Zhejiang province since 1997, and killed at least 164 people while
injuring 1,800. Rananim also caused an estimated $2.2 billion (USD)
in economic losses (AFP). |
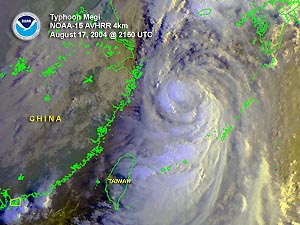
| Typhoon Megi developed in
the western Pacific Ocean on the 14th and tracked through the Korea
Strait on the 18th with maximum sustained winds near 120 km/hr (65
knots or 75 mph). Megi was blamed for 9 flooding deaths in Japan
(AFP). |

Larger Image
|

Larger Image
|
Tropical Storm Earl
developed in the Atlantic Ocean on the 13th and moved through the
Windward Islands near Grenada on the 15th with maximum sustained
winds near 75 km/hr (40 knots or 45 mph). Earl became disorganized
and dissipated in the central Caribbean on the 16th. |
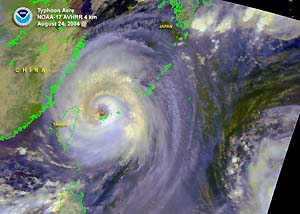
| Typhoon Aere developed in
the eastern Philippine Sea on the 19th, reaching typhoon strength
on the 21st. Aere affected the southern islands of Japan on the
23rd, tracked along the north coast of Taiwan during the 24th-25th
before making landfall in southeast China's Fujian province on the
25th. Maximum sustained winds at the time of landfall in China were
120 km/hr (65 knots or 75 mph). Flooding and landslides were blamed
for more than 40 deaths in Taiwan, the Philippines, Japan and China
(AFP). |

Larger Image
|

Larger Image
|
Typhoon Chaba developed
in the western Pacific Ocean on the 18th, reaching super-typhoon
strength (winds over 240 km/hr or 150 mph) by the 22nd. Chaba
struck Japan on the 30th with maximum sustained winds near 120
km/hr (65 knots or 75 mph). The typhoon was responsible for 13
deaths, flooded 13,000 homes and cut off electricity to more than
340,000 households (AFP). |
| Tropical Storm
Gaston
developed off the southeast coast of the United States on the 27th,
making landfall near McClellanville, South Carolina on the 29th
just under hurricane strength, with maximum sustained winds near
110 km/hr (60 knots or 70 mph). The storm moved northward, and dumped
as much as 330 mm (13 inches) of rainfall on the city of Richmond,
Virginia. This quantity of rainfall caused massive flooding in
the city, and about 20 blocks of the downtown area were declared
uninhabitable on the 31st. There were 7 fatalities in the greater
Richmond area, and Virginia governor Mark Warner declared a state
of emergency (Associated Press/Washington Times). |

Larger Image
|
A table containing the
Accumulated Cyclone Energy (ACE) index for global tropical
cyclones occurring during the month of August 2004 is available.
No reports of significant extratropical cyclones were received
during August 2004.

| Cold weather in
Canada's prairie provinces resulted in widespread frost across
parts of Saskatchewan and Manitoba. It was the earliest widespread
frost since 1992 and produced damage to crops in parts of the
nation's breadbasket (Reuters). |

Larger Image
|
References:
Basist, A., N.C. Grody, T.C. Peterson and C.N. Williams, 1998:
Using the Special Sensor Microwave/Imager to Monitor Land Surface
Temperatures, Wetness, and Snow Cover. Journal of Applied
Meteorology, 37, 888-911.
Peterson, Thomas C. and Russell S. Vose, 1997: An overview of
the Global Historical Climatology Network temperature data base.
Bulletin of the American Meteorological Society,
78, 2837-2849.
|


 NOAA's National Centers for Environmental Information


 Animation


