National Overview:
- Climate Highlights — June
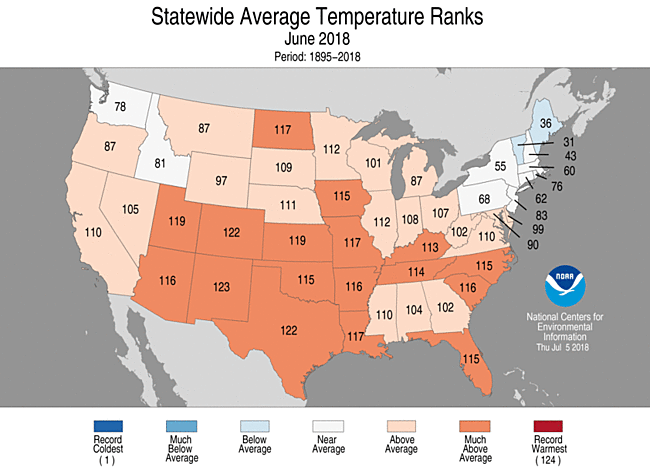
 June Average Temperature Departures |
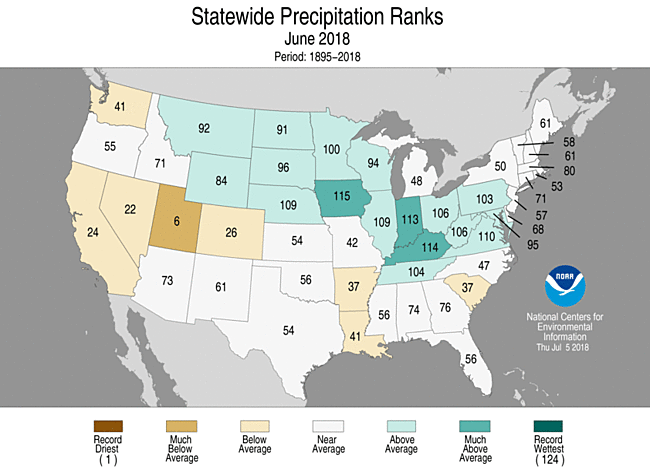
 June Percent of Average Precipitation |
Temperature
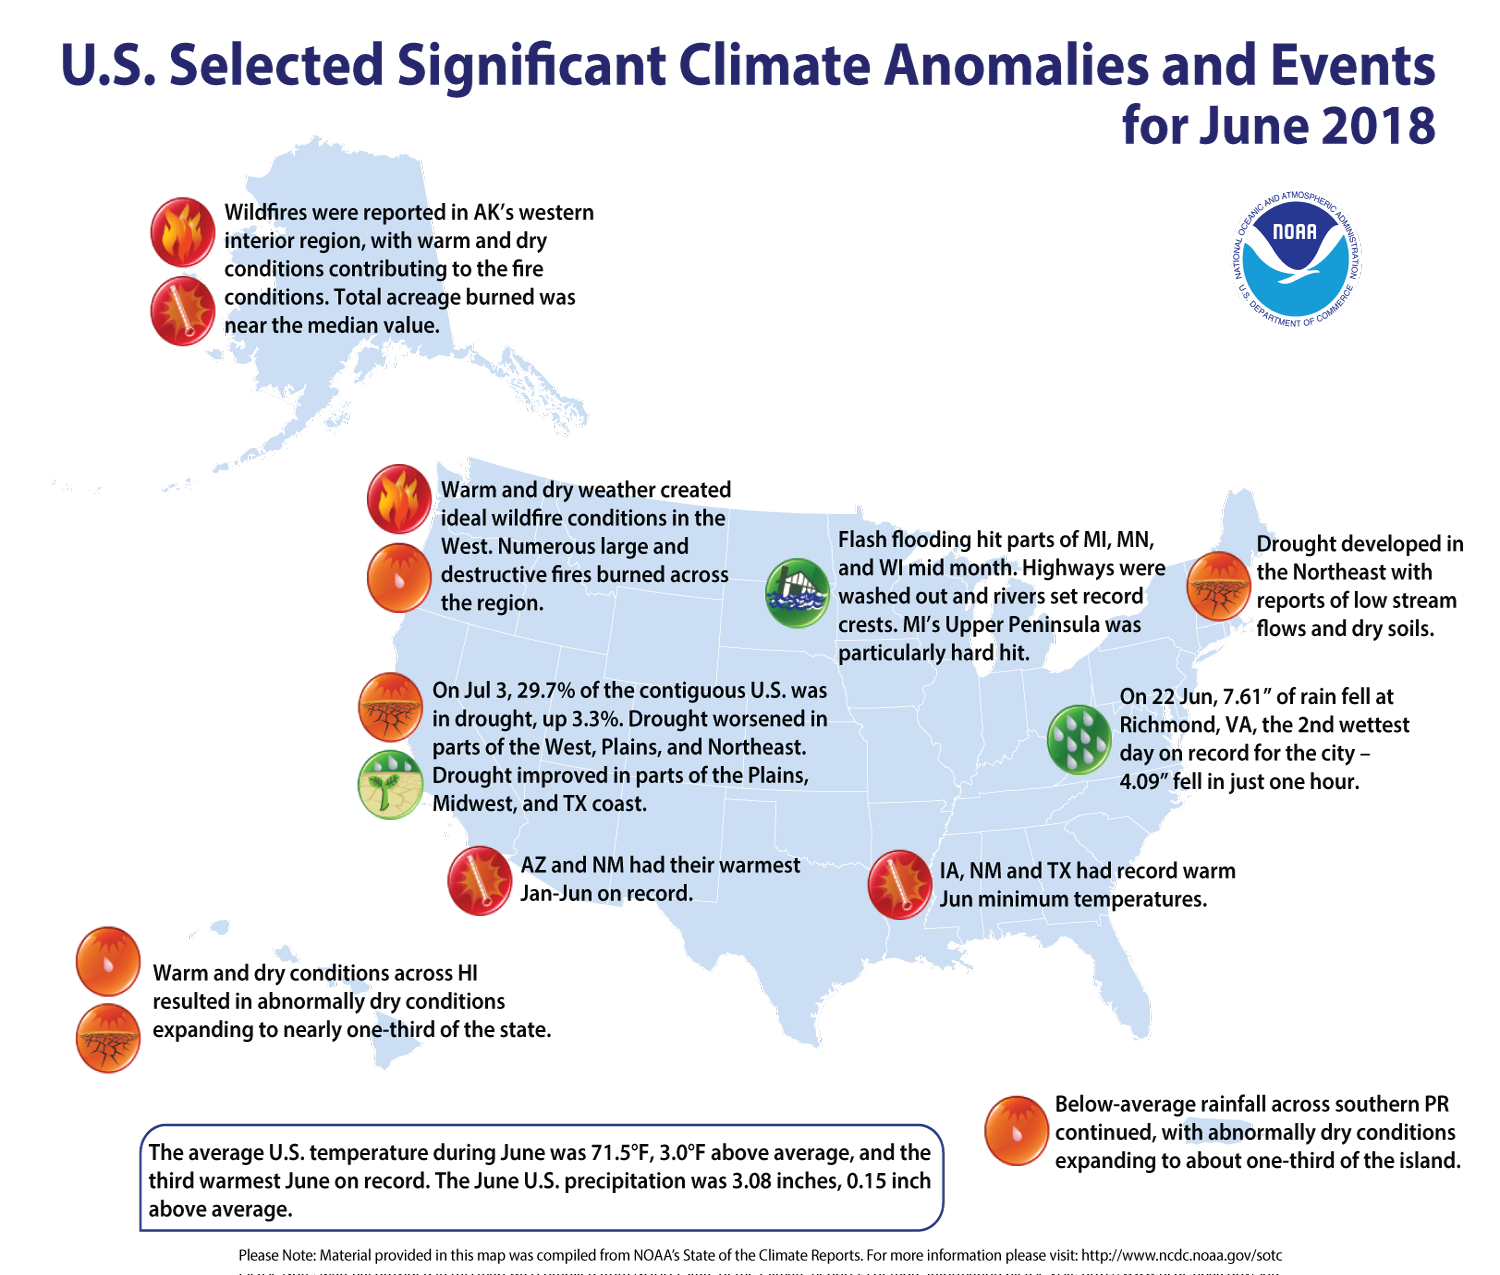
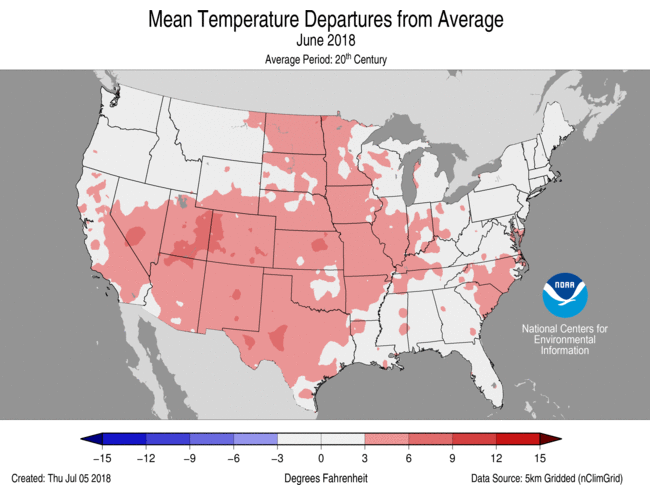
- The June contiguous U.S. temperature was 71.5°F, 3.0°F above the 20th century average. This was the third warmest June on record with only June 1933 and 2016 warmer for the nation.
- Above-average June temperatures were observed for much of the nation. Seventeen states across parts of the Southwest, Great Plains, Midwest and Southeast had a much-above-average temperature.
- Near- to below-average June temperatures were observed across the Northwest and Northeast. In the Northeast, a heatwave that began in late June and persisted into early July was not enough to compensate for below-average temperatures in early- and mid-June.
- The contiguous U.S. average maximum (daytime) temperature during June was 84.1°F, 2.8°F above the 20th century average, marking the 10th warmest value on record. Above-average maximum temperatures spanned the nation with six states in the Southwest and adjacent Plains having much-above-average maximum temperatures. Near- to below-average maximum temperatures were observed in parts of the Northwest, Southeast, and Great Lakes to Northeast.
- The nationally averaged minimum temperature (overnight lows) was exceptionally warm during June at 58.9°F, 3.1°F above average and the second warmest value on record. Only the minimum temperature during June 2015 was warmer. Minimum temperatures were particularly warm across the central and southern United States. Iowa, New Mexico and Texas each had a record warm June minimum temperature. Parts of New England had below-average minimum temperatures.
- During June there were 5,402 record warm daily high (1,742) and low (3,660) temperature records, which was more than five times the 986 record cold daily high (677) and low (309) temperature records. Several of the daily records were noteworthy, including 105°F on June 29 in Denver, Colorado – tying the hottest June temperature ever observed in the city.
- Based on NOAA's Residential Energy Demand Temperature Index (REDTI), the contiguous U.S. temperature-related energy demand during June was 81 percent above average and ranked as the ninth highest value in the 124-year period of record.
Precipitation
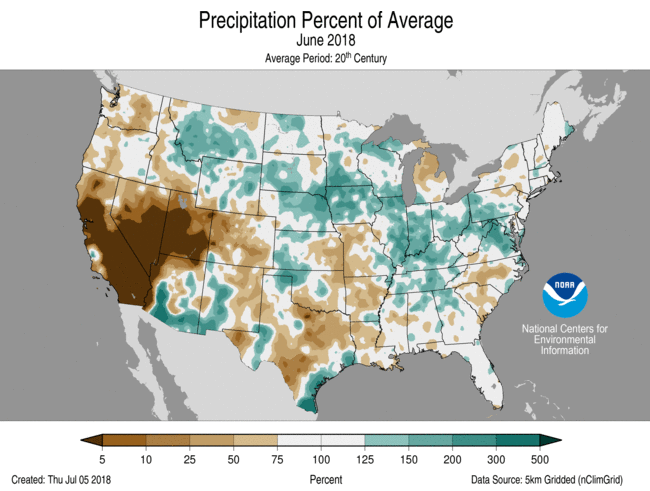
- The June precipitation total for the contiguous U.S. was 3.08 inches, 0.15 inch above average, and ranked near the middle of the 124-year period of record.
- Above-average precipitation was observed in a string of states from the Northern Rockies and Plains, through the Midwest, and into the mid-Atlantic. Indiana, Iowa and Kentucky each had a June precipitation total that was much above average. During June, there were several noteworthy heavy precipitation events that caused significant regional flooding.
- On June 15-17, heavy rainfall caused fatal flash flooding in the Upper Midwest, washing out highways, with record crests along some rivers. One of the hardest hit areas was Houghton County, Michigan, where nearly 7.0 inches of precipitation fell in a short period.
- A slow moving low pressure system, with tropical origins, dropped record-setting rainfall along the southern Texas coast on June 18-21. A report of 11.00 inches or more of precipitation near Premont, Texas, was received by the National Weather Service. The rain gauge reached its capacity of 11.00 inches before overflowing. Widespread flooding was reported during the event.
- On June 22, 7.61 inches of precipitation was observed in Richmond, Virginia, causing flash flooding, power outages and the closure of the Richmond International Airport. This was the second highest daily rainfall total for the city, with a period of record that dates to 1887. Of the total precipitation, 4.09 inches of rain fell in just one hour, a new hourly record for the airport.
- Below-average precipitation was observed across parts of the West, South, Midwest, Southeast, and Northeast during June. Utah tied its sixth driest June on record, receiving just 0.07 inch of precipitation during the month, 0.66 inch below average. Some locations in the Southwest received zero precipitation during June, a frequent occurrence during this time of year.
- According to the July 3 U.S. Drought Monitor report, 29.7 percent of the contiguous U.S. was in drought, up from 26.4 percent at the end of May. Drought conditions worsened in parts of the West, Southern Plains, the Mississippi River Valley and the Northeast. Drought conditions improved for parts of the Great Plains, Midwest and the Texas Gulf Coast. Abnormally dry conditions expanded in Hawaii and Puerto Rico.
- Several large and destructive wildfires burned across the West during June. Warm and dry conditions created ideal conditions. Of note was the County Fire in California which destroyed 20 structures and the Spring Creek Fire in Colorado which is one of the largest wildfires to ever impact the state. These two fires continued to burn into July.
- Climate Highlights — year-to-date (January-June)
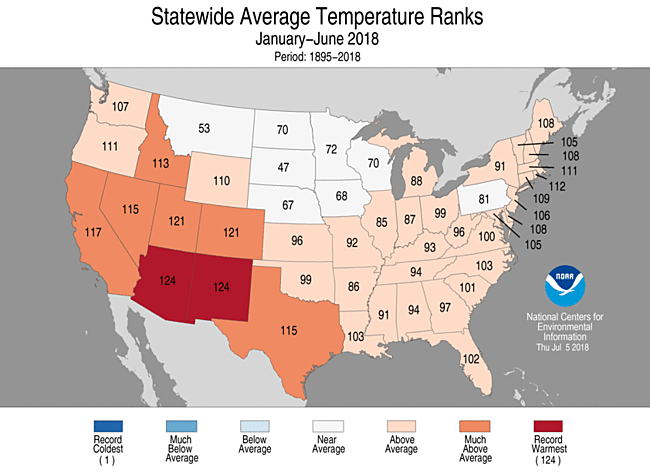
 Jan-June Average Temperature Departures |
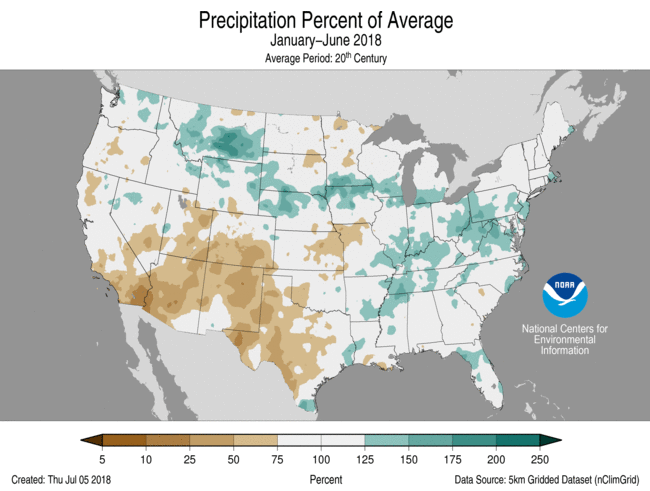 Jan-June Percent of Average Precipitation |
Temperature
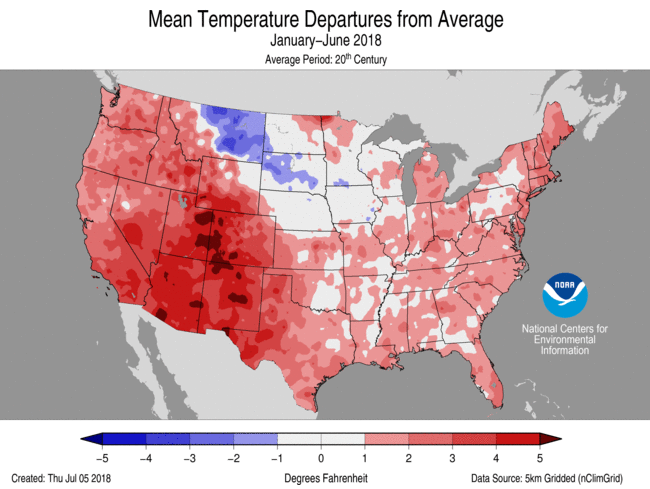
- The first half of 2018 was marked by large month-to-month swings in temperature, but when averaged, the contiguous U.S. temperature was 49.4°F, 1.9°F above the 20th century average, and the 14th warmest January-June on record.
- Above-average January-June temperatures were observed across the West, Southern Plains, East Coast and much of the Midwest. Eight states in the West and South had much-above-average year-to-date temperatures, including Arizona and New Mexico which were record warm. The Arizona statewide average temperature was 59.5°F, 4.3°F above average, and the New Mexico temperature was 53.4°F, 4.1°F above average. Near- to below-average temperatures were observed in the north-central contiguous U.S.
- The Alaska statewide average temperature for the year-to-date was 25.6°F, 4.3°F above average, and tied 2005 as the 10th warmest on record. Above-average temperatures were observed across western and northern areas of the state, with near-average temperatures in southern Alaska.
- The contiguous U.S. average maximum (daytime) temperature during January-June was 61.3°F, 2.0°F above the 20th century average, marking the 14th warmest value on record. Much-above-average maximum temperatures were observed across the Southwest and parts of the Southern Plains where Arizona and New Mexico were record warm. Above-average maximum temperatures were also observed in parts of the Midwest, Mississippi Valley and Gulf Coast. Near- to below-average conditions stretched across the Northern Plains, Great Lakes, and into parts of the Northeast and Southeast.
- The nationally averaged minimum temperature (overnight lows) for January-June was 37.5°F, 1.8°F above average and the 17th warmest value on record. Above-average minimum temperatures were observed for much of the West and the East with near- to below-average conditions across much of the Great Plains and Upper Midwest.
- Based on NOAA's Residential Energy Demand Temperature Index (REDTI), the contiguous U.S. temperature-related energy demand during January-June was slightly below-average and ranked near the middle value in the 124-year period of record.
Precipitation
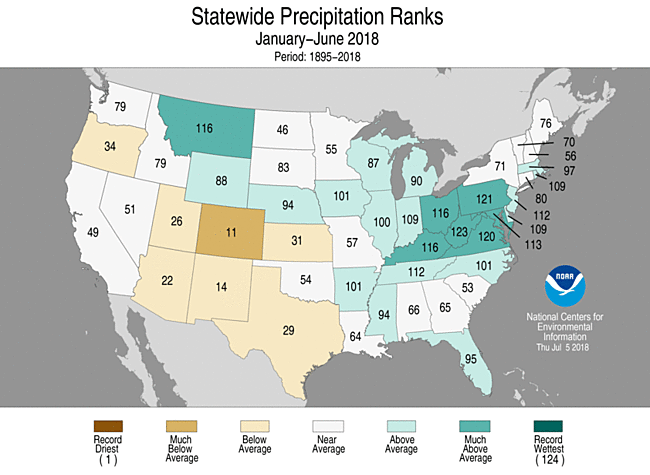
- For the year-to-date, the precipitation total was 15.78 inches, 0.47 inch above average, and ranked near the middle of the 124-year period of record.
- Above-average precipitation was observed in the Northern High Plains, Midwest and along parts of the East Coast. Seven states had a January-June precipitation total that was much above average, with record precipitation observed for some localized areas.
- Below-average precipitation was observed for locations across the Southwest, Southern Plains, Upper Midwest and Mid-Mississippi Valley. Colorado had its 11th driest year-to-date on record.
Extremes
- The USCEI for the year-to-date was 10 percent above average and ranked near the median value in the 109-year period of record. Despite the near-average national value, there were elevated extremes in warm maximum and minimum temperatures, the spatial extent of dry conditions and one-day precipitation totals. This was the lowest January-June CEI since 2013.
- On the regional scale, the CEI was record high for the Southwest due to extremes in warm maximum and minimum temperatures and the spatial extent of dry conditions.
Regional Highlights:
These regional summaries were provided by the six Regional Climate Centers and reflect conditions in their respective regions. These six regions differ spatially from the nine climatic regions of the National Centers for Environmental Information.
- Northeast Region: (Information provided by the Northeast Regional Climate Center)
- The average temperature for the Northeast for the month of June was 64.8 degrees F (18.2 degrees C), which was 0.4 degrees F (0.2 degrees C) below normal. All twelve states within the region experienced average temperatures that were near normal. Departures from normal ranged from 1.8 degrees F (1 degree C) below normal in Maine to 1.6 degrees F (0.9 degrees C) above normal in West Virginia. Vermont, Rhode Island, Maine, New Hampshire, Connecticut, Massachusetts, and New York all experienced average temperatures during the month of June that were below normal. New Jersey recorded an average temperature near normal for June, while Pennsylvania, West Virginia, Maryland, and Delaware each experienced above-normal average temperatures for the month.
- The average temperature for the Northeast for the month of June was 64.8 degrees F (18.2 degrees C), which was 0.4 degrees F (0.2 degrees C) below normal. All twelve states within the region experienced average temperatures that were near normal. Departures from normal ranged from 1.8 degrees F (1 degree C) below normal in Maine to 1.6 degrees F (0.9 degrees C) above normal in West Virginia. Vermont, Rhode Island, Maine, New Hampshire, Connecticut, Massachusetts, and New York all experienced average temperatures during the month of June that were below normal. New Jersey recorded an average temperature near normal for June, while Pennsylvania, West Virginia, Maryland, and Delaware each experienced above-normal average temperatures for the month.
- Dryness expanded throughout the month in New England. The U.S. Drought Monitor at the beginning of June listed New Hampshire as the only state in the Northeast that was abnormally dry. By the end of the month, 30 percent of the Northeast was abnormally dry, with moderate drought impacting six percent of the region, in the southern parts of Vermont, New Hampshire, and Maine.
- Heavy rain led to flooding in eight counties in eastern West Virginia on June 3. Water levels on the Cacapon River in Morgan County, West Virginia rose about 4.4 feet (1.3 m), which prompted the governor to issue a state of emergency. Roads were closed and many water rescues took place. On June 10, flash flooding closed part of Coastal Highway in Ocean City, Maryland after a weekend of heavy rain, but no injuries were reported. Areas in northern Maine experienced unseasonably late frosts and cooler-than-normal temperatures during the first half of June, impacting gardeners and farmers in the areas. Crop damage and late germination resulted from the pockets of frost throughout June in northern New England. Severe weather on June 13 spawned two EF-2 tornadoes in Pennsylvania. The tornado reported in Bradford County, Pennsylvania was on the ground for over five miles, but no injuries were reported. Later that night, another tornado touched down in Wilkes-Barre Township, Pennsylvania with 130 mph (58 m/s) winds, resulting in six injuries and structural damage to cars and buildings in the area. A water ban in Northampton, Massachusetts came into effect starting June 15 as a result of the increasingly dry conditions throughout the area. This also prompted over 75 Public Water Suppliers to enforce varying degrees of water bans in other locations throughout Massachusetts. Severe weather moved through much of the Northeast on June 18, and strong winds caused over 60,000 people in New Hampshire to lose power. An EF-0 tornado briefly touched down in Lincoln, New Hampshire as severe thunderstorms moved through the area that same day. Also on that day, a microburst created a path of damage that was over a mile long in Waitsfield, Vermont and brought wind gusts up to 80 mph (35.8 m/s), which downed dozens of trees and caused over 16,000 customers to lose power in the area.
- For more information, please go to the Northeast Regional Climate Center Home Page.
- Midwest Region: (Information provided by the Midwest Regional Climate Center)
- Precipitation was well above normal in June for much of the Midwest. Michigan (89 percent of normal) in the northeast and Missouri (80 percent of normal) in the southwest were below normal, while the rest of the Midwest states were well above normal ranging from 123 percent of normal in Minnesota to 152 percent of normal in Iowa. The region as a whole ranked as the 21st wettest in history (1895-2018), with Indiana, Iowa, and Kentucky among the wettest 10 percent of their respective histories and four more states among the wettest 25 percent. More than 500 daily records were set during June with at least a couple dozen in each Midwest state and records recorded on every day of the month except the 5th. Totals topping 10.00 inches (254 mm) were recorded at stations in seven states, with totals exceeding 12.00 inches (305 mm) in six states. Daily precipitation totals of 5.00 inches (127 mm) were also recorded in seven of the nine Midwest states. Year-to-date precipitation (January to June) ranked as the 9th wettest in Kentucky and Ohio and water year-to-date precipitation (October to June) ranked amongst the wettest in Michigan (3rd), Ohio (4th), and Indiana (7th).
- June temperatures averaged 2.7 degrees F (1.5 C) above normal for June, ranking as the 13th warmest June on record for the Midwest. Every Midwest state, except Michigan, ranked among the warmest 20 percent of its history with Missouri ranking highest as the 8th warmest. All nine states ranked as top four warmest for May and June together. Nearly a thousand (986) daily record highs were set or tied in June while fewer than a hundred (90) daily record lows were recorded. The majority of the record highs were for record high minimum temperatures which were spread across all nine states and many days. Twelve days had at least 10 record high minimum temperatures. Temperatures reached into the upper 90s (at least 98 degrees F or 37 C) in all Midwest states and a handful of stations topped 100 degrees (38 C) scattered across four states. Temperatures also dropped below 50 degrees F (10 C) in all nine states, below 40 F (4 C) in four states, and below freezing at a handful of stations in northern Minnesota and Upper Michigan.
- Drought in the Midwest was largely limited to the Iowa-Missouri border at the beginning of the month, representing just under 4 percent of the region (less than 0.25 percent in severe drought). By the end of the month, the area in drought expanded to include much of northern Missouri and covered more than 6 percent of the region (nearly 3 percent in severe drought).
- Severe weather was reported on every day of June somewhere in the region (well over 1000 reports). High winds were reported every day of June with large hail on 23 days and tornadoes on 14 days. All nine Midwest states had high winds and large hail reported and only Michigan was without a tornado report during the month. The busiest days for severe weather were the 9th, 26th, and 28th. Multiple tornadoes were reported in four states (Illinois, Kentucky, Missouri, and Wisconsin) on the 26th alone. On the 9th in Kentucky, two people were injured when a tree was blown down onto their mobile home. Late in the month, two others were injured in separate incidents in Missouri when they were struck by an awning and a tree.
- Flooding and flash flooding with the heavy rains was reported on multiple occasions. Flash flooding in Illinois and Indiana on the 9th to the 12th was due to thunderstorms tracking over the same areas for extended periods. Flash flooding in Upper Michigan and northeastern Wisconsin on the 16th to the 19th washed away roads and caused one flooding death. Many locations in these areas had rainfall totals above 6.00 inches (152 mm) with some isolated totals of up to 12.00 inches (305 mm). The 20th and 21st saw flooding in northwestern Iowa. Area rivers quickly rose to major flood levels with one location on the Little Sioux River (Linn Grove, Iowa) setting a new record flood level. The Mississippi River rose to moderate flood levels from southeastern Iowa to northeastern Missouri during the last week or so of June.
- For further details on the weather and climate events in the Midwest, see the weekly and monthly reports at the Midwest Climate Watch page.
- Southeast Region: (Information provided by the Southeast Regional Climate Center)
- Temperatures were above average across much of the Southeast region during June, and near average in Puerto Rico and the U.S. Virgin Islands. Monthly mean temperatures were 2 to 4 degrees F (1.1 to 2.2 degrees C) above average for half of the 187 long-term (i.e., period of record equaling or exceeding 50 years) stations across the region. However, less than 20 percent (32 of 187) of the long-term stations observed monthly mean temperatures that were ranked within their five warmest values on record, including Punta Gorda, FL (1915-2018; second warmest), Melbourne, FL (1938-2018; third warmest), Asheville, NC (1877-2018; third warmest), Cape Hatteras, NC (1893-2018; third warmest), and Columbia, SC (1888-2018; fifth warmest). Daily minimum temperatures were well above average across much of the region, as unusually high rates of evaporation and the persistent influx of tropical moisture suppressed nighttime cooling during the month. Indeed, a much greater number of long-term stations (67) observed average daily minimum temperatures that were ranked within their five warmest values on record, compared to only 3 stations for average daily maximum temperatures. Several locations in the Carolinas observed or tied their highest or second highest count of June days with a maximum temperature at or above 90 degrees F (32.2 degrees C), including Aiken, SC (1902-2018; 28 days), Columbia, SC (27 days), Laurinburg, NC (1946-2018; 26 days), and Florence, SC (1948-2018; 25 days). Numerous long-term stations across the region observed or tied their highest count of June days with a minimum temperature at or above 70 degrees F (21.1 degrees C), including Charleston, SC (1938-2018; 30 days), Plant City, FL (1893-2018; 30 days), Federal Point, FL (1892-2018; 29 days), Florence, SC (24 days), Alma, GA (1949-2018; 23 days), and Williamston 1 E, NC (1953-2018; 20 days). Tampa, FL (1890-2018; 28 days) and Punta Gorda, FL (17 days) observed their highest count of June days with a minimum temperature at or above 75 degrees F (23.9 degrees C), respectively. The warmest weather of the month across the Southeast occurred on the 19th, as a westward expansion of the Bermuda High over the region produced excessive heat. Daily maximum temperatures reached 95 degrees F (35.0 degrees C) or higher across portions of every state, with a few stations in the Carolinas and Virginia recording at least 100 degrees F (37.8 degrees C). The highest temperature of 105 degrees F (40.6 degrees C) was observed at the University of South Carolina COOP station in Columbia. Roanoke, VA (1912-2018) tied its second highest daily minimum temperature on record for June, at 77 degrees F (25.0 degrees C). In contrast, the coolest weather of the month occurred from the 5th through the 7th, as a continental high pressure system ushered in cooler and drier air from Canada. Daily minimum temperatures ranged from 50 to 65 degrees F (10.0 to 18.3 degrees C) across much of the region north of Florida, with numerous locations in the higher elevations of North Carolina and Virginia falling below 50 degrees F.
- Precipitation was highly variable across the Southeast region during June, which is common during the summer. The driest locations were found across much of central North Carolina, as well as portions of southwestern Virginia, South Carolina, central Alabama, the coasts of central and southern Florida, and southwestern Puerto Rico. Monthly precipitation totals were 50 to less than 25 percent of normal in these areas. Magueyes Island, PR (1959-2018) tied its driest June on record, with no measurable rainfall during the month. Dunn 4 NW, NC (1963-2018) observed its driest June on record, with only 0.42 inches (10.7 mm) of precipitation. In contrast, the wettest locations were found across much of northern and eastern Virginia, as well as portions of eastern North Carolina, Georgia, Alabama, the Florida Peninsula, and north-central Puerto Rico. Monthly precipitation totals were 150 to more than 300 percent of normal in these areas. Several long-term stations observed June precipitation totals that were ranked within their five highest values on record, including Kissimmee, FL (1940-2018; 14.66 inches, 372 mm), Helen, GA (1956-2018; 11.40 inches, 290 mm), Luray 5 E, VA (1941-2018; 10.84 inches, 275 mm), and Elizabeth City, NC (1934-2018; 8.52 inches, 216 mm). Richmond, VA (1887-2018) observed its wettest June and its seventh wettest month on record, with 13.32 inches (338 mm) of precipitation. Numerous heavy rainfall and flash flooding events occurred across the region during the month. On the 1st, Helen, GA observed its wettest June day and its fourth wettest day for any month on record, with 6.96 inches (177 mm) of precipitation. In addition, Arecibo Observatory, PR (1980-2018) observed its wettest June day and its seventh wettest day for any month on record, with 6.00 inches (152 mm) of precipitation. From the 2nd through the 4th, a nearly stationary low pressure system produced 2 to more than 5 inches (50.8 to more than 127 mm) of rainfall across portions of northern and east-central Virginia, as well as Washington, D.C. On the 3rd, West Point 2 NW, VA (1954-2018) and Luray 5 E, VA observed their second wettest June day on record, with 4.60 and 4.23 inches (117 and 107 mm) of precipitation, respectively. Numerous roads in these areas were closed due to flooding, with several reports of stalled or submerged vehicles. From the 20th through the 22nd, several rounds of thunderstorms along a stationary front produced 3 to more than 8 inches (76.2 to more than 203 mm) of rainfall across portions of northern and central Virginia, with dozens of roads closed due to flooding. On the 22nd, Richmond, VA observed its wettest June day and its second wettest day for any month on record, with 7.61 inches (193 mm) of precipitation. Much of this daily total (i.e., 7.00 of 7.61 inches or 178 of 193 mm) was recorded in just 2 hours, which exceeds the 1,000-year recurrence interval for this location. This means that a 2-hour rainfall total of 7.00 inches would be expected to occur once in more than 1,000 years on average, with less than a 0.1 percent probability of occurrence in any given year. Several other rainfall rates reached or exceeded the 1,000-year recurrence interval, including 4.64 inches (118 mm) in 1 hour, 3.00 inches in 30 minutes, 2.09 inches (53.1 mm) in 15 minutes, and 0.92 inches (23.4 mm) in 5 minutes. Swift water rescues were performed for seven stalled vehicles in Henrico County, while Richmond International Airport closed for several hours due to flooding. Exceptional rainfall streaks that began in May at a few locations in Georgia ended in early June. From May 15th through June 1st, Athens, GA (1857-2018) observed its longest streak of 18 consecutive days with measurable precipitation, surpassing its previous record in June 1963 by 4 days. From May 22nd through June 2nd, Augusta, GA (1871-2018) tied its longest streak of 12 consecutive days with measurable precipitation.
- There were 1,220 severe weather reports across the Southeast during June, which is nearly 170 percent of the median monthly frequency of 721 reports during 2000-2017. At least one severe weather report was recorded on all 30 days during the month, and there were three days (24th, 25th, and 28th) with at least 100 reports. About 95 percent (1,154 of 1,220) of the severe weather reports during the month were for strong thunderstorm winds, and nearly half (556 of 1,154) of these reports occurred in Georgia and South Carolina. Some of the highest thunderstorm wind gusts that were recorded during the month included 70 mph at Shaw Air Force Base near Sumter, SC, 69 mph at North Perry Airport near Hollywood, FL, 64 mph at Daniel Field Airport in Augusta, GA, and 58 mph at Lumberton Municipal Airport, NC. Thunderstorm winds were responsible for 2 fatalities and 9 injuries in Alabama and Georgia, with most of these casualties caused by falling trees. On the 3rd, exceptionally strong thunderstorm winds estimated at 90 to 95 mph caused significant damage along a 15-mile swath from southeastern Lamar County to southeastern Monroe County in central Georgia. Though unofficial, a personal weather station near Forsyth, GA measured a peak wind gust of 93 mph. Many large trees were uprooted along the damage path, with some falling onto homes and outdoor sheds. On the 25th, strong thunderstorm winds caused a tree to fall onto a tent at a Boy Scout camp in Newton County, GA, killing a 14-year-old boy who was sheltering inside. On the 28th, a southward-moving derecho produced a 300-mile swath of wind damage extending from northern Alabama and northwestern Georgia to the Gulf of Mexico along the Florida Panhandle. Some of the highest measured wind gusts included 58 mph at Birmingham-Shuttlesworth International Airport, AL and 52 mph at Tuscaloosa Regional Airport, AL, Falcon Field in Peachtree City, GA, and Bob Sikes Airport in Crestview, FL. Hundreds, if not thousands, of trees were blown down across these areas, with 1 fatality and 2 injuries caused by trees falling onto moving vehicles in central Alabama. In Madison County, AL, straight-line winds estimated at 100 mph snapped a 300-yard-wide swath of trees near the town of Gurley, with several falling onto homes. A total of 231,000 customers lost power in Alabama following the derecho. Only 4 tornadoes (1 unrated, 1 EF-0, 1 EF-1, 1 EF-2) were confirmed across the region during the month, which is much less than the median frequency of 14 tornadoes observed during June. In fact, it is tied for the sixth lowest June tornado count since modern records began in 1950. On the 22nd, an EF-2 tornado tracked just over 7 miles across portions of Winston and Cullman Counties in north-central Alabama. A manufactured home near the community of Jones Chapel was destroyed after being blown about 20 yards from its original location, resulting in 3 injuries. While the home was secured several feet into the ground, the 130 mph tornadic winds were able to pull out the anchors from highly saturated soil. Three fatalities and 12 injuries were caused by lightning across the region, with all of the fatalities and 10 of the injuries occurring in Florida. In addition, lightning strikes damaged at least 25 homes across the region, with 16 residential fires reported during the month. On the 13th, lightning ignited a fire at an apartment complex near Tampa, FL, which damaged 24 units and displaced over 100 residents.
- Drought conditions (D1 and greater) were not observed across the Southeast region during June, but pockets of abnormal dryness (D0) persisted in portions of Alabama. In addition, a swath of abnormally dry conditions developed and expanded in coverage across southern Puerto Rico during the month. While heavy rainfall and flooding disrupted agricultural production during much of May, drier weather in June allowed farmers in parts of the region to resume planting crops, spraying herbicides, cutting hay, and harvesting small grains. However, persistent rainfall in some portions of the region (e.g., Florida, eastern North Carolina, northern and eastern Virginia) continued to delay these activities, in addition to flooding fields and increasing weed and disease pressure on crops. Fungal and bacterial diseases were detected on fruit and vegetable crops in southern Georgia and northern Florida, as well as tobacco in parts of the Carolinas. Many livestock pastures were flooded in Florida, while standing water produced significant damage in low-lying crop fields across northern and eastern Virginia. Excessive heat, coupled with a lack of precipitation, stressed crop fields, livestock pastures, and hayfields in portions of Alabama, Georgia, and the Carolinas during the second half of the month.
- For more information, please go to the Southeast Regional Climate Center Home Page.
- High Plains Region: (Information provided by the High Plains Regional Climate Center )
- It was another warm month throughout the High Plains, as June temperatures averaged 3.0-6.0 degrees F (1.7-3.3 degrees C) above normal for much of the region. Similar to May, numerous top 10 records for warmest June were broken. This late spring/early summer heat allowed crops to progress quickly after getting off to a late start due to a chilly April. While corn and soybeans were faring well for the most part across the region, a continuation of excessive heat could impact yields and is something to watch throughout the summer.
- Precipitation varied throughout the region during June, with record-breaking rainfall across portions of Nebraska and South Dakota, and dry conditions across much of Colorado and eastern Kansas. Severe weather was abundant during June, including the uncommon occurrences of strong tornadoes in Wyoming and dust storms in South Dakota. Meanwhile, wildfires raged across southern Colorado where drought has been present. Fires threatened public safety and natural resources at San Juan National Forest, prompting the U.S. Forest Service to close it down in mid-June. At the time of this writing, the Spring Creek fire had burned more than 103,000 acres and was the third largest wildfire in Colorado's history, according to The Denver Post.
- June 30th was the official end of the 2017-18 snow season, which brought both above-normal and below-normal snowfall to the region. Snowfall was plentiful in the Northern Plains, particularly in South Dakota and Nebraska. The following locations ranked in the top 10 for snowiest season: North Platte, NE (5th snowiest), Sioux Falls, SD (5th snowiest), Pierre, SD (10th snowiest), and Rapid City, SD (10th snowiest). Snowfall was scarce throughout Colorado and parts of Kansas, however. Locations ranking in the top 10 for least snowiest season included: Alamosa, CO (least snowiest), Dodge City, KS (3rd least snowiest), Pueblo, CO (4th least snowiest), Denver, CO (5th least snowiest), and Grand Junction, CO (tied for 5th least snowiest).
- Above-normal temperatures continued into June for most of the High Plains region. Other than northern and central Wyoming where June temperatures were generally near normal, the region experienced departures of approximately 3.0-6.0 degrees F (1.7-3.3 degrees C) above normal. Every state in the High Plains region had locations that experienced a top 10 warmest June on record. The greatest departures occurred in small pockets of east-central Kansas and south-central Colorado, and records were most impressive in these areas. For instance, Salina, Kansas tied for its warmest June on record, while Colorado Springs, Colorado and Pueblo, Colorado had their second warmest.
- A widespread heat wave impacted the region June 27th-29th, prompting the National Weather Service to issue heat advisories for much of the eastern High Plains and Midwest. High humidity levels warranted an excessive heat warning for eastern Kansas. Temperatures topped 100.0 degrees F (37.8 degrees C) throughout Colorado, Kansas, Nebraska, and South Dakota. Given the high elevation, this is a less common occurrence in Colorado. For instance, Denver tied its highest June temperature on record of 105.0 degrees F (40.6 degrees C), while Colorado Springs and Pueblo both tied for 3rd highest at 100.0 degrees F (37.8 degrees C) and 106.0 degrees F (41.1 degrees C), respectively. It is also worth noting that minimum temperatures were rather warm during this heat wave as well. On the 29th, it only dropped down to 81.0 degrees F (27.2 degrees C) in Topeka, Kansas, which tied for its 3rd highest minimum temperature on record for June. Lincoln, Nebraska tied for its 4th highest minimum temperature for June at 80.0 degrees F (26.7 degrees C). Elsewhere, numerous daily records for highest minimum temperature were broken during this heat wave.
- Much of the High Plains had a wet June, as the western Dakotas, eastern Nebraska, western Kansas, and pockets of Wyoming received at least 150 percent of normal precipitation. Fortunately, heavy rains fell across areas that have been in drought, such as portions of the Dakotas and western Kansas. The heaviest rains fell across eastern Nebraska and southeastern South Dakota, resulting in some impressive monthly precipitation records. For instance, Sioux Falls, South Dakota had its 6th wettest June on record, while Lincoln, Nebraska tied for its 8th wettest. Not all areas of the High Plains were wet in June, however. Much of Colorado, eastern Kansas, and the eastern Dakotas were left dry, causing drought to expand and intensify in these regions.
- Repeated thunderstorms brought heavy rainfall to much of eastern Nebraska and southeastern South Dakota from June 17th-25th. Sioux Falls, South Dakota received 4.69 inches (119 mm) of precipitation June 20th-21st, which was the 3rd highest 2-day total precipitation on record for June (period of record 1893-2018). In Omaha, Nebraska, the College World Series was occurring during this period and, according to the Omaha World-Herald, rain and lightning caused 660 minutes of game delays, which was longer than the past seven years combined!
- Numerous severe weather events occurred throughout the High Plains in June, some of which were particularly notable. On June 1st, severe storms impacted a large portion of the High Plains region, with widespread reports of tornadoes, large hail, and damaging winds throughout northeastern Wyoming, the Dakotas, Nebraska, and eastern Kansas. For instance, a tornado touched down near Gillette, Wyoming and destroyed numerous structures, snapped trees and utility poles, and caused two injuries. This tornado was rated an EF-3 on the Enhanced Fujita Scale. According to records from the National Centers for Environmental Information (NCEI), the last time a tornado of this strength was reported in Wyoming was 1987. Also on the 1st, strong winds kicked up dirt and dust over dry areas of northeastern South Dakota and produced a dust storm, reducing visibilities and causing traffic issues and damage to vegetation. Later in the month, two hailstorms decimated corn and soybean fields in South Dakota between Rapid City and Pierre. The storms left hail scars on the landscape, which could be seen on satellite images.
- As of the end of June, Upper Missouri Basin snowpack had almost completely melted out. Rapid melting due to above-normal temperatures in May and June caused streamflows to be much above normal. The U.S. Army Corps of Engineers continued higher-than-average releases from Missouri River mainstem projects in June. Colorado snowpack was abysmal this year, peaking at 71 percent of normal statewide. The snowpack melted out nearly a month early in southern basins, so streamflows were well below normal during June. In the Plains, below-normal streamflows were common in areas where drought was present, including southeastern Colorado, central and eastern Kansas, and along the southern border of Nebraska. Meanwhile, periodic heavy rainfall in northeastern Nebraska and southeastern South Dakota caused much-above-normal streamflows, including flooding on the Missouri River.
- Heavy rains improved drought conditions across the western Dakotas and northern and western Kansas during June, while eastern South Dakota, eastern Kansas, and portions of Colorado missed out and drought conditions worsened. The U.S. Drought Monitor indicated an overall improvement in drought conditions for the High Plains region during the past month, as areas experiencing drought (D1-D4) improved from 36 percent at the end of May to 26 percent in late June.
- One of the most notable improvements included the elimination of drought from much of the western Dakotas, an area that had been in drought since June 2017. While some lingering impacts justified the depiction of abnormally dry conditions (D0) on the U.S. Drought Monitor map, this area received approximately 130-150 percent of normal precipitation from April to June, allowing for gradual improvements. Portions of Kansas benefited from above-normal precipitation in June, as exceptional drought (D4) and severe drought (D3) were eliminated from southwestern Kansas, while moderate drought (D1) and D0 conditions were erased from the north-central part of the state.
- As for degradations, drought developed and intensified over northeastern South Dakota, which had below-normal precipitation in June. A similar situation occurred in eastern Kansas, as this area was dry while the western half of the state was wet. Drought intensified in western Colorado where water-year precipitation deficits continued to accumulate.
- For more information, please go to the High Plains Regional Climate Center Home Page.
- Southern Region: (Information provided by the Southern Regional Climate Center)
- June temperatures were above normal throughout most of the Southern Region. Western Oklahoma and northern and central Texas experienced temperatures 6 to 8 degrees F (3.33 to 4.44 degrees C) above normal. Northwestern Tennessee, northeastern Mississippi, northwestern Louisiana, northwestern, central, and southwestern Arkansas, western, southern, and northeastern Oklahoma, and northern, central, western, and northeastern Texas experienced 4 to 6 degrees F (2.22 to 3.33 degrees C) above normal temperatures. The statewide monthly average temperatures were as follows: Arkansas – 80.00 degrees F (26.67 degrees C), Louisiana – 82.00 degrees F (27.78 degrees C), Mississippi – 80.60 degrees F (27.00 degrees C), Oklahoma – 80.60 degrees F (27.00 degrees C), Tennessee – 76.50 degrees F (24.72 degrees C), and Texas – 83.90 degrees F (28.83 degrees C). The statewide temperature rankings for June were as follows: Arkansas (ninth warmest), Louisiana (eighth warmest), Mississippi (fifteenth warmest), Oklahoma (tenth warmest), Tennessee (eleventh warmest), and Texas (third warmest). June was the second consecutive month where temperatures were above normal throughout the Southern Region. All state rankings are based on the period spanning 1895-2018.
- June temperatures were above normal throughout most of the Southern Region. Western Oklahoma and northern and central Texas experienced temperatures 6 to 8 degrees F (3.33 to 4.44 degrees C) above normal. Northwestern Tennessee, northeastern Mississippi, northwestern Louisiana, northwestern, central, and southwestern Arkansas, western, southern, and northeastern Oklahoma, and northern, central, western, and northeastern Texas experienced 4 to 6 degrees F (2.22 to 3.33 degrees C) above normal temperatures. The statewide monthly average temperatures were as follows: Arkansas – 80.00 degrees F (26.67 degrees C), Louisiana – 82.00 degrees F (27.78 degrees C), Mississippi – 80.60 degrees F (27.00 degrees C), Oklahoma – 80.60 degrees F (27.00 degrees C), Tennessee – 76.50 degrees F (24.72 degrees C), and Texas – 83.90 degrees F (28.83 degrees C). The statewide temperature rankings for June were as follows: Arkansas (ninth warmest), Louisiana (eighth warmest), Mississippi (fifteenth warmest), Oklahoma (tenth warmest), Tennessee (eleventh warmest), and Texas (third warmest). June was the second consecutive month where temperatures were above normal throughout the Southern Region. All state rankings are based on the period spanning 1895-2018.
- At the end of June and into July, exceptional and extreme drought classifications are still present in extreme western Oklahoma and southwestern Texas. Extreme drought classifications are present in western Oklahoma and northern, central, and southeastern Texas. Severe drought classifications are present throughout parts of northern, central, and northeastern Texas, western and southeastern Oklahoma, southwestern Arkansas, and northwestern Louisiana. The moderate drought classification remains throughout parts of central, northern, and northeastern Texas. Moderate drought classification appeared in northern and southeastern Oklahoma, central, western, and southwestern Arkansas, central, northwestern, and northeastern Louisiana, and southwestern Mississippi. There are currently no drought conditions in Tennessee.
- In June, there were severe storm reports everyday throughout the Southern Region except on June 6.
- On June 1, 2018, a 68 mph (109.44 kph) wind gust was reported in White River Lake, Texas.
- On June 2, 2018, baseball sized hail was reported in Hector, Arkansas and an 100 mph (160.93 kph) wind gust was reported in Colt, Arkansas. Also, strong winds downed many trees in Holly Springs, Mississippi.
- On June 3, 2018, hail broke house windows in Midland, Texas. In Manor, Texas, a strong wind gust caused two injures when it overturned an RV trapping two individuals inside.
- On June 4, 2018, tennis ball sized hail was reported in Lone Grove, Oklahoma.
- On June 5, 2018, baseball sized hail and vehicle damage was reported in Carrollton, Texas.
- On June 7, 2018, there was one fatality in McKinney, Texas, when a strong wind gust blew over a tree on top of a vehicle. An 84 mph (135.19 kph) wind gust was reported in Lesley, Texas.
- On June 8, 2018, a strong wind gust in Metairie, Louisiana, caused damage to seating and covering of a pavilion at the Baby Cakes baseball field.
- On June 12, 2018, there was a tornado and baseball sized hail reported in Panhandle, Texas. An 85 mph (136.79 kph) wind gust was reported in Rosston, Oklahoma.
- On June 13, 2018 a tornado was reported in Little Dixie, Arkansas. Strong winds caused power outages in Little Rock, Arkansas.
- On June 15, 2018, a tornado was reported in Wynne, Arkansas. In Thompson's Station, Tennessee, strong winds snapped several trees and totaled two cars.
- On June 16, 2018, strong winds caused structural damage including two metal roofs and brick damage at a home in Levelland, Texas.
- On June 17, 2018, strong winds caused downed trees and power lines in East Nashville, Tennessee.
- On June 18, 2018, a tornado was reported in Brookhaven, Mississippi. The tornado downed some large tree limbs.
- On June 19, 2018, strong winds downed large tree limbs in Orange, Louisiana.
- On June 21, 2018, strong winds caused one injury in Grenada, Mississippi, when a tree fell on a house.
- On June 22, 2018, two tornadoes were reported, one in Beaver County, Oklahoma, and one in Wheeler, Texas. One injury was reported in Wheeler, Texas, when strong winds trapped five people in a home when the roof collapsed. Also, a tree fell on a car trapping two people. An 87 mph (140.01 kph) wind gust was reported in Mooreland, Oklahoma.
- On June 23, 2018, a strong wind gust caused a barn roof to be blown off in Fairmont, Oklahoma. An 87 mph (140.01 kph) wind gust was reported in Grape Creek, Texas.
- On June 24, 2018, an 83 mph (133.58 kph) wind gust was reported in Camargo, Oklahoma.
- On June 25, 2018, a strong wind gust caused downed trees and power lines in Knoxville, Tennessee.
- On June 28, 2018, a tornado was reported in Centerville, Tennessee. A strong wind gust caused multiple downed trees in Decatur, Tennessee.
- For more information, please go to the Southern Regional Climate Center Home Page.
- Western Region: (Information provided by the Western Region Climate Center)
- June averaged cooler than normal in the Pacific Northwest, despite significant heatwaves impacting the region. The northern Intermountain West remained cooler than normal throughout June, while summer heat scorched the southwestern US with well above normal temperatures. Precipitation was well above normal in the northern Rockies, and with the aid of tropical moisture, above average precipitation briefly relieved localized regions across the drought stricken Southwest.
- Despite averaging cooler than normal temperatures, the Pacific Northwest observed the first significant heatwaves of the summer in mid-to-late June. Areas that typically experience mild June temperatures were impacted by significant heat as high pressure systems developed over the region. On June 20th Portland, OR reached 95°F (35°C), 22.9 degrees above normal, while Olympia, WA observed a daily high temperature of 91°F (32.7°C), 19.2 degrees above normal. However, some relief was seen along the immediate coastline, areas such as Tillamook, OR and Aberdeen, WA topped out at 69°F (20.5°C) and 63°F (17.2°C), respectively. In the southwest, several locations set new daily high temperature records during the month of June. On June 13th, Douglus, AZ and Grand Junction, CO observed new daily records of 103°F (39.4°C); and 101 F (38.3°C), respectively. Roswell, NM also reached a daily record high of 109°F (42.7°C) on June 22nd. Most impressively, Death Valley, CA registered a daily-record high set at 126°F (52.2°C) on June 21st, tying six other days as the fifth warmest June day ever recorded in Death Valley, CA since records began in 1911.
- The northern extension of the intermountain west appeared to be the only reprieve from the sweltering heat felt across the southwest region in June. Several low pressure systems produced cooler than average temperatures across northern Idaho, Montana, and the northern Wyoming, where the average high temperature across these regions was in the mid-to-low 70's°F (20's°C). Some regions even broke daily minimum temperature records in early June. On June 12th Wisdom, MT and Butte, MT bottomed out at 21°F (-6.1°C, 15.9 degrees below normal) and 28°F (-2.2°C, 12.8 degrees below normal), respectively.
- Several storms brought significant precipitation to the northern Rockies throughout the month of June. Areas located in central and eastern Idaho, central and western Montana, and western Wyoming all received well above normal precipitation; ranging from 100-300 percent of normal. A significant amount of precipitation was observed in a 96-hour period from June 15th-19th in Gleason and Gibson Dam, northwest of Great Falls, MT. These locations received 6.53 inches (165.86 mm) and 7.50 inches (190.50mm) of rain, respectively. This event was Gibson Dam's highest 4-day total since June 1964. The copious amounts of precipitation along the Rocky Mountain front lead to sharp rises in downstream creeks and rivers and produced significant flooding in Augusta, MT, Sun River, MT, Great Falls, MT, as well as serval locations in central Wyoming along the Wind River.
- Extreme-to-exceptional drought continued to impact the four corners region throughout June. However, some relief was seen in eastern Arizona and western New Mexico as remnant moisture from Hurricane Bud was lifted through the Gulf of California and into the four corners region. For some locations, this event produced the first measurable precipitation since February, 2018. Tucson, AZ, for example, broke its streak of no measurable precipitation in 100+ days, with a two-day sum of 0.91 inches of rain (23.11 mm) between June 15th-16th. Additionally, Douglas, AZ set consecutive daily record totals on June 15th at 0.37 inches (9.39 mm) and June 16th at 0.39 inches (9.90 mm). Moreover, Farmington, NM observed a 2-day total of 0.40 inches (10.16 mm) and remote regions around Durango, CO averaged 1.18 inches (29.97 mm) from this event. Meanwhile, the majority of California, Nevada, and Utah observed below normal precipitation. This has aided in the production of 14 large wildfires spread across these three states burning a current total of 117,044 acres (18,075.3 ha).
- After a cool and extended spring, June brought significant change to several locations across Alaska. The western half of Alaska observed warm, dry conditions, where more than 50 wildfires had been reported by mid-June in the western Alaskan interior. Eastern interior Alaska temperatures remained near normal to slightly below normal; however, precipitation was well below normal for the month of June. Fairbanks, AK, for instance, observed only 47 percent of normal precipitation. South central Alaska and the panhandle observed near normal temperatures; however, precipitation was well above normal in southcentral Alaska and below normal in the Alaskan Panhandle. For example, Valdez, AK, located in southcentral Alaska, observed monthly sum of 8.88 inches (225.55 mm) of rain; while Juneau, AK, located in the panhandle, observed a monthly sum of 3.07 inches (77.97 mm), narrowly reaching the 50th percentile.
- In the eastern Pacific Ocean, Hawaii observed near normal temperatures, with the exception of above normal temperatures observed on the island of Molokai. On June 20th, Kualapuu, on the island of Molokai, set a new daily record of 90°F (32.2°C). In addition to the calm, warm weather, most of Hawaii observed well below normal precipitation. However, windward locations on the Big Island observed near normal to above normal precipitation. For example, Hilo, HI recorded 7.73 inches (196.34 mm) of rain, for a total of 105 percent of normal for the month of June.
- June (all month): Wildfires in the West: 32 large fires are burning across eight states in the West, including as far north as Washington and Oregon. Approximately 431,053 acres (174,440.96 ha) have burned to date from these fires. The fires have been fueled by the extremely dry brush across the region. Much of the four corners region continues to see extreme to exceptional drought with abnormally dry to severe drought conditions starting to extend into the Pacific Northwest.
- June 12: San Juan National Forest closure: Extreme fire conditions, due to exceptional drought and fuel conditions, induced a stage 3 fire closure from June 12th, 2018 to June 21st, 2018. Forest campgrounds, day use areas, roads and hiking trails were closed. This marked the first ever closure since it was designated a national forest in 1905. Two active fires aided the closure decision; the Burro Fire with 4,545 acres (1,839.3 ha) currently burned, and the 416 Fire with 52,778 acres currently burned (21,358.5 ha).
- June 12: San Juan National Forest closure: Extreme fire conditions, due to exceptional drought and fuel conditions, induced a stage 3 fire closure from June 12th, 2018 to June 21st, 2018. Forest campgrounds, day use areas, roads and hiking trails were closed. This marked the first ever closure since it was designated a national forest in 1905. Two active fires aided the closure decision; the Burro Fire with 4,545 acres (1,839.3 ha) currently burned, and the 416 Fire with 52,778 acres currently burned (21,358.5 ha).
- June 18: Severe storm: On the evening of June 18th, a severe storm in northern Colorado produced baseball-sized hail and powerful winds. The storm damaged cars and homes in the Boulder area, before moving northeast toward Fort Morgan, where 70 mph winds and baseball-sized hail wreaked havoc in Morgan County. Storm reports included heavy rain in many parts of Colorado, with funnel clouds and tornadoes in the eastern Plains.
- For more information, please go to the Western Regional Climate Center Home Page.
 NOAA's National Centers for Environmental Information
