National Overview

November Highlights

November Temperature

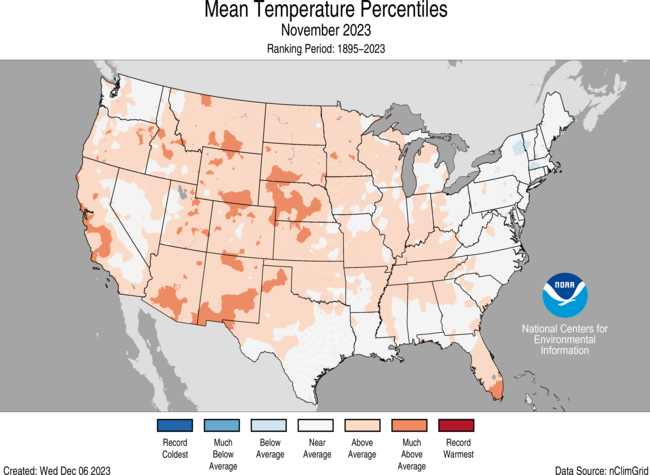
The contiguous U.S. average temperature during November was 44.4°F, 2.7°F above average, ranking 19th warmest in the 129-year record.
Generally, temperatures were above average across much of the contiguous U.S., while below-normal temperatures were observed in parts of the Northeast. No state ranked among their top-10 warmest or coldest November on record.
The contiguous U.S. average maximum (daytime) temperature during November was 55.8°F, 3.1°F above the 20th century average, ranking in the warmest third for daytime temperatures in the historical record. Maximum temperatures were near to above average across much of the contiguous U.S., while below-average temperatures were observed in parts of Washington state, the Northeast and from Texas to northern Florida. No state ranked among their top-10 warmest November for daytime temperatures.
The contiguous U.S. average minimum (nighttime) temperature during November was 33.0°F, 2.3°F above the 20th century average, ranking in the warmest third for overnight temperatures on record. Minimum temperatures were above average across much of the western half of the contiguous U.S. and the Southeast, while below-normal temperatures were observed in much of the Northeast, Mid-Atlantic and in parts of the central Mississippi Valley and Great Basin. New Mexico ranked 10th warmest November on record for nighttime temperatures.
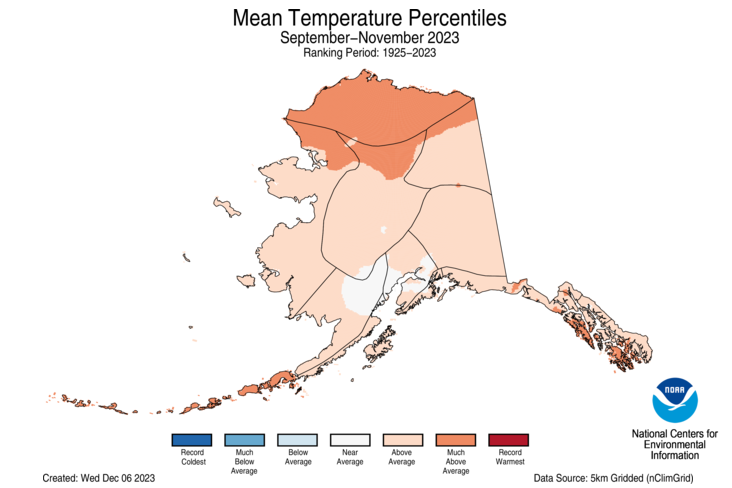
The Alaska statewide November temperature was 20.3°F, 8.6°F above the long-term average, ranking fourth warmest in the 99-year period of record for the state. Temperatures were above average across the entire state during the month.
Based on NOAA's Residential Energy Demand Temperature Index (REDTI), the contiguous U.S. temperature-related energy demand during November was 73 percent of average and the 30th-lowest value in the 129-year period of record.
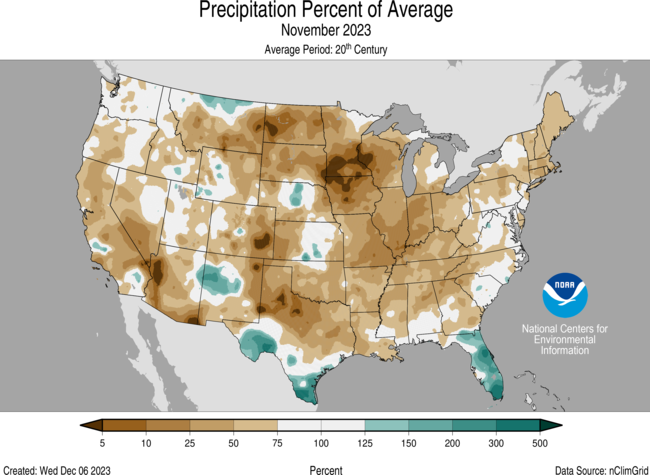
November Precipitation

The November precipitation total for the contiguous U.S. was 1.38 inches, 0.85 inch below average, ranking 12th driest in the historical record.
Precipitation was near to below average across most of the contiguous U.S., while above-normal precipitation was observed in parts of southern California, the Rockies, central and southern Plains and Southeast.
No state ranked in their top-10 wettest November on record for this period. Conversely, Indiana ranked third driest on record for the month.
Across the state of Alaska, the average monthly precipitation was 4.62 inches, ranking as the 16th wettest November in the historical record. Precipitation was above average in parts of the North Slope, Interior and along parts of the Gulf of Alaska, while precipitation was near normal across much of the West Coast and in parts of the Southwest, northeast Interior and Panhandle. Below-normal precipitation was observed in the parts of the Aleutians during the month.
According to the November 28 U.S. Drought Monitor, about 36.1% of the contiguous U.S. was in drought, down about 0.4% from the end of October. Drought conditions expanded or intensified across much of the central Mississippi and Ohio valleys, and in parts of the Southwest, central plains, Southeast, Mid-Atlantic, Northeast and Hawaii this month. Drought contracted or was reduced in intensity across much of the Northwest and southern Plains, and in portions of the Southeast, Great Lakes and Puerto Rico.
Billion-Dollar Weather and Climate Disasters
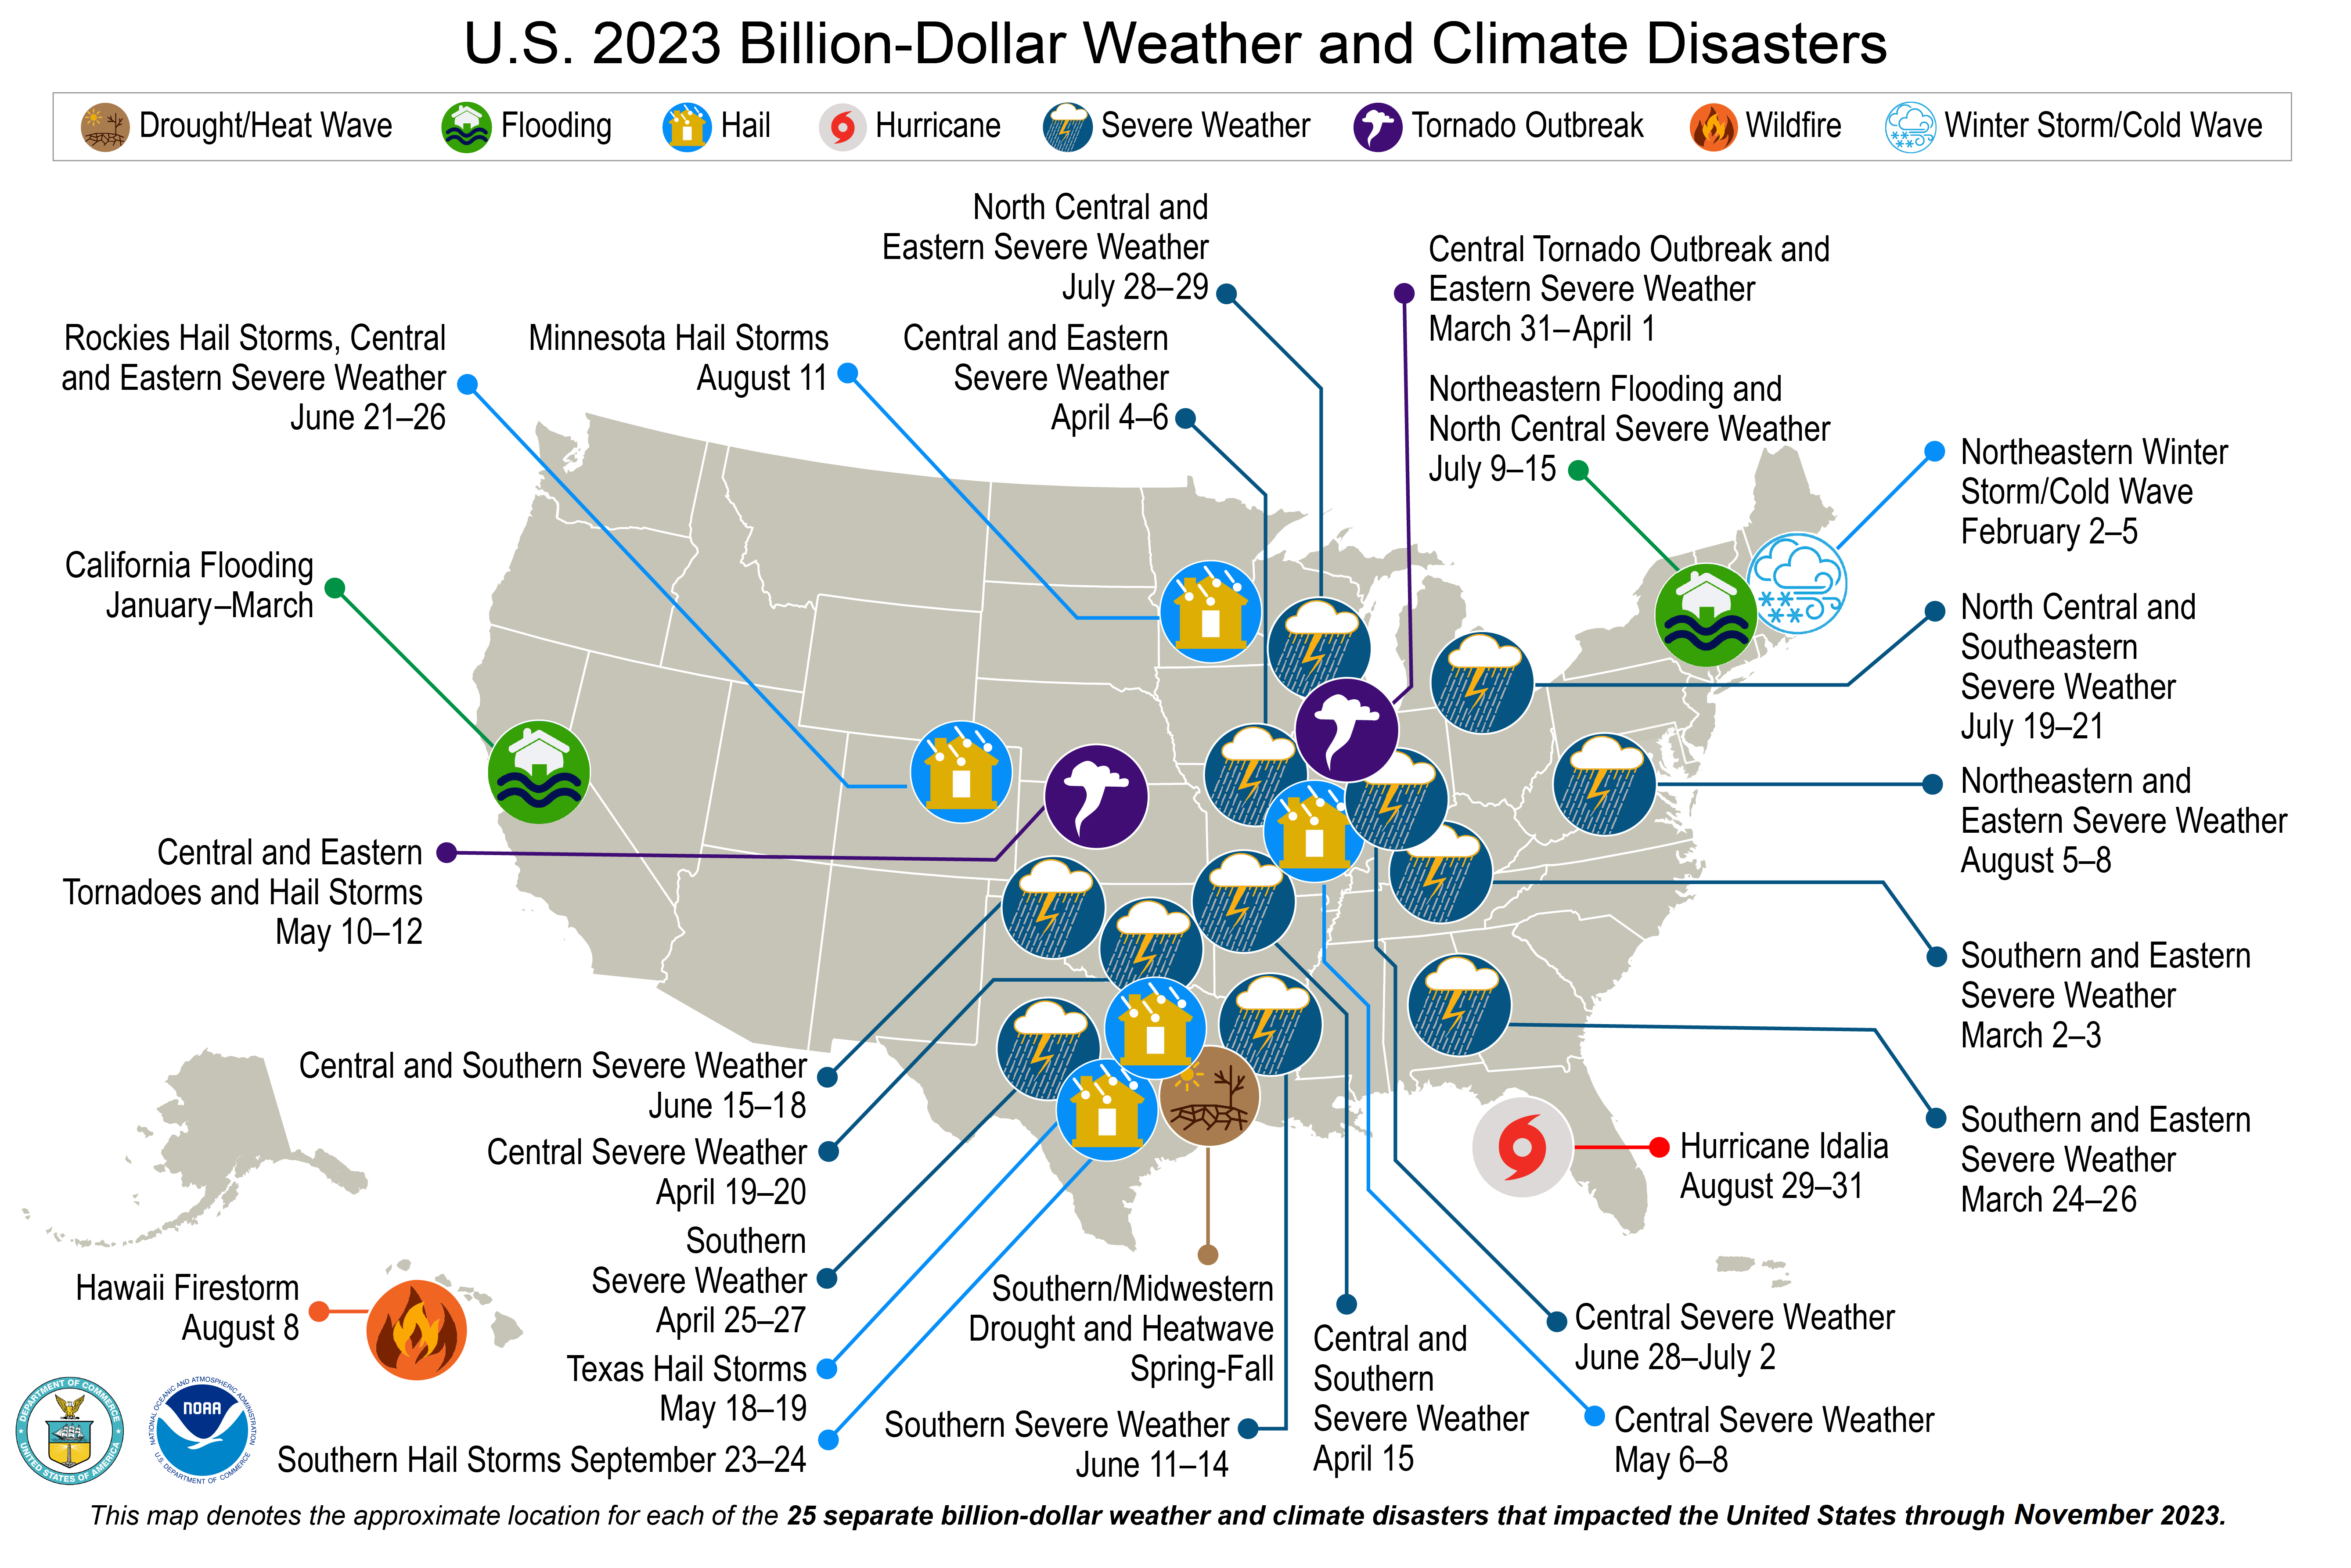
No new billion-dollar weather and climate disasters were confirmed this month. The 2023 Southern/Midwestern drought was the most costly U.S. event during the first 11 months of 2023 with losses exceeding $10 billion.
There have been 25 confirmed weather and climate disaster events this year, each with losses exceeding $1 billion. These disasters consisted of 19 severe storm events, two flooding events, one tropical cyclone, one winter storm, one wildfire and one drought and heatwave event. For this year-to-date period, the first 11 months of 2023 rank highest for disaster count, ahead of those of 2020 which saw 20 disasters. The total cost of the 2023 events exceeds $81.0 billion, and they have resulted in 482 direct and indirect fatalities.
Since these billion-dollar disaster records began in 1980, the U.S. has sustained 373 separate weather and climate disasters where overall damages/costs reached or exceeded $1 billion (based on the CPI adjustment to 2023) per event. The total cost of these 373 events exceeds $2.655 trillion.
Other Notable Events
Record-warm sea surface temperatures in the Atlantic basin brought 20 named tropical systems during 2023, ranking fourth for the most named storms in a year since 1950. Three of these storms made landfall in the U.S.—Hurricane Idalia and tropical storms Harold and Ophelia.
Persistent heat brought above-normal temperatures to much of the U.S. during 2023:
- Approximately 32 million people were impacted by record heat during the January–November period.
- A total of 287 counties each had their warmest January-November on record while an additional 1661 counties ranked in the top-10 warmest for the year-to-date period. There are 3,143 counties in the U.S.:
- Year-to-date temperatures across the eastern U.S. have been warmer than average in 2023 with 31 states experiencing a top-10 warmest January–November.
By November 21, more than 39 inches of snow accumulated in Anchorage, Alaska, with this November becoming the snowiest November since record-keeping began in 1953—the previous record was 38.8 inches set in 1994.
A Kona Low brought heavy rains and flooding to parts of the Hawaiian Islands during late November. Parts of the Big Island received up to 7 inches of rain while higher elevations reported up to 5 inches of snow.
Much of the country observed temperatures 10–20°F below average during the late part of November. The first significant lake-effect snowstorm of the season occurred on November 27–29, bringing snow accumulations of greater than 40 inches to portions of New York state. On the morning of November 29, record-low temperatures occurred over parts of the eastern U.S.:
- Temperatures in Danville, Virginia, dropped to 15°F, which broke its old record of 17°F set in 1955.
- Jackson, Kentucky, reported a low temperature of 21°F, breaking the old record of 22°F set in 2018.
- Elizabeth City, North Carolina, reported a low temperature of 22°F, which broke the old record of 23°F from 1996.
Fall Highlights


September-November Temperature
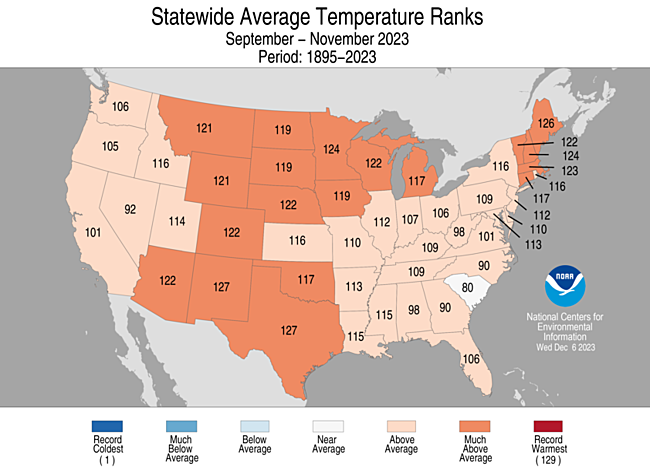
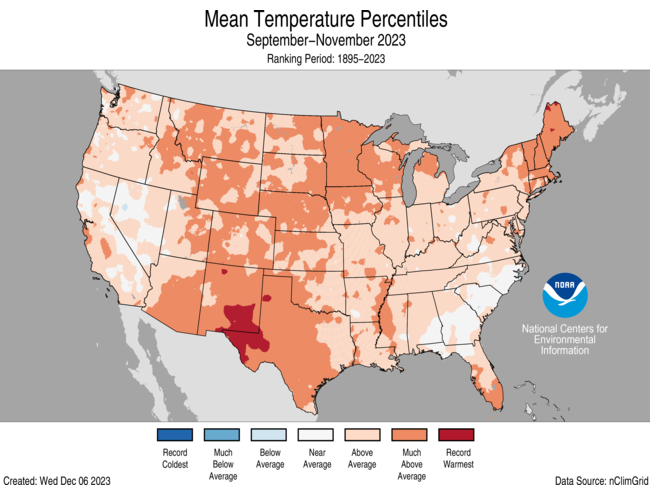
The meteorological autumn (September-November) average temperature for the contiguous U.S. was 56.1°F, 2.5°F above average, ranking sixth warmest on record.
Temperatures were above average across most of the contiguous U.S., with record-warm temperatures observed in parts of New Mexico, western Texas and northern Maine.
New Mexico and Texas each ranked third warmest on record, while Maine ranked fourth warmest for this autumn season. An additional 10 states ranked among their top-10 warmest on record for this period.
The contiguous U.S. average maximum (daytime) temperature during September-November was 68.1°F, 2.4°F above the 20th century average, ranking 11th warmest on record. Daytime temperatures were above average across much of the contiguous U.S., while below-average temperatures were observed along portions of the West Coast and southeastern U.S. New Mexico ranked 6th warmest on record, with three additional states experiencing a top-10 warmest September-November for daytime temperatures.
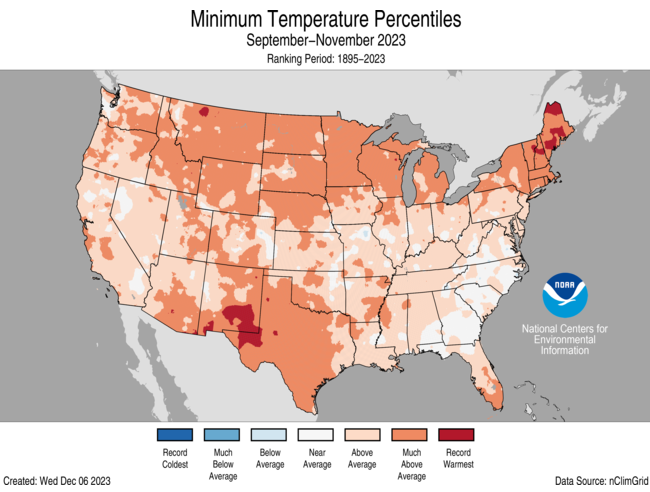
The contiguous U.S. average minimum (nighttime) temperature during this three-month period was 44.0°F, 2.7°F above the 20th century average, ranking 5th warmest in the historical record. Above-average nighttime temperatures were observed across most of the U.S. during this three-month period. Maine ranked warmest on record while Vermont and New Hampshire ranked second warmest on record for nighttime temperatures. 15 additional states ranked among their top-10 warmest September-November during this autumn season.
The Alaska autumn temperature was 29.6°F, 3.7°F above the long-term average, ranking 13th warmest on record for the state. Temperatures were above average across most of the state of Alaska while some parts of south-central Alaska saw near-average autumn temperatures.
Based on REDTI, the contiguous U.S. temperature-related energy demand during September-November was 56 percent of average and was the 19th-lowest value on record.
September-November Precipitation

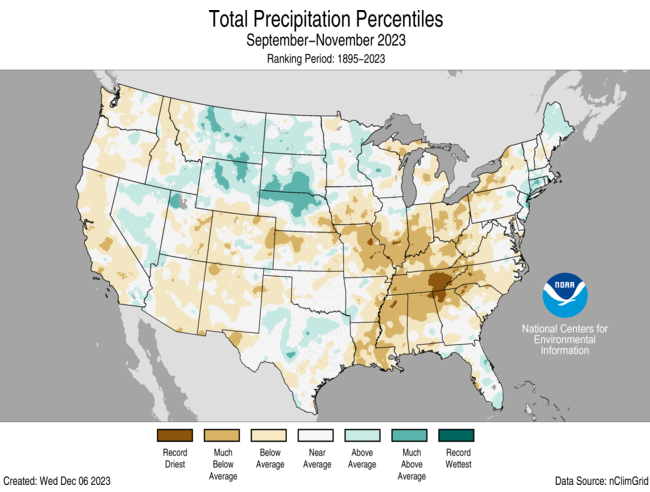
The contiguous U.S. autumn precipitation total was 5.66 inches, 1.22 inches below average, ranking 15th driest in the September-November record.
Precipitation was below average across much of the eastern half of the U.S., the Southwest, California and in parts of the Northwest and central Plains. Tennessee ranked third driest on record with three additional states in the Mississippi and Ohio Valleys ranking among their top-10 driest autumn season on record.
Autumn precipitation was above average from the northern Rockies to the western Great Lakes and in parts of the Great Basin, southern Plains, Northeast and Southeast. No state ranked among their top-10 wettest autumn season on record.
For autumn season precipitation, Alaska ranked in the wettest third of the record with wetter-than-average conditions observed across much of the state. Near-normal precipitation was observed in parts of the Interior and south Central Alaska, while below-normal precipitation occurred in parts of the Southwest and Aleutians during this season.
Extremes
The U.S. Climate Extremes Index (USCEI) for the autumn period was 9 percent above average, ranking in the upper third of the 114-year period of record. Extremes in warm maximum temperatures and warm minimum temperatures were the major contributors to this elevated CEI value. The USCEI is an index that tracks extremes (occurring in the upper or lower 10 percent of the record) in temperature, precipitation and drought across the contiguous United States.
On the regional scale, the Northeast, Upper Midwest, South, Southwest, Northwest and Northern Rockies and Plains ranked above average for this September-November period. Each of these regions experienced elevated extremes in warm minimum temperatures while the Northeast, Upper Midwest, South, Southwest and Northern Rockies and Plains experienced elevated extremes in warm maximum temperatures. In addition, the Upper Midwest and South saw extremes in dry PDSI values, while the Northeast saw elevated values in wet PDSI and the Northwest experienced elevated extremes in days with precipitation. Conversely, extremes across the Ohio Valley and Southeast were 63 percent and 60 percent below average, each ranking in the lowest third for the autumn season on record.
Year-to-Date Highlights

January-November Temperature

For the January-November period, the average contiguous U.S. temperature was 55.8°F, 2.0°F above average, ranking 10th warmest on record for this period.
Temperatures were above average from parts of the Southwest to the East Coast and along much of the Northern Tier, with near- to below-average temperatures from the central Rockies to California and in parts of the northern and central Plains.
Texas, Louisiana and Mississippi ranked warmest on record while Massachusetts, Connecticut and Florida each ranked second warmest for the January–November period. An additional 25 states had a top-10 warmest year-to-date period. No state experienced a top-10 coldest event for this 11-month period.
The contiguous U.S. average maximum (daytime) temperature during January-November was 67.7°F, 1.8°F above the 20th century average, ranking 15th warmest in the historical record. Above-average temperatures were observed across much of the eastern contiguous U.S., the southern Plains and in portions of the central Plains, Southwest and along the Northern Tier. Near- to below-average temperatures were observed from the northern Plains to the West Coast. Louisiana, Florida and Maryland each ranked warmest on record, while Texas and Mississippi each ranked second warmest for daytime temperatures during the January-November period. An additional 18 states ranked among their top-10 warmest for daytime temperatures during this period. No state experienced a top-10 coldest January-November on record for this 11-month period.
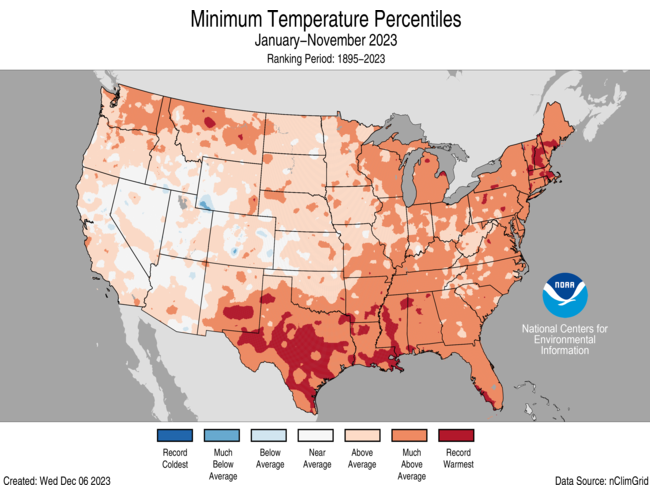
The contiguous U.S. average minimum (nighttime) temperature during this 11-month period was 43.8°F, 2.2°F above the 20th century average, ranking 8th warmest in the historical record. Above-average nighttime temperatures were observed across much of the contiguous U.S. Texas, Louisiana, Mississippi and New Hampshire each ranked warmest on record, while Maine, Vermont, Massachusetts, Rhode Island, Connecticut, Alabama and Florida each ranked second warmest on record for nighttime temperatures. An additional 22 states experienced a top-10 warmest event for nighttime temperatures during the January-November period. Below-average nighttime temperatures were observed in small portions of the central Plains, the central Rockies and California.
The Alaska January-November temperature was 30.5°F, 2.5°F above the long-term average, ranking 18th warmest in the historical record for the state. Much of the state was above normal for the 11-month period while temperatures were near average across small parts of western and interior parts of the state.
Based on REDTI, the contiguous U.S. temperature-related energy demand during January-November was 36 percent of average and was the fifth-lowest value on record.
January-November Precipitation
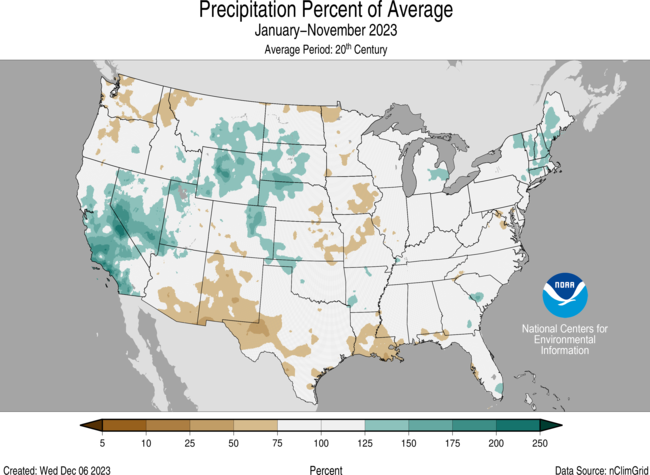
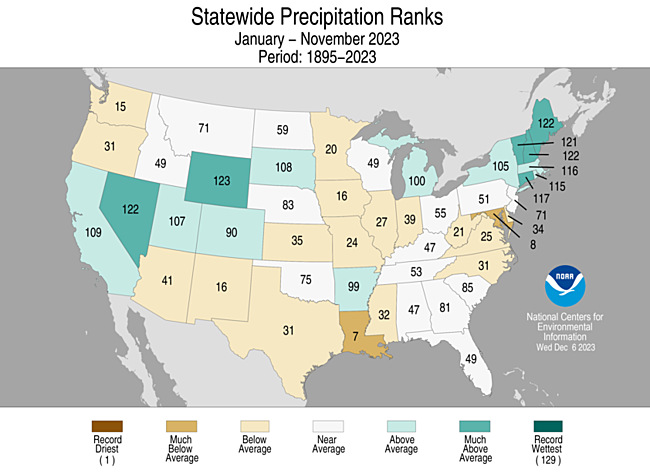
The January-November precipitation total for the contiguous U.S. was 26.89 inches, 0.70 inch below average, ranking in the driest third of the 129-year record.
Precipitation was near to above average across much of the Northeast, from the northern Plains to the West Coast, as well as in parts of the central and southern Plains, northern Great Lakes, Lower Mississippi Valley and Southeast. Wyoming ranked seventh wettest January-November period on record, while four additional states ranked among their top-10 wettest for this year-to-date period.
Conversely, precipitation was below average from parts of the Southwest to the Gulf of Mexico and in parts of the Northwest, upper and central Mississippi Valley and Mid-Atlantic during the January–November period. Louisiana and Maryland ranked seventh and eighth driest on record, respectively, for this 11-month period.
The January-November precipitation ranked ninth wettest in the 99-year record for Alaska, with above-average precipitation observed across most of the state. Near-normal precipitation was observed in parts of the Southwest, while parts of the Aleutians experienced below-average precipitation during this period.
Extremes
The U.S. Climate Extremes Index (USCEI) for the year-to-date period was 36 percent above average, ranking in the upper third of the 114-year period of record. Extremes in warm maximum temperatures and warm minimum temperatures were the major contributors to this elevated CEI value. The USCEI is an index that tracks extremes (occurring in the upper or lower 10 percent of the record) in temperature, precipitation and drought across the contiguous United States.
On the regional scale, extremes across the Upper Midwest and Ohio Valley were above average while the Northeast, Southeast and South ranked much-above average for this year-to-date period. Each of these regions experienced elevated extremes in warm maximum temperatures and warm minimum temperatures. The Northeast also experienced extremes in the number of days with precipitation, 1-day precipitation extremes and wet PDSI values, while the South also experienced elevated extremes in 1-day precipitation and dry PDSI values.
Monthly Outlook
According to the November 30 One-Month Outlook from the Climate Prediction Center, above-normal monthly average temperatures in December are favored for much of the contiguous U.S. and parts of northern Alaska in December, with the greatest odds across parts of the Mississippi River Valley. Below-normal temperatures are most likely for parts of Southwest Alaska this month. Pacific Northwest and parts of the central and southern Plains to the East Coast, as well as eastern Alaska are favored to see above-normal monthly total precipitation while below-normal precipitation is most likely to occur for parts of North Dakota to northern Michigan. Drought improvement or removal is forecast along parts of the Pacific Northwest coast, for parts of the central and southern Plains, Hawaii, and in parts of the Southeast and Mid-Atlantic. Persistence is more likely across much of the Northern Tier, Southwest and upper Midwest.
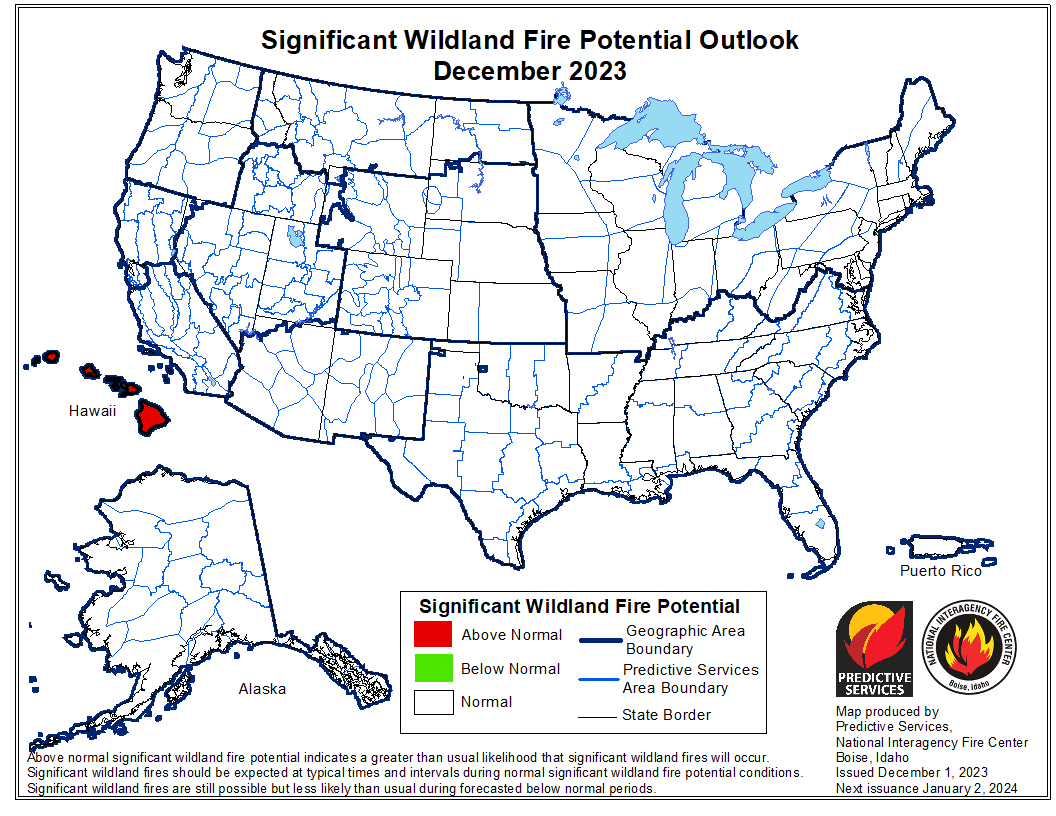
According to the One-Month Outlook issued on December 1 from the National Interagency Fire Center, the islands of Hawaii have above-normal significant wildland fire potential during the month of December.
Regional Highlights
These regional summaries were provided by the six Regional Climate Centers and reflect conditions in their respective regions. These six regions differ spatially from the nine climatic regions of the National Centers for Environmental Information.
Northeast (Information provided by the Northeast Regional Climate Center)
A cool, dry November wrapped up an otherwise warm, mostly dry autumn.
Temperature
The Northeast’s average temperature for November was 37.8 degrees F, 1.6 degrees F cooler than normal. All twelve Northeast states saw below-normal November average temperatures, which ranged from 2.5 degrees F below normal in Rhode Island to 0.7 degrees F below normal in West Virginia. Driven by warmer-than-normal conditions in September and October, the Northeast recorded its 12th warmest autumn since records began in 1895. The region’s average temperature of 51.8 degrees F was 1.4 degrees F above normal. For the 12 Northeast states, autumn average temperatures ranged from 0.5 degrees F above normal in West Virginia to 2.7 degrees F above normal in Maine. This autumn ranked among the 20 warmest on record for 10 of the states: Maine, fourth warmest; New Hampshire, sixth warmest; Massachusetts, seventh warmest; Vermont, eighth warmest; Connecticut and Rhode Island, 12th warmest; New York, 14th warmest; Maryland and New Jersey, 17th warmest; and Delaware, 19th warmest.
Precipitation
November was a drier-than-normal month for the Northeast, which saw 2.34 inches of precipitation or 68 percent of normal. Below-normal November precipitation was recorded in all 12 Northeast states, ranging from 49 percent of normal in Massachusetts to 85 percent of normal in Maryland. November 2023 ranked among the 20 driest Novembers on record for five of the states: Massachusetts, 15th driest; New Hampshire and Rhode Island, 19th driest; and Connecticut and Maine, 20th driest. While the region saw near-normal September precipitation, October and November landed on the dry side of normal. With that, autumn was also drier than normal with 10.08 inches of precipitation, 86 percent of normal. Autumn precipitation for the 12 Northeast states ranged from 73 percent of normal in West Virginia to 12 percent of normal in Connecticut, with eight states being drier than normal.
Drought
The U.S. Drought Monitor from October 31 showed less than one percent of the Northeast in severe drought, two percent in moderate drought, and 15 percent as abnormally dry. Below-normal precipitation, decreased streamflow and groundwater levels, and reduced soil moisture were a few factors that led to deteriorating conditions in the Northeast during November. Severe drought crept into eastern West Virginia and central Maryland, while moderate drought expanded in those states plus Pennsylvania and New York. Abnormal dryness also expanded in the Mid-Atlantic and New York and was introduced in southeastern Massachusetts. The U.S. Drought Monitor from November 28 showed less than one percent of the Northeast in severe drought, six percent in moderate drought, and 19 percent as abnormally dry. At times during November, USGS 7-day average streamflow and/or groundwater levels were below normal or lower in western and central New York, northwestern Pennsylvania, and an area from eastern West Virginia through Maryland and southern Pennsylvania into northern Delaware and southern New Jersey, with a couple of gauges reporting record low flows or levels. Water conservation was encouraged in several of these areas, with mandatory water use restrictions implemented or continuing in parts of Maryland including Emmitsburg and Myersville and Pennsylvania including in York County. The Interstate Commission on the Potomac River Basin issued a special Water Supply Outlook in early November due to ongoing dry conditions in the basin. Drought monitoring operations on the river continued upstream from Washington, D.C. through much of November. Wells ran dry for at least 100 homes, as well as some businesses and farms, in part of western New York. Some residents utilized fill stations in neighboring communities or tanker trucks that were brought in to then haul water to their homes, with a dairy farm trucking in 60,000 gallons a day for its cows. Low water levels in ponds and creeks in western New York have also affected rural firefighting operations. Dry conditions increased fire danger during West Virginia’s fall fire season and contributed to multiple wildfires, including one in the New River Gorge National Park and Preserve that burned over 2,000 acres. Similar conditions were found in Virginia, which saw multiple large wildfires. Smoke from these fires produced poor air quality and smoky skies in parts of the Northeast, particularly mid-month as drought conditions generally peaked in that state.
Notable Weather
November was a relatively quiet month in terms of storm activity as evidenced by drier-than-normal conditions for most of the Northeast. However, the season’s first major lake-effect snow event occurred from November 27 to 29, producing up to 46 inches of snow east of Lake Ontario and up to 23 inches of snow east of Lake Erie. The National Weather Service cooperative station named Highmarket, east of Lake Ontario, picked up 46.2 inches of snow, including a two-day total of 42.7 inches, its ninth greatest two-day snow total with sporadic records to 1924. The site’s monthly total was 49.6 inches, making it the site’s fifth snowiest November on record.
For more information, please visit the Northeast Regional Climate Center Home Page.
Midwest Region (Information provided by the Midwest Regional Climate Center)
Temperature
The average November temperature for the Midwest was 39.3 degrees F (4.1 degrees C), which was 0.8 degrees F (0.5 degrees C) above the 1991-2020 normal. Temperatures were normal to slightly below normal in the east, warming to 1-5 degrees F (0.6-2.8 degrees C) above normal in the west. Preliminary statewide average temperatures ranged from 0.7 degrees F (0.4 degrees C) below normal in Ohio to 2.3 degrees F (1.3 degrees C) above normal in Minnesota. The average fall (September-November) temperature for the Midwest was 1.9 degrees F (1.1 degrees C) above normal, with the western Midwest 1-4 degrees F (0.6-2.2 degrees C) above normal and temperatures near to slightly above normal in the east.
Precipitation
November precipitation totaled 0.93 inches (24 mm) for the Midwest, which was 1.61 inches (41 mm) below normal, or 37 percent of normal. Preliminary rankings indicate the Midwest had the 5th driest November dating back to 1895. Dry conditions affected the entire region, with a large swath of the south-central Midwest achieving 2-4 inches (51-102 mm) of precipitation deficits. Preliminary statewide precipitation totals ranged from 0.75 inches (19 mm) below normal in Michigan to 2.57 inches (65 mm) below normal in Indiana. Preliminary rankings indicate Indiana had the 3rd driest November on record, while Illinois, Iowa, and Missouri all had the 8th driest. Several long-running weather stations across the region had a top five driest November, including Pipestone-MN (1st), Collegeville-MN (1st), Minneapolis-MN (2nd), Paducah-KY (4th), Fort Wayne-IN (5th), and South Bend-IN (5th). Fall (September-November) precipitation for the Midwest totaled 6.4 inches (163 mm), which was 2.66 inches (68 mm) below normal.
Drought
Drought conditions expanded during November, with the most notable increases in severity and extent across the lower Midwest. The month concluded with about 74 percent of the Midwest affected by dryness or drought, up nearly 10 percent from the start of the month. Locations across southern Missouri, Illinois, and Kentucky had 2-3 class degradations on the US Drought Monitor map during November. Drought persisted along and west of the Mississippi River, with a wide swath of extreme (D3) drought parked over eastern Iowa.
Snow
Snowfall ranged from less than 1 inch (2.5 cm) to over 15 inches (38.1 cm) across the Upper Midwest during November, with lake-effected areas in Michigan and northeast Ohio measuring the highest amounts. Totals were within a few inches of normal for most locations across the Great Lakes, except along the south shore of Lake Superior where snowfall was 5-25 inches (12.7-63.5 cm) below normal for the month. Central Minnesota, which typically receives about 5-10 inches (12.7-25.4 cm) of snow in November, had a half-inch or less for the month. Most of the lower Midwest had no measurable snow during November, which is fairly typical for this time of year.
For further details on the weather and climate events in the Midwest, see the weekly and monthly reports at the Midwest Climate Watch page.
Southeast (Information provided by the Southeast Regional Climate Center)
Temperature
Mean temperatures were variable across the Southeast in November. Temperatures were slightly below average across much of Virginia, central and eastern portions of North Carolina, southern portions of Alabama and Georgia, and northern Florida, with some locations over 2 degrees F (1.1 degrees C) below average. In contrast, temperatures were 1 to 2 degrees (0.5 to 1.1 degrees C) above average across northern and central portions of Alabama and Georgia, western North Carolina, eastern South Carolina, southern Georgia, and much of the Florida Peninsula, with some locations between 3 and 4 degrees (1.6 and 2.2 degrees C) above average. Miami, FL recorded its fourth warmest November on record (since 1895). Temperatures were also above average across Puerto Rico and the U.S. Virgin Islands. San Juan, PR and Henry Rohlsen Airport on Saint Croix recorded their warmest November on record (since 1898 and 1951, respectively). Cyril King Airport on Saint Thomas also recorded its fifth warmest November on record (since 1953). The maximum temperature at Rohlsen Airport reached 92 degrees F (33.3 degrees C) on the 3rd, 4th, and 5th, which was 1 degree F (0.5 degrees C) shy of its highest maximum temperature for any November day on record. The month began with freezing temperatures extending down to the Florida Panhandle. On the 2nd, Crestview, FL recorded a minimum temperature of 26 degrees F (-3.3 degrees C), while nearby Geneva, AL recorded a minimum temperature of 25 degrees F (-3.9 degrees C). Unseasonably warm weather returned the following week, with mean temperatures running between 10 and 20 degrees F (5.6 and 11.1 degrees C) above average across much of the region from the 8th to the 10th. Generally above average temperatures persisted through the middle of the month, particularly across the interior of the region, while below average temperatures were observed across the northern tier. November ended with more chilly weather, as mean temperatures were 5 to 15 degrees F (2.8 to 8.3 degrees C) below average across much of the region from the 25th to the 30th. Minimum temperatures dropped below 10 degrees F (-12.2 degrees C) across higher elevations of the Southern Appalachians, and below 20 degrees F (-6.7 degrees C) across central portions of North Carolina, with freezing temperatures reaching the Florida Panhandle on the 29th and 30th.
Precipitation
Monthly precipitation was below average across much of the Southeast, except Florida. The driest locations were found across central Alabama, northern and southern portions of Georgia, and western portions of the Carolinas, where many locations recorded less than half of their expected precipitation for the month. Several locations ended long streaks of consecutive dry days during the month. On the 11th, Daytona Beach, FL ended a streak of 31 consecutive days without measurable precipitation, while Gainesville, FL and Tallahassee, FL ended streaks of 32 consecutive days on the 12th. Precipitation was also below average across Puerto Rico and the U.S. Virgin Islands. Cyril King Airport on Saint Thomas recorded its fifth driest November on record (since 1953) with 1.25 inches (32 mm), which is just 20 percent of normal. In contrast, precipitation was above average across the Florida Peninsula, Florida Keys, and the eastern half of the Florida Panhandle. Much of this precipitation fell between the 15th and 16th of the month as a low pressure system slowly tracked across the southern and central portions of the state. Precipitation totals ranged from between 4 and 8 inches (102 and 203 mm) across much of the Florida Keys and central portions of the Peninsula, to as much as 12 inches (305 mm) across parts of South Florida. Marathon Key recorded its wettest November day on record (since 1950) with 6.68 inches (170 mm) on the 15th. Several other locations observed one of their top 5 wettest November days on record, including Daytona Beach, Orlando, Fort Lauderdale, and Miami. For the month, Fort Lauderdale recorded 11.23 inches (285 mm) of precipitation, making it the third wettest November on record (since 1912). Winter precipitation was also recorded at the beginning and end of the month. Trace amounts of snow fell across western portions of Virginia and North Carolina on the 1st and 2nd. Parts of northwestern Virginia recorded just under half of an inch of snow on the 10th and 23rd, while up to an inch of snow was recorded across the higher elevations of North Carolina between the 27th and 29th of the month.
Drought
Drought conditions worsened in some locations yet improved in others, yielding relatively little overall change across the Southeast. Extreme (D3) drought expanded across northern portions of Alabama and Georgia and into southwestern North Carolina. Areas of moderate (D1) and severe (D2) drought also expanded across the interior of the region from northern Georgia through western Virginia. A small area of moderate (D1) to extreme (D3) drought persisted across the West Coast of Florida, while small areas of moderate (D1) drought emerged across eastern portions of Virginia. On the other hand, drought conditions improved from extreme (D3) to severe (D2) and moderate (D1) drought across the Shenandoah Valley of Virginia and along the northern Gulf Coast, while small areas of abnormal dryness (D0) and moderate (D1) drought were eliminated across eastern portions of the Carolinas. In the Caribbean, a small area of moderate (D1) drought persisted in northwest Puerto Rico, while pockets of abnormal dryness (D0) persisted in the eastern interior and south coastal parts of the island. Severe (D2) drought persisted on Saint Thomas but improved to moderate (D1) drought on Saint Croix. Saint John remained drought-free.
Agriculture
The lack of precipitation and multiple waves of cool temperatures negatively affected many crops across the region. The most notable impacts included delayed harvesting of peanuts due to hard soils, delayed planting and germination of winter crops, particularly small grains, and reduced pasture growth, resulting in hay shortages and supplemental feed for cattle and livestock. Pecan production was also down in Georgia due in part to a combination of unfavorable weather conditions, including a late spring freeze, hurricane activity, extreme heat, and drought. On the other hand, recent precipitation improved pasture conditions in parts of Georgia and northern Florida and helped in the planting of winter crops and small grains. However, some areas received too much rain, resulting in flooded fields, increased disease pressures, and delayed field work.
Notable Weather
There were just eight reports of severe weather across the Southeast in November, which is below the median monthly frequency of 45 reports over the period 2000 to 2022 (18 percent of normal). There were three confirmed tornadoes, which is below the median frequency of 10 (30 percent of normal). On the 15th, an EF-0 tornado touched down on the island of Big Pine Key, located about halfway between Marathon and Key West, FL. Damage included torn siding, twisted fencing, and downed trees. The other two tornadoes touched down on the 21st of the month. The first tornado, an EF-1, touched down in Geneva County in southeast Alabama. Numerous trees were snapped and uprooted and a few outbuildings sustained significant damage. The second tornado, an EF-0, briefly touched down in Chester County in the Upstate of South Carolina and resulted in minor tree damage. No fatalities or injuries were reported. There were six wind reports in November, which is below the median frequency of 33 (18 percent of normal). In addition, strong winds were observed across Florida in association with the low pressure system in the middle of the month. Gusts were generally between 40 and 50 mph (18 and 22 m/s) on the 15th and 16th, though some exceeded 60 mph (27 m/s) across central Florida, 70 mph (31 m/s) across South Florida, and 80 mph (36 m/s) across the Florida Keys. One of the more notable impacts was a power outage that led to the deflation of the roof of the SoFi Center, a 250,000 square foot recreational facility under construction in Palm Beach Gardens. The resulting structural damage has delayed the launch of a new professional golf league which will utilize the facility beginning in 2025. The only hail report in the region occurred on the 22nd with pea-sized stones (0.25 inches or 6.4 mm) near the town of Summerville in coastal South Carolina. The warm and dry weather during the month contributed to dozens of wildfires across the region. Of note was the Matts Creek fire in northern Virginia, which burned over 11,000 acres and resulted in reduced visibility and air quality along the I-81 corridor during the latter half of the month.
For more information, please visit the Southeast Regional Climate Center Home Page.
High Plains (Information provided by the High Plains Regional Climate Center)
In a similar pattern to October, warmer temperatures dominated until a late-month shot of cool air and snow on Thanksgiving weekend led to serious impacts. Outside of the heavy snowfall in some places associated with this system, the region was extremely dry. The Thanksgiving weekend storm impacted at the worst possible time during the peak of traveling. Hundreds of wrecks occurred, with over 400 reported in the state of Kansas alone. Cities like Manhattan, Topeka, and Wichita all received more snowfall in one storm than the entirety of last year. The last time Wichita received this much snow in a single November storm was over 100 years ago in 1906. In Nebraska, three people died in separate crashes in the central part of the state, and over 100 wrecks were reported in the city of Lincoln alone. Further west, Wyoming experienced numerous wrecks after over 20 inches (50.8 cm) of snow fell in some places. Denver International Airport was significantly impacted once again, with over 1,500 flights delayed during a weekend where nearly 700,000 people were traveling through the airport.
Temperature
Outside of the Thanksgiving weekend cooldown, November was the conclusion of a very warm fall for the High Plains. Nearly the entire region was warmer than normal, with some locations over 6 degrees F (3.3 degrees C) above their normal temperature for both the month and the entire fall season. Until the 22nd, much of the lower part of the region was on track to rank in the top five warmest Novembers until a brutally cold front pushed through. Temperatures reached up to 93 degrees F (33.9 degrees C) outside of Tribune, Kansas on the 8th, which tied for the 4th warmest temperature in November for Kansas. While temperatures did cool off from these record highs, they remained well above normal. Similar to October, a late month shot of cold air shocked the region. Temperatures plummeted across the High Plains, with the thermometer bottoming out at –20 degrees F (-28.9 degrees C) in Creede, Colorado on the 27th.
Precipitation
Besides the thanksgiving weekend storm, precipitation was hard to come by this month, with only isolated areas receiving above-normal amounts. Much of the region was below 25 percent of their average, with pockets of below 5 percent present. The dryness resulted in multiple places ranking in the top 5 driest, with some recording their driest November. Bone-dry conditions have plagued much of Colorado and western Kansas this entire fall. Record wetness towards the end of spring has given way to drier conditions since then. Goodland, Kansas only received 0.66 inches (16.76 mm) of precipitation this fall to rank 4th driest. Just across the state line, no precipitation was recorded in some parts of Yuma County. Further south in Colorado, Alamosa only received trace amounts to tie for 3rd place. Precipitation also flipped drastically in the Dakotas this month. Sioux Falls, South Dakota received 3.05 inches (7.75 cm) in September and October, only to observe 0.01 inches (0.254 mm) in November to rank 4th driest. The highest amount recorded in both states was just over one inch (2.54 cm), a far cry from nearly 7 inches (17.78 cm) for parts of South Dakota in October. The Thanksgiving weekend storm wreaked havoc and brought large quantities of snow, particularly in Kansas. A large band of over 9 inches (22.86 cm) of snow fell from Pratt to Junction City, with 14.1 inches (35.81 cm) observed in Marion. Outside of Kansas, Wyoming experienced isolated areas of extremely heavy snowfall. The city of Lander in the west-central part of the state recorded 22.9 inches (58.17 cm) of snow that weekend, which also led the city to record its snowiest month. 18.8 inches (47.75 cm) of that fell on the 23rd which was the highest single day total since 1999. A CoCoRaHS observer outside of town observed even higher snow totals, with a whopping 27.6 inches (70.1 cm) over a two-day period.
Drought
The dryness this month took its toll, with a sizeable increase in drought conditions in the southern High Plains. Snowfall late in the month in eastern Kansas was too late to improve conditions in November. Overall, abnormally dry to exceptional drought (D0-D4) conditions were increased by over 6 percent. Colorado was the driest in the region and, as a result, experienced a 21 percent increase in D0-D4. Extreme drought (D3) was also reintroduced in the state for the first time since May of this year. Conditions also continued to deteriorate in Kansas, with close to 90 percent of the state in D0-D4. Soil conditions in the state are less than ideal, especially heading into the winter months.
For more information, please visit the High Plains Regional Climate Center Home Page.
South (Information provided by the Southern Regional Climate Center)
Dry conditions led to severe impacts from ongoing and degrading drought across southeast Texas, Louisiana, southeastern Arkansas, Mississippi, and Tennessee.
Temperature
Temperatures were near normal across much of the Southern Region during November. Stations across the region were typically within two degrees F of normal. The exceptions to this included the Texas and Oklahoma Panhandles where temperatures were three to five degrees above normal, the northern tier of the region where temperatures were two to three degrees above normal, and the southern Gulf Coast of Texas where temperatures were two to three degrees below normal. Statewide averages were above their median values for much of the region: Oklahoma (30th warmest, out of 129 years), Tennessee (32nd warmest), Arkansas (40th warmest), the Southern Region as a whole (42nd warmest), Mississippi (36th warmest), and Texas (47th warmest). Louisiana was near its historical median value for November. The warmest recorded temperature in the region was 95 F near Childress, Texas and at Rio Grande Village, Texas both on November 8th. The coldest recorded temperature in the region was 7 F at Mt Leconte, Tennessee on November 2nd. The coldest recorded lowland temperature in the region was 10 F at both Gruver, Texas and near Goodwell, Oklahoma on November 26th and 25th respectively. Eleven long-term stations in the Southern Region set records for highest maximum temperature during November, with Keiser, Arkansas (92F, November 8th) and Pampa, Texas (91F, November 8th) both beating their previous records by three degrees F. No station set a record for lowest minimum temperature for November.
Precipitation
Precipitation in the Southern Region during November was generally below normal with isolated areas of well above normal precipitation. Areas that experienced well above normal precipitation include extreme north-central Oklahoma and far west and deep south Texas where November precipitation was 130 to 300 percent of normal. State totals for the Southern Region were all below normal for November: Tennessee (15th driest, out of 129 years), Arkansas (22nd driest), the Southern Region as a whole (22nd driest), Louisiana (32nd driest), Mississippi (33rd driest), Oklahoma (35th driest), and Texas (44th driest). One station exceeded eight inches of precipitation for the month of November: a CoCoRaHS station near Premont, Texas (8.24 inches). Three stations had single-day accumulations exceeding four inches, all in Texas: near Victoria (5.27 inches, November 10th), Houston NWSO (4.39 inches, November 30th), and near Premont, Texas (4.1 inches, November 10th). No stations set single-day accumulation records for November. There were three stations in Texas that received no measurable precipitation during the month of November: Plains, near Adrian, and Reese Center.
Drought/Flooding
During November the Southern Region saw continued drought and degradation of drought conditions across much of Louisiana, Mississippi, Tennessee, and southeastern Arkansas. Louisiana is particularly hard hit with 71 percent of the state being in Exceptional Drought as of November 28th. Texas on the other hand saw broad improvement of drought conditions across the state with many areas one to two classes of improvement in drought status, though drought persists in central Texas and southeast Texas. Areas experiencing Extreme or Exceptional Drought, according to the US Drought Monitor, across the Southern Region decreased by 2% from October 31st (24 percent) to November 28th (22 percent). Soil moisture rankings, according to the Climate Prediction Center, over the areas experiencing drought were well below the historical 30th percentile values for November and across southern Louisiana and southwestern Mississippi were in the 1st percentile. Ongoing and worsening dry conditions led to wildfires in Tennessee and reported tree deaths in Mississippi, Louisiana, and southeast Texas. Particularly striking were reports of livestock fatalities in Mississippi where cattle became trapped in soil fissures that had opened due to dry conditions. Low flows on the Mississippi River are impacting barge traffic, making grain transport more expensive and requiring expensive and time-intensive dredging to make transit possible.
Notable Weather
The close of November marks the end of the 2023 Atlantic Hurricane season, which was a quiet one for the Southern Region. Only one landfalling tropical system affected the Southern Region: Tropical Storm Harold, in August. November was a quiet month for severe weather in the Southern Region. There were eleven tornados in November, affecting only Louisiana and Mississippi. Four of these were rated as EF0 and seven were rated as EF1. No injuries or fatalities were reported with these tornadoes. There were three reports of hail in the Southern Region, with the largest reported hail being 1.75 inches near Clayton, Louisiana late on November 20th. There were 16 severe wind reports, with the fastest being 60 mph near Hazlehurst, Mississippi early on November 21st.
For more information, please visit the Southern Regional Climate Center Home Page.
West (Information provided by the Western Region Climate Center)
This November warm records were broken in central California and Alaska with above average temperatures also occurring in New Mexico and Arizona. No areas in the western United States experienced below average temperatures. Most of the western United States recorded average temperatures and precipitation totals, except for Montana which experienced record dry conditions and a few sporadic locations experiencing record dryness or record precipitation totals. Alaska also received a variety of record dryness and record wetness across the state.
Temperature
Most states recorded average temperatures for the month of November. However, many areas in Montana had warmer temperatures 3 to 6 degrees Fahrenheit above normal and central California recorded areas of record and near record warmth. Some notable locations in California were San Francisco, which set a new November record at 60.4 degrees Fahrenheit (4 degrees Fahrenheit above average), San Jose, which recorded its second warmest at 60 degrees Fahrenheit (4 degrees Fahrenheit above average), and Oakland with its third warmest (3 degrees Fahrenheit above average). Arizona and New Mexico also recorded warmer than average temperatures with some locations 3 to 4 degrees Fahrenheit above average. Some of these notable locations were Casa Grande, AZ (3 degrees Fahrenheit above average), Phoenix, AZ (4 degrees Fahrenheit above average), Tucson, AZ (4 degrees Fahrenheit above average), Redrock, NM (3 degrees Fahrenheit above average), and Deming, NM (3 degrees Fahrenheit above average). Also notable was the lack of below average temperatures in the western United States with no locations having near record low averages.
Precipitation
The month of November was marked with most of the western United States recording average or below average precipitation totals. Montana, especially, set record and near record low precipitation totals. Helena, MT recorded only 0.02 inches of precipitation, 97% below their average monthly precipitation of 0.59 inches to have their second driest November in their 141-year record. Both Livingston, MT and Broadus, MT tied their driest November records with Livingston getting 0.06 inches (90% below 0.62 inches normal), and Broadus receiving zero inches (0.47 inches less than average). A few other notable locations that received below average precipitation totals were Dillon, MT (0.36 inches below average), Baker, OR (0.71 inches below average), and Death Valley, CA (0.1 inches below normal to tie record driest). For above average precipitation totals, only a few locations in the western United States received events that made their totals above normal. Panguitch, UT recorded a new precipitation record for November at 3.6 inches (2.93 inches above average), five times their normal. Additionally, Burley, ID recorded 2.02 inches (1.22 inches above average), and Zuni Pueblo, NM received 1.83 inches (1.17 inches above average).
Drought
According to the U.S. Drought Monitor at the end of November, 28 percent of the western United States is under drought conditions. This is a 3 percent decrease from October. Drought conditions improved in the Pacific Northwest and Montana but degraded in northern New Mexico. Areas of extreme (D3) and exceptional (D4) drought are occurring in New Mexico and Arizona. Moderate (D1) to severe (D2) are occurring in Utah, Montana, Idaho, Oregon, and Washington.
Alaska Summary
Temperatures were warmer than average reaching record to near record normal over most of the state. Circle received its warmest November on record at 10.2 degrees Fahrenheit (14.3 degrees Fahrenheit above average). Additionally, warmer averages were reached in Fairbanks (12 degrees Fahrenheit above average), Tanana (11 degrees Fahrenheit above average), and Sitka (4 degrees Fahrenheit above average). For precipitation, Alaska measured vast differences with South-central and the Southeast Inside Passage recording above average totals and the Interior and Far North receiving below average totals. For below average, Tanana (0.56 inches below average) and Northway (0.51 inches below average) both tied their driest Novembers recording zero inches. On the other hand, Anchorage recorded its wettest November in its 71-year period of record receiving 3.44 inches (2.25 inches above average). This was due to a record 39.3 inches of November snowfall, over three times the normal of 12.6 inches. A big contributor to this was November 8th when 9 inches of snow fell in a 24-hour window, which is the 4th largest daily snowfall total for the month of November in the station’s history.
Hawaii Summary
Most of Hawaii recorded average temperatures and precipitation for the month of November. Only Kahuku on O’ahu was warmer than average by 1.0-degree Fahrenheit. Most importantly, only slight improvement has been made to Hawaii’s drought conditions. Hawaii has decreased from 100 percent of the state in at least abnormally dry conditions to only 96 percent, but 94 percent of the state remains in drought conditions. Three-fourths of this total is in at least severe drought (D2) or higher. Regions of extreme drought (D3) persist for the Big Island, Maui, Moloka’i, and O’ahu. No areas are currently under exceptional drought (D4).
Notable Weather
Anchorage records snowiest November since records began in 1953: 39.3 inches of snowfall fell this month in Anchorage, AK. This broke the previous record of 38.8 inches set in 1994. Most of the snowfall fell in consecutive storms and compacted on main roadways due to its heavy and wet nature. High winds and temperatures a few days later led to icy conditions that caused traffic incidents and delayed travel times. The heavy snow also led to several power outages in the Anchorage area.
For more information, please go to the Western Regional Climate Center Home Page.