Monthly Report Summary Information
The Monthly Report Summary Information is a synopsis of the collection of national and global summaries released each month.
National Summary Information - November 2015
See Full Report
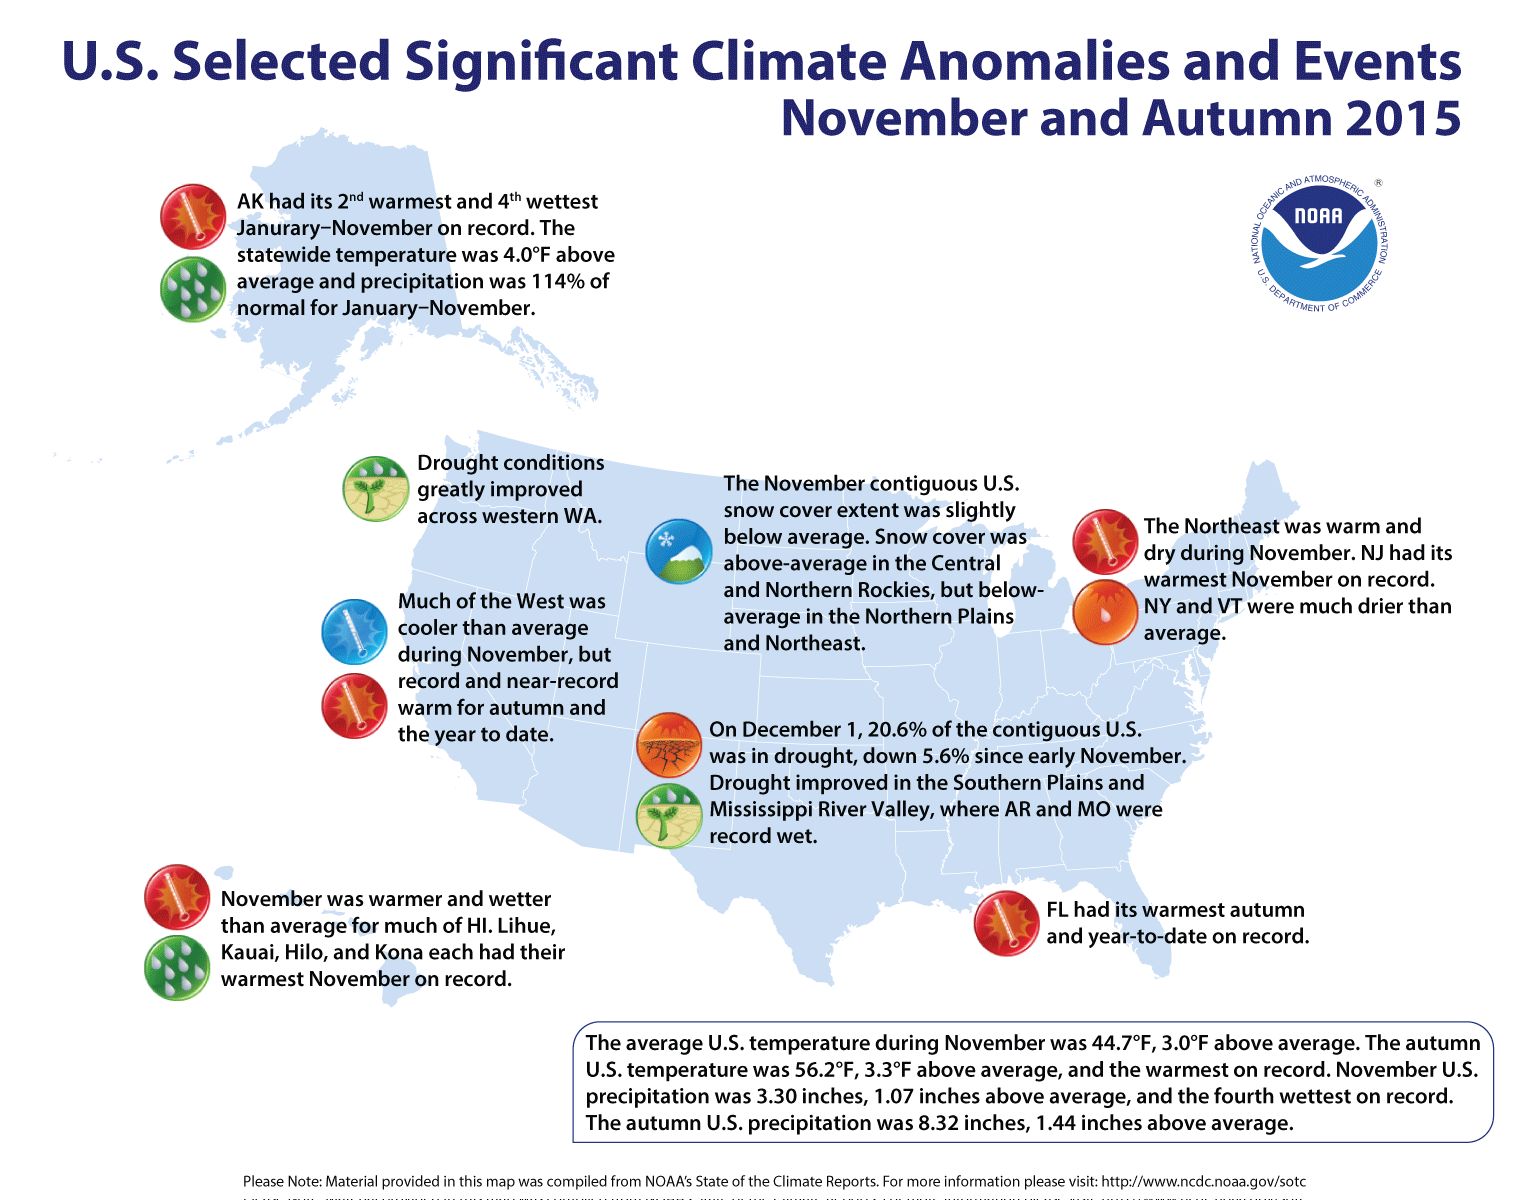
Significant climate events for November 2015
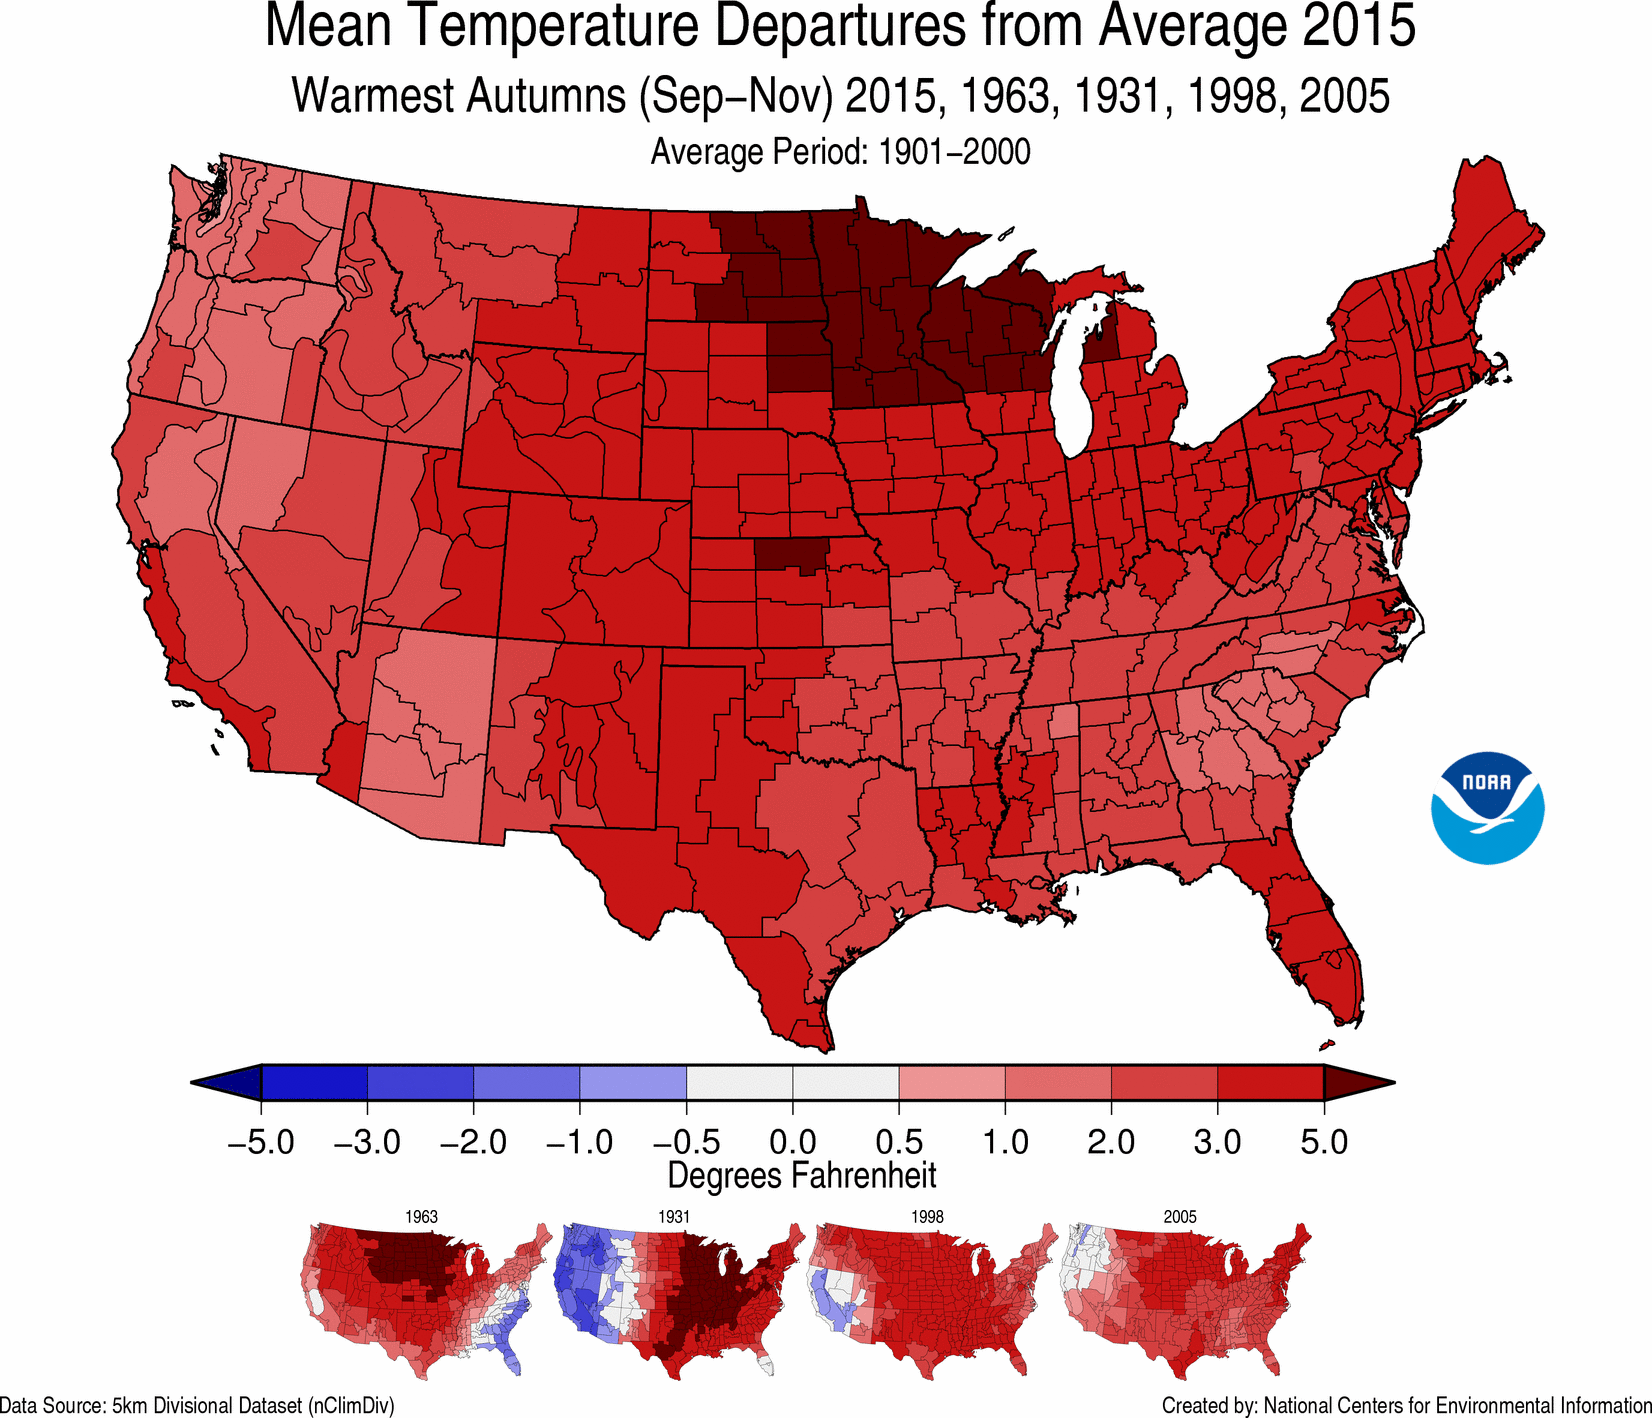
Autumn was record warm for the Contiguous US
First eleven months of 2015 were the fifth warmest for the Lower 48.
The September-November contiguous U.S. average temperature was 56.8°F, 3.3°F above the 20th century average, surpassing the previous record of 56.6°F set in 1963. Record and near-record warmth spanned much of the nation. The November contiguous U.S. temperature was 44.7°F, 3.0°F above the 20th century average and the 13th warmest in the 121-year period of record.
The autumn precipitation total for the contiguous U.S. was 8.32 inches, 1.44 inches above the 20th century average. This was the 15th wettest September-November on record for the Lower 48 and the wettest since 2004. The November precipitation total was the fourth wettest on record with 3.30 inches, 1.07 inches above average. Record and near-record precipitation was observed across the Great Plains and Southeast.
This analysis of U.S. temperature and precipitation is based on data back to January 1895, resulting in 121 years of data.
U.S. climate highlights: Autumn (September-November)
Temperature
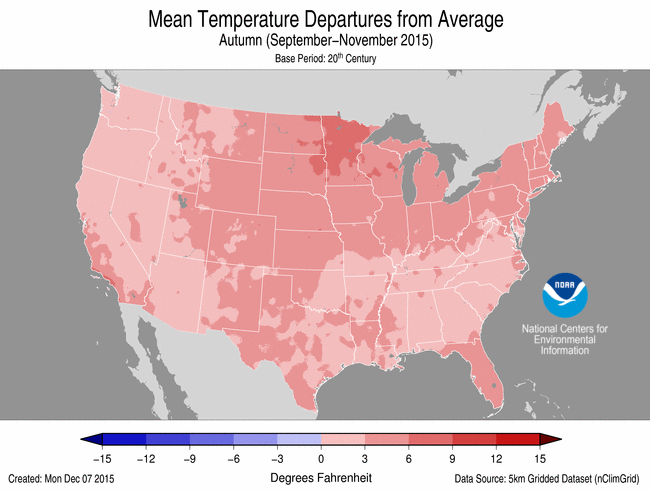

November 2015 Temperature Departure from Average
(top) and Precipitation Departure from Average (bottom)
- Every state across the contiguous U.S. and Alaska had an above-average autumn temperature. Forty-one states across the Rockies, Great Plains, Midwest, Northeast, and Southeast were much warmer than average. Florida tied its warmest autumn on record with a statewide temperature of 75.5°F, 3.6°F above average.
Precipitation
- Above-average autumn precipitation was observed across parts of the West, Southern Plains, and Southeast. South Carolina had its wettest autumn on record, partially driven by historic rainfall in early October. South Carolina's autumn precipitation total was 23.62 inches, 13.77 inches above average, and bested the previous record of 18.42 inches set in 1959.
- Below-average autumn precipitation was observed along the West Coast and New England. California, Connecticut, Oregon, and Wyoming were each drier than average for the three-month period.
Extremes
- The U.S. Climate Extremes Index (USCEI) for autumn was 50 percent above average and the 10th highest value on record. On the national scale, extremes in warm maximum and minimum temperatures and one-day precipitation totals were much above average. The USCEI is an index that tracks extremes (falling in the upper or lower 10 percent of the record) in temperature, precipitation, land-falling tropical cyclones, and drought across the contiguous United States
U.S. climate highlights: November
Temperature

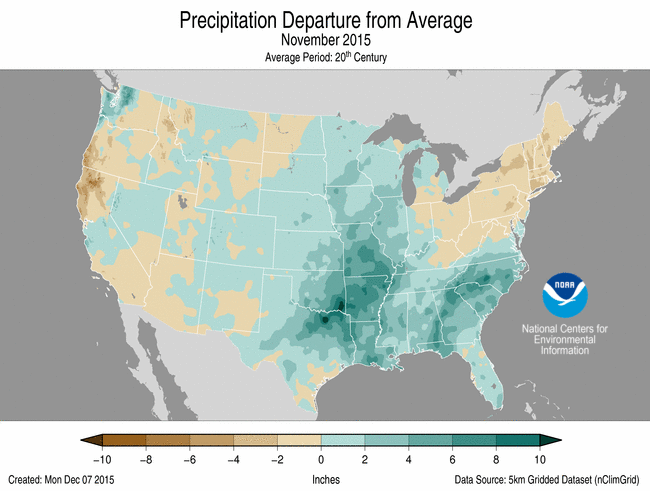
November 2015 Temperature Departure from Average
(top) and Precipitation Departure from Average (bottom)
- Above-average November temperatures were widespread across the eastern half of the nation, where 32 states were much warmer than average. New Jersey had its warmest November on record with a statewide temperature of 49.7°F, 6.6°F above average.
- Below-average temperatures were observed across the West where Arizona, California, Idaho, Nevada, Oregon, and Utah were each cooler than average.
Precipitation
- Above-average November precipitation was observed across much of the Great Plains, Midwest, and Southeast. Eleven states were much wetter than average in these regions. Arkansas and Missouri were record wet. The Arkansas precipitation total was 10.65 inches, 6.36 inches above average. The Missouri precipitation total was 7.86 inches, 4.95 inches above average.
- Below-average precipitation fell across the Northeast. New York and Vermont were much drier than average.
- According to the December 1st U.S. Drought Monitor report, 20.6 percent of the contiguous U.S. was in drought, down about 5.6 percent compared to the beginning of November. Drought conditions improved across parts of the Southern Plains and the Mid- to Lower Mississippi River Valley. Drought conditions also improved greatly across western Washington where an earnest start to the wet season brought much needed precipitation. Drought continues to plague interior regions of the Northwest and much of California and Nevada.
U.S. climate highlights: year-to-date (January-November)
Temperature
November 2015 Temperature Departure from Average
(top) and Precipitation Departure from Average (bottom)
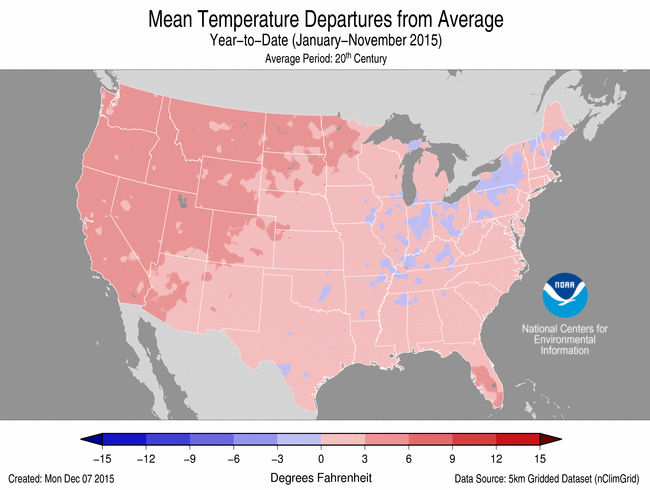
- The year-to-date contiguous U.S average temperature was 55.8°F, 2.1°F above average, the fifth warmest on record. This was the warmest year-to-date since 2012. Above-average temperatures were observed in the West, Northern Plains, and Southeast. Overall, 17 states, including Alaska, were much warmer than average. Florida, Nevada, Oregon, and Washington were each record warm. Near-average temperatures were observed in the Midwest and Northeast.
Precipitation
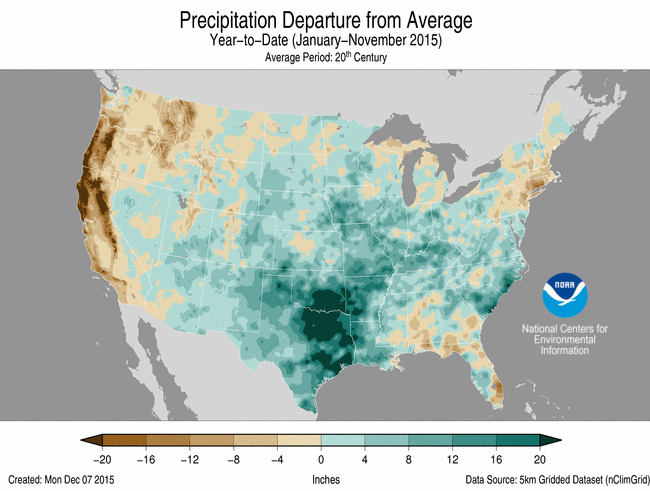
- The year-to-date precipitation total for the contiguous U.S. was 30.48 inches, 2.89 inches above average, and the ninth wettest on record. Above-average precipitation was observed across the central and southeastern U.S., where nine states were much wetter than average. Oklahoma had its wettest year-to-date with 48.00 inches of precipitation, 15.89 inches above average, besting the previous record of 47.12 inches set in 1908.
- Below-average precipitation was observed across the West and Northeast. California had the third driest January-November, Connecticut the fourth driest, and Oregon the fifth driest.
Extremes
- The USCEI for the year-to-date was 45 percent above average and the 12th highest value on record. On the national scale, extremes in warm maximum and minimum temperatures, one-day precipitation totals, and days with rain were much above average.
For extended analysis of regional temperature and precipitation patterns, as well as extreme events, please see our full report that will be released on December 14th.