Significant Events
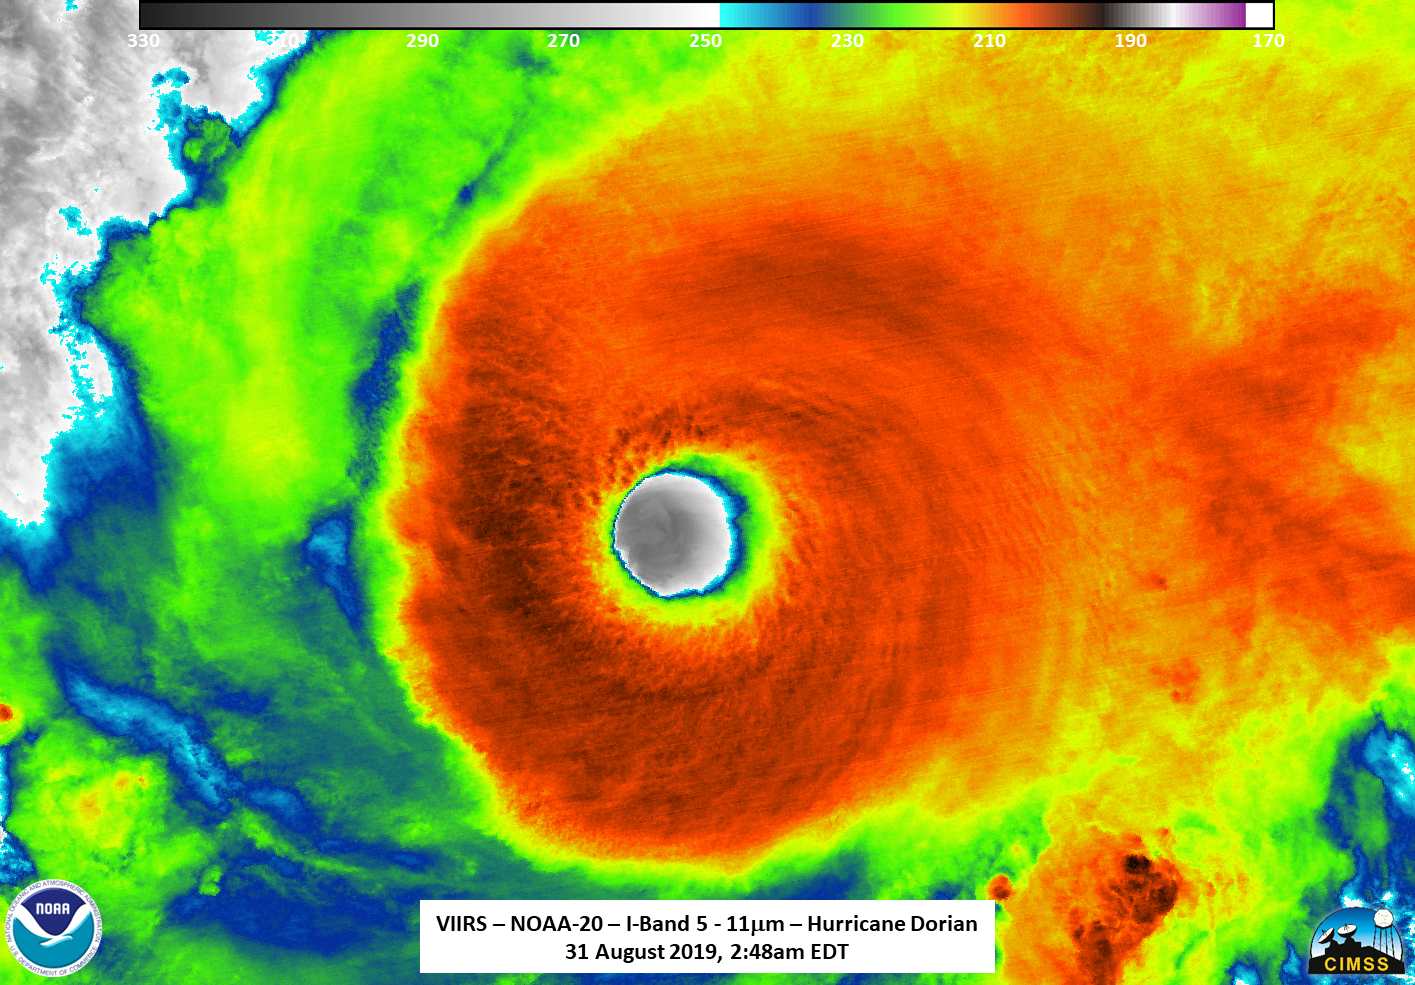
Hurricane Dorian was the first major hurricane of the 2019 Atlantic Hurricane Season. It formed in the Main Development Region to the east of the Windward Islands. Dorian's initial development was slow, but development accelerated as it passed to the east of Puerto Rico over the U.S. Virgin Islands and became a hurricane on August 28. On August 30, it intensified rapidly from Category 1 to 4. It eventually reached Category 5 on September 1 with a peak intensity of 185 mph as it made landfall in the Bahamas. These winds tied Hurricanes Gilbert (1988) and Wilma (2005) for the second strongest winds in the Atlantic since 1950. Only Hurricane Allen (1980) had stronger winds with 190 mph. It also ties the 1935 Labor Day Hurricane for the strongest winds at landfall in the Atlantic.
Dorian's impacts in the Bahamas were particularly devastating because the storm's motion stalled shortly after landfall. Over the course of 24 hours on September 2–3, the storm traveled less than 30 miles while straddling Grand Bahama Island. This was the second shortest straight-line distance tracked by an Atlantic major hurricane in a 24-hour period since 1950. Only Hurricane Betsy (1965) was slower. Dorian began moving northwestward later on September 3. It brushed the coasts of Florida, Georgia, and South Carolina before making landfall as a Category 1 hurricane in the Outer Banks of North Carolina on September 6.
Overall, tropical cyclone activity in the Atlantic was near-normal for August with one major hurricane (Dorian) and two marginal tropical storms (Chantal & Erin). The season as a whole is also near-normal so far. The Eastern Pacific, on the other hand, has had below normal activity both for August and the season to date. August 2019 produced three tropical storms in the eastern Pacific but no hurricanes. It's the first time since 1973 that the Eastern Pacific had zero hurricanes in August.
| Name | Dates of winds >39 mph |
Maximum Sustained Winds |
Minimum Central Pressure |
Landfall |
|---|---|---|---|---|
| Tropical Storm Chantal | August 21 | 40 mph | 1009 mb | N/A |
| Hurricane Dorian (Cat. 5) |
August 24–September 7 | 185 mph* | 910 mb* | Bahamas Cape Hatteras, NC Nova Scotia, Canada |
| Tropical Storm Erin | August 28 | 40 mph | 1005 mb | N/A |
| * Values occurred in September | ||||
| Name | Dates of winds >39 mph |
Maximum Sustained Winds |
Minimum Central Pressure |
Landfall |
|---|---|---|---|---|
| Hurricane Erick (Cat. 4) |
July 27–August 3 | 130 mph* | 952 mb* | N/A |
| Hurricane Flossie (Cat. 1) |
July 29–August 4 | 80 mph* | 990 mb* | N/A |
| Tropical Storm Gil | August 3–4 | 40 mph | 1006 mb | N/A |
| Tropical Storm Henriette | August 12–13 | 45 mph | 1003 mb | N/A |
| Tropical Storm Ivo | August 21–25 | 70 mph | 990 mb | N/A |
| * Values occurred in July | ||||
North Atlantic
| Storm Type | August 2019 | August 1981–2010 Average |
Record Most for August Period of Record: 1851–2018 |
|---|---|---|---|
| Tropical Storm (Winds >39 mph) |
3 | 3.3 | 8 (2004, 2012) |
| Hurricane (Winds >74 mph) |
1 | 1.5 | 5 (1893, 2004 |
| Major Hurricane (Winds >111 mph) |
1 | 0.7 (two every three Augusts) |
3 (1886, 1893, 2004) |
| Accumulated Cyclone Energy (ACE ×104 kt2) |
16.4 | 24.7 | 119.6 (1893) |
| Storm Type | January–August 2019 |
January–August 1981–2010 Average |
Record Most for January–August Period of Record: 1851–2018 |
|---|---|---|---|
| Tropical Storm (Winds >39 mph) |
5 | 5.2 | 12 (1995, 2005, 2012) |
| Hurricane (Winds >74 mph) |
2 | 2.1 | 7 (1886, 1893) |
| Major Hurricane (Winds >111 mph) |
1 | 0.9 (nine every ten years) |
3 (1886, 1893, 1916, 1926, 2004, 2005) |
| Accumulated Cyclone Energy (ACE ×104 kt2) |
19.9 | 32.3 | 135.5 (1893) |
East Pacific
| Storm Type | August 2019 | August 1981–2010 Average |
Record Most for August Period of Record: 1949–2018 |
|---|---|---|---|
| Tropical Storm (Winds >39 mph) |
3 | 4.63 | 9 (1968) |
| Hurricane (Winds >74 mph) |
0 | 2.2 | 6 (1972, 2014) |
| Major Hurricane (Winds >111 mph) |
0 | 1.1 | 4 (1972, 1993, 2014, 2015) |
| Accumulated Cyclone Energy (ACE ×104 kt2) |
11.8 | 33.5 | 99.26 (1972) |
| Storm Type | January–August 2019 |
January–August 1981–2010 Average |
Record Most for January–August Period of Record: 1949–2018 |
|---|---|---|---|
| Tropical Storm (Winds >39 mph) |
9 | 10.5 | 17 (1985) |
| Hurricane (Winds >74 mph) |
4 | 5.3 | 10 (1978, 1990, 2015) |
| Major Hurricane (Winds >111 mph) |
2 | 2.5 | 7 (2015) |
| Accumulated Cyclone Energy (ACE ×104 kt2) |
49.2 | 75.1 | 169.9 (1978) |