Summary
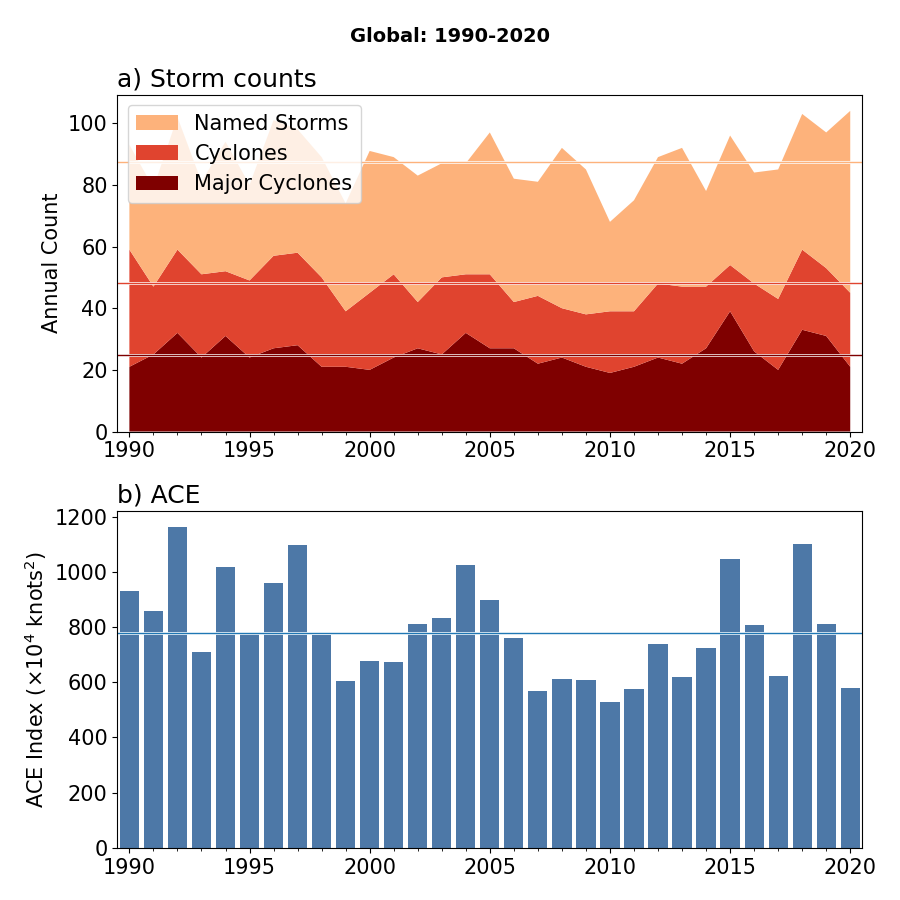
A total of 103 named storms occurred during 2020 around the globe. This count includes Tropical Cyclone Calvinia, which formed in late December 2019 and continued through January 1. The count ties the record that was set in 2018. Despite the record number of named storms, the 45 hurricane-strength and 21 major hurricane-strength tropical cyclones were both near their 1981-2010 mean values. The accumulated cyclone energy (ACE), which measures the strength and duration of tropical storms and hurricanes, was 25% below normal and the fifth lowest since 1981.
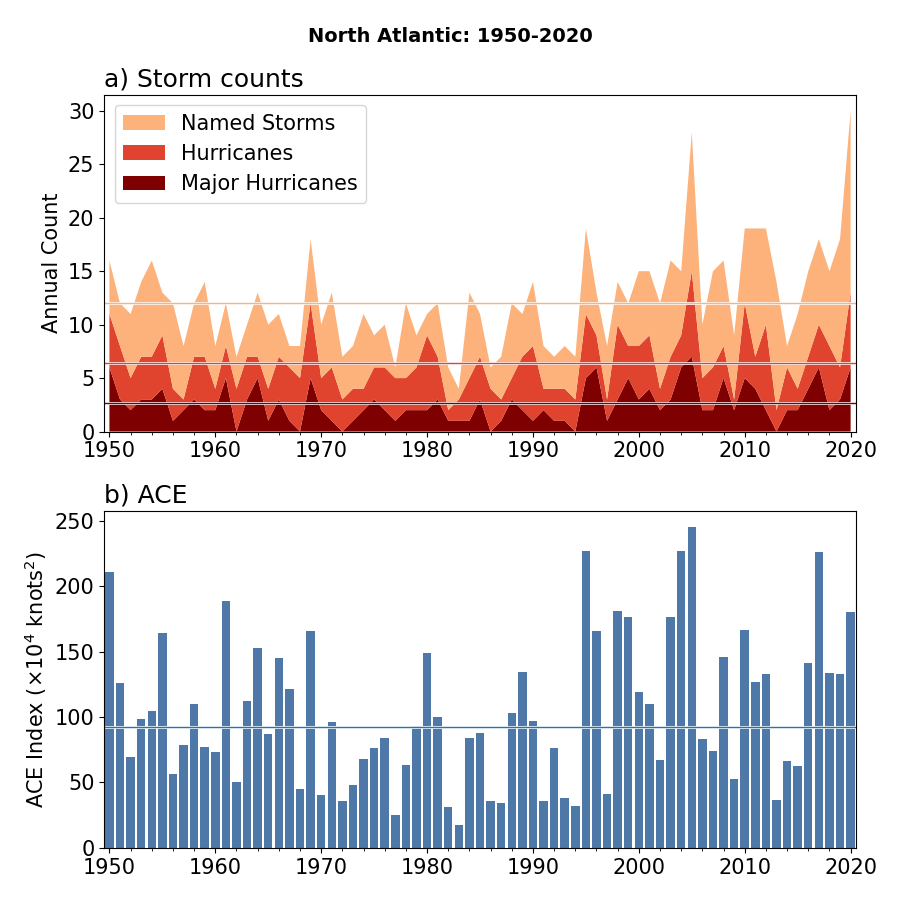
The North Atlantic played an unusually large role in the global tropical cyclone activity in 2020. The North Atlantic had 30 named storms, which broke the previous record of 28 in 2005. Of those 30 storms, 13 were hurricanes, six of which were major hurricanes. Both of these totals are the second highest on record behind 2005. The ACE was 75% above normal. The ACE was the sixth highest since 1981, and 2020 marked the fifth consecutive year with above-normal ACE. The North Atlantic accounted for about 30% of the global ACE and named storms, which is more than twice its usual share.
The 2020 season was also particularly impactful for the U.S. Twelve named storms made landfall in the contiguous U.S., which breaks the previous record of nine from 1916. Six of the landfalling storms in 2020 were hurricanes, which ties 1886 and 1985 for the highest on record. Seven of the twelve U.S. landfalling named storms caused at least $1 billion, which broke the previous record of four billion-dollar tropical cyclones in both 2004 and 2005. The strongest of these U.S. landfalling storms was Hurricane Laura, which made landfall in Louisiana as a category-4 storm. Laura was just the third of five named storms to make landfall in Louisiana in 2020, the most on record for any state in one year.
The strongest storm of the 2020 North Atlantic season was Hurricane Iota, which was also the second-strongest November hurricane on record for the Atlantic. Iota carved a path of destruction through Central America that closely followed that of category-4 Hurricane Eta from just two weeks earlier.
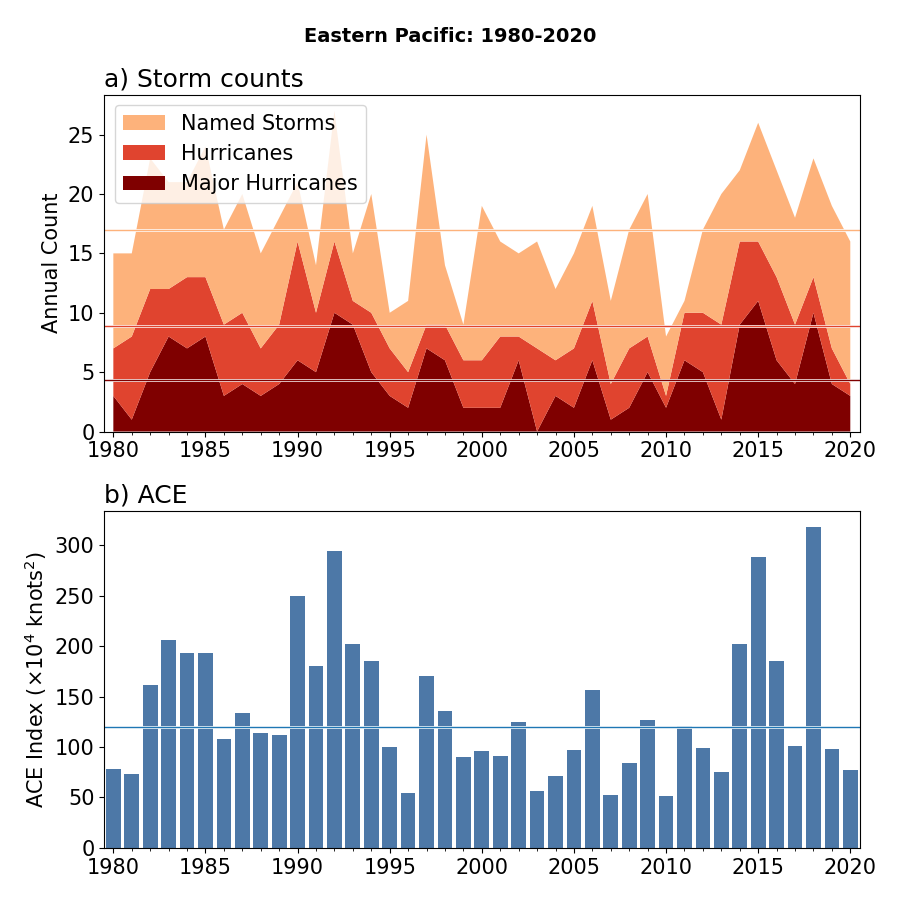
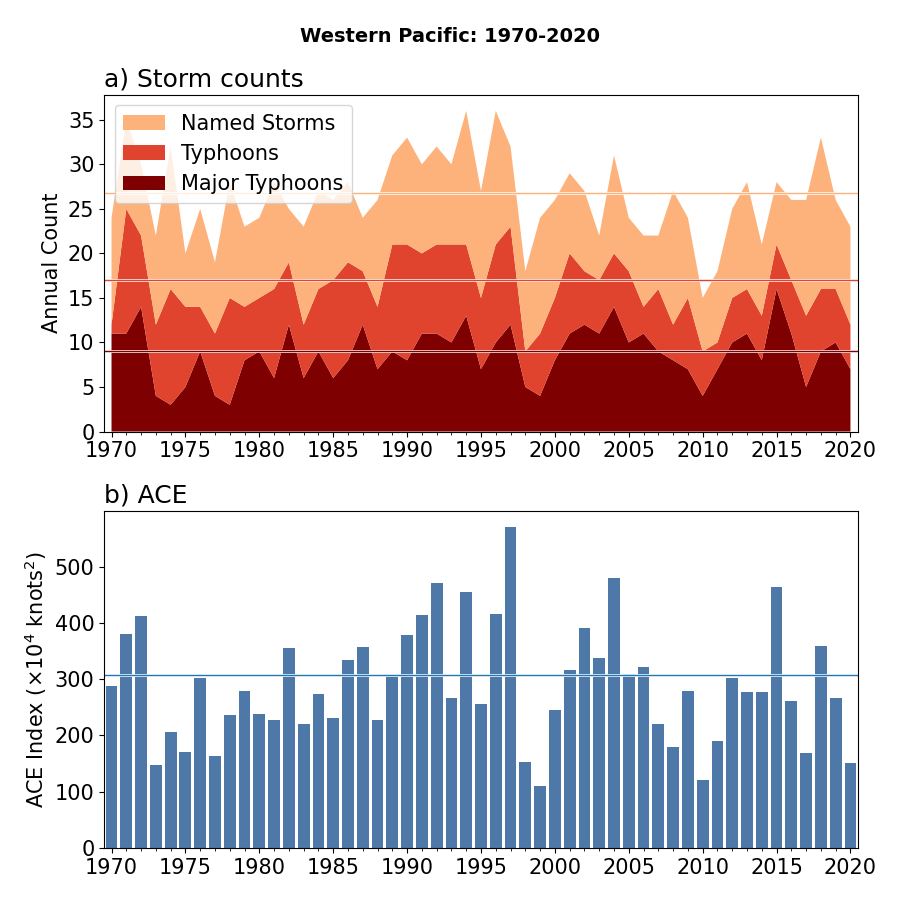
Despite the record activity in the North Atlantic, most other basins were less active than normal in 2020. The East Pacific had 16 named storms, which was near normal. However, the four East Pacific hurricanes in 2020 were the third fewest since 1981. The East Pacific ACE was more than 40% below normal, and it was the eighth lowest value since 1981. The West Pacific was also unusually quiet with less than half its normal ACE (third lowest since 1981). The West Pacific did have the strongest storm of 2020, Super Typhoon Goni, which made landfall in the Philippines as a powerful category-5 storm. The initial estimates of 195-mph winds during its landfall would be the strongest on record.
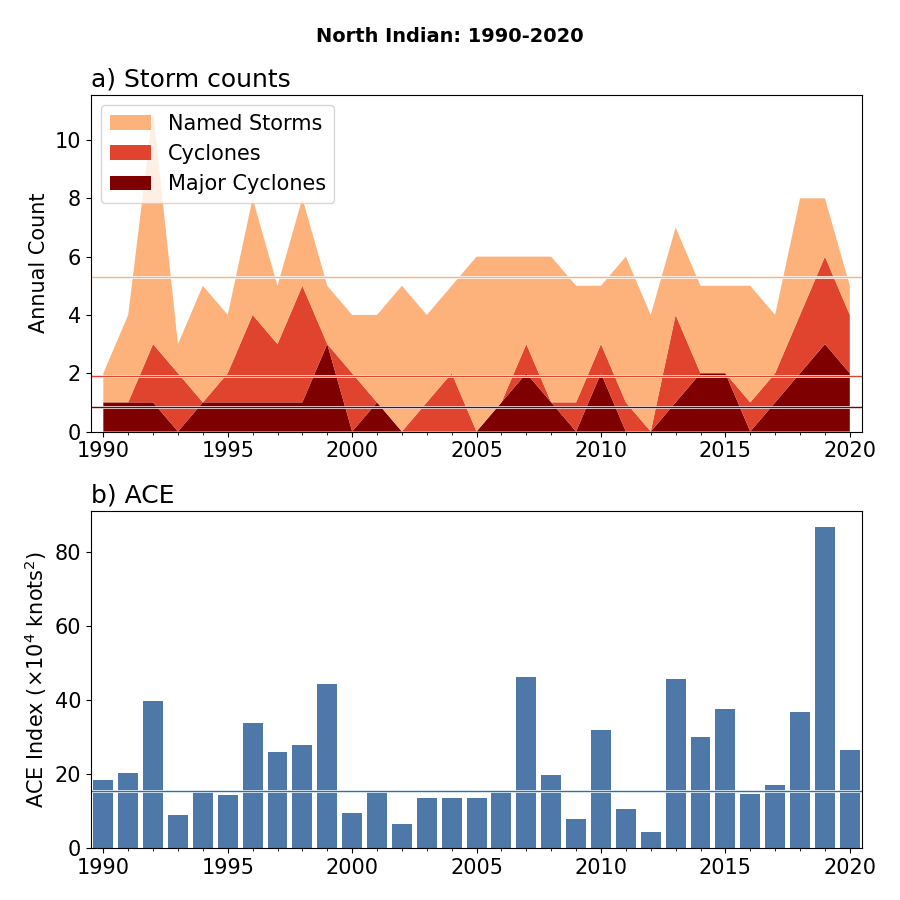
The North Indian Ocean tropical cyclone activity was stronger than normal with two particularly noteworthy storms. Super Cyclonic Storm Amphan was a rare category-5 strength storm for the North Indian Ocean. It weakened to a category 2 before landfall over low-lying eastern India. Its destruction extended into Bangladesh and its likely the costliest North Indian Ocean storm on record. The other noteworthy storm was Very Severe Cyclonic Storm Gati, which was the first hurricane-strength storm on record to make landfall in Somalia.
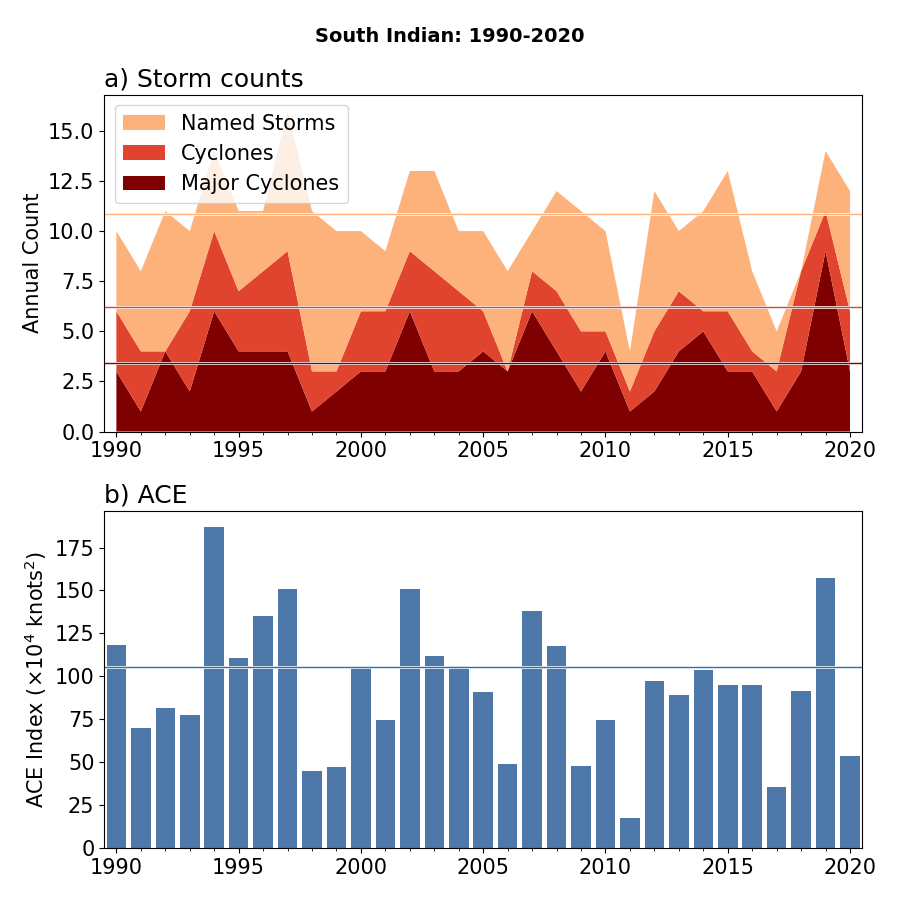
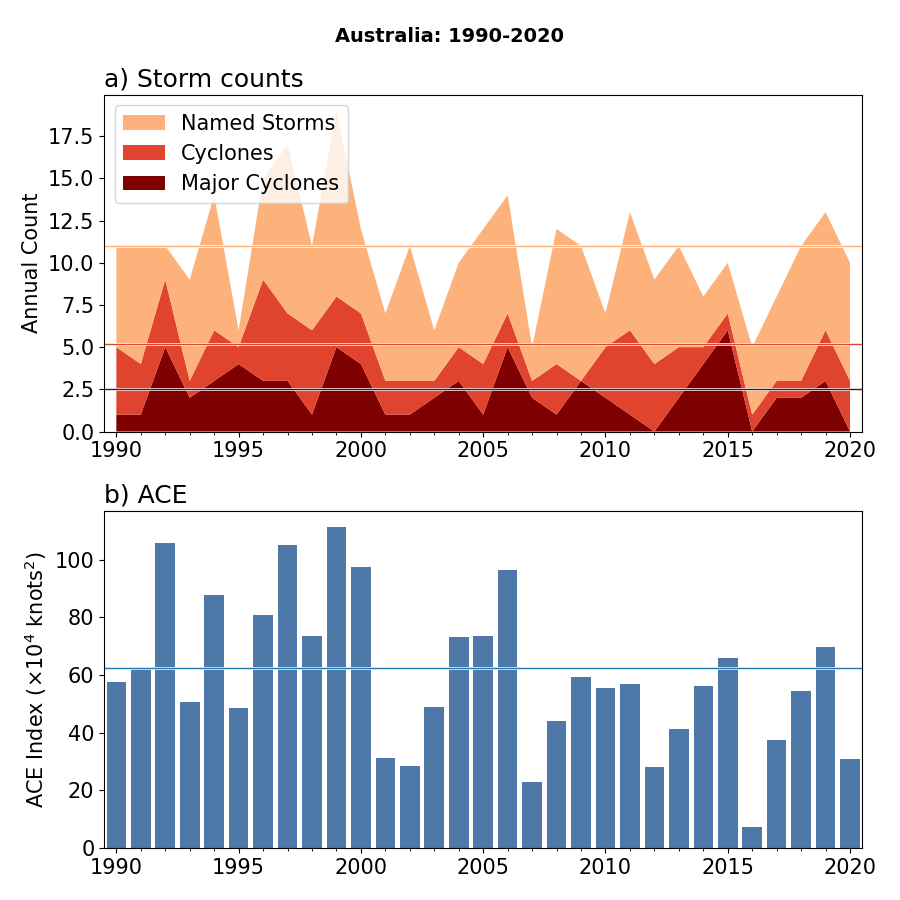
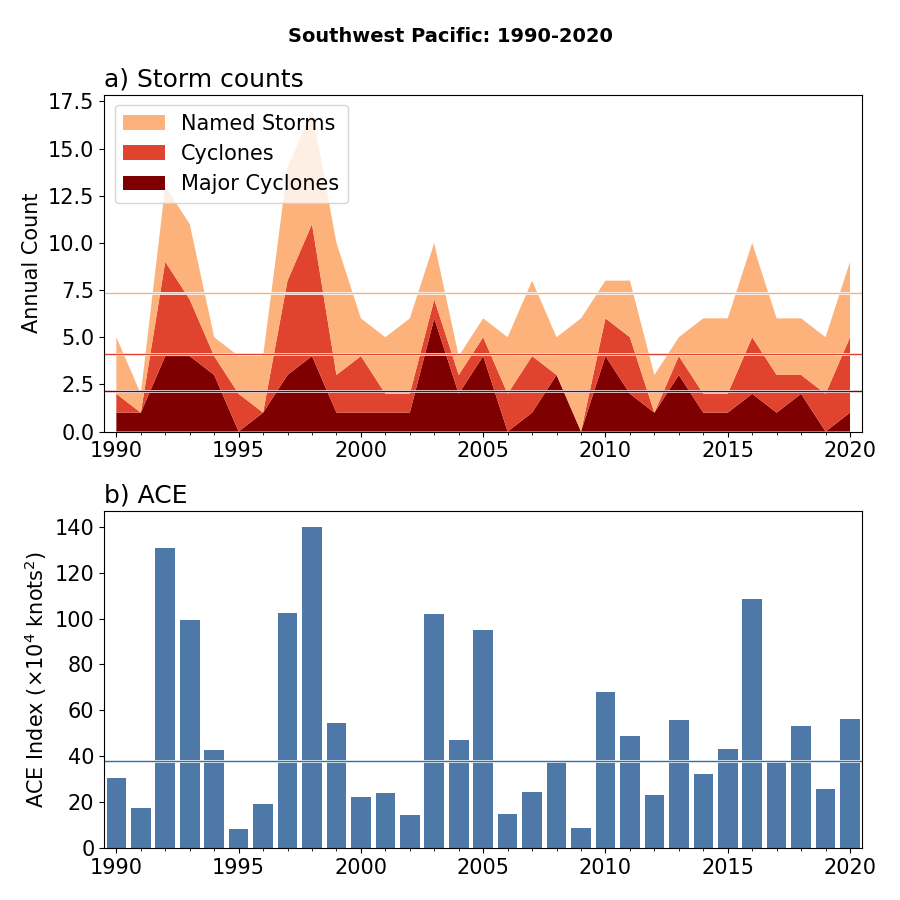
The tropical cyclone seasons in the Southern Hemisphere begin in July and end in June, so the seasons summarized here are the 2019/20 seasons that ended in June 2020. It is also more common for storms to cross basins in the Southern Hemisphere, so some storms are counted in multiple basins. The numbers of named storms, cyclones, and major cyclones in the South Indian Ocean were each near their 1981-2010 mean, but the ACE was 40% below normal. The Australian region was below normal in all metrics with ACE less than half of the climatological mean. The Southwest Pacific activity was near-to-above normal. The strongest cyclone of the Southern Hemisphere season was category-5 Tropical Cyclone Harold. Harold alone accounted for more than half of the Southwest Pacific's ACE for 2020. It was the first category 5 storm in the Southern Hemisphere since Tropical Cyclone Gita in 2018. Harold caused widespread damage throughout the South Pacific Islands, particularly in Vanuatu where it achieved its peak intensity.
North Atlantic
| Name |
Maximum CategoryMax Cat |
Dates >39 mph |
Maximum Sustained Winds | Minimum Central Pressure |
|---|---|---|---|---|
| Arthur | TS | May 17May 17-19 | 60 mph | 990 mb |
| Bertha | TS | May 27May 27 | 50 mph | 1007 mb |
| Amanda:Cristobal | TS | May 31-June 8May 31-Jun 8 | 60 mph | 992 mb |
| Dolly | TS | June 23Jun 23-24 | 45 mph | 1002 mb |
| Edouard | TS | July 6Jul 6 | 45 mph | 1005 mb |
| Fay | TS | July 9Jul 9-11 | 60 mph | 998 mb |
| Gonzalo | TS | July 22Jul 22-25 | 65 mph | 997 mb |
| Hanna | 1 | July 24Jul 24-26 | 85 mph | 973 mb |
| Isaias | 1 | July 30-August 4Jul 30-Aug 4 | 85 mph | 987 mb |
| Josephine | TS | August 13Aug 13-16 | 45 mph | 1005 mb |
| Kyle | TS | August 14Aug 14-16 | 50 mph | 1000 mb |
| Laura | 4 | August 21Aug 21-28 | 150 mph | 938 mb |
| Marco | 1 | August 22Aug 22-25 | 75 mph | 991 mb |
| Nana | 1 | September 1Sep 1-3 | 75 mph | 994 mb |
| Omar | TS | September 2Sep 2 | 40 mph | 1003 mb |
| Paulette | 2 | September 7Sep 7-22 | 105 mph | 965 mb |
| Rene | TS | September 7Sep 7-12 | 50 mph | 1000 mb |
| Sally | 2 | September 12Sep 12-17 | 105 mph | 967 mb |
| Teddy | 4 | September 14Sep 14-23 | 140 mph | 945 mb |
| Vicky | TS | September 14Sep 14-17 | 50 mph | 1000 mb |
| Wilfred | TS | September 18Sep 18-20 | 40 mph | 1007 mb |
| Alpha | TS | September 18Sep 18 | 50 mph | 998 mb |
| Beta | TS | September 18Sep 18-22 | 60 mph | 994 mb |
| Gamma | TS | October 3Oct 3-5 | 70 mph | 980 mb |
| Delta | 4 | October 5Oct 5-10 | 140 mph | 953 mb |
| Epsilon | 3 | October 19Oct 19-26 | 115 mph | 952 mb |
| Zeta | 2 | October 25Oct 25-29 | 105 mph | 973 mb |
| Eta | 4 | November 1Nov 1-13 | 150 mph | 923 mb |
| Theta | TS | November 10Nov 10-15 | 70 mph | 989 mb |
| Iota | 5 | November 13Nov 13-18 | 160 mph | 917 mb |
| Storm Type | Count | 1981-2010 Mean |
1981-2020 Rank* |
1851-2020 Record |
|---|---|---|---|---|
| Tropical Storm Winds ≥ 39 mph (34 kts) | 30 | 12.1 | 1st | 30† (2020) |
| Hurricane Winds ≥ 74 mph (64 kts) | 13 | 6.4 | 2nd | 15 (2005) |
| Major Hurricane Winds ≥ 111 mph (96 kts) | 6 | 2.7 | 2nd (tied with 3 other seasons) | 7 (2005) |
| Accumulated Cyclone Energy ACE×10⁴ kt² | 180.2 | 105.6 | 6th | 258.6 (1933) |
| †Previous record 28 (2005) | ||||
East Pacific
| Name |
Maximum CategoryMax Cat |
Dates >39 mph |
Maximum Sustained Winds | Minimum Central Pressure |
|---|---|---|---|---|
| Amanda:Cristobal | TS | May 31-June 8May 31-Jun 8 | 60 mph‡ | 992 mb‡ |
| Boris | TS | June 25Jun 25-26 | 40 mph | 1005 mb |
| Cristina | TS | July 7Jul 7-12 | 70 mph | 993 mb |
| Douglas | 4 | July 20Jul 20-29 | 130 mph | 954 mb |
| Elida | 2 | August 9Aug 9-12 | 100 mph | 975 mb |
| Genevieve | 4 | August 16Aug 16-21 | 130 mph | 950 mb |
| Fausto | TS | August 16Aug 16 | 40 mph | 1004 mb |
| Hernan | TS | August 26Aug 26-28 | 45 mph | 1001 mb |
| Iselle | TS | August 26Aug 26-30 | 60 mph | 997 mb |
| Julio | TS | September 5Sep 5-6 | 45 mph | 1004 mb |
| Karina | TS | September 13Sep 13-16 | 60 mph | 996 mb |
| Lowell | TS | September 21Sep 21-25 | 50 mph | 999 mb |
| Marie | 4 | September 29-October 6Sep 29-Oct 6 | 130 mph | 948 mb |
| Norbert | TS | October 6Oct 6-14 | 50 mph | 1001 mb |
| Odalys | TS | November 3Nov 3-5 | 50 mph | 1000 mb |
| Polo | TS | November 18Nov 18-19 | 45 mph | 1004 mb |
| ‡Value occurred in the North Atlantic | ||||
| Storm Type | Count | 1981-2010 Mean |
1981-2020 Rank* |
1949-2020 Record |
|---|---|---|---|---|
| Tropical Storm Winds ≥ 39 mph (34 kts) | 16 | 16.9 | 24th (tied with 2 other seasons) | 27 (1992) |
| Hurricane Winds ≥ 74 mph (64 kts) | 4 | 8.9 | 38th (tied with 1 other season) | 16 (1990, 1992, 2014, 2015) |
| Major Hurricane Winds ≥ 111 mph (96 kts) | 3 | 4.3 | 25th (tied with 4 other seasons) | 11 (2015) |
| Accumulated Cyclone Energy ACE×10⁴ kt² | 76.7 | 132.1 | 33rd | 318.1 (2018) |
West Pacific
| Name |
Maximum CategoryMax Cat |
Dates >39 mph |
Maximum Sustained Winds | Minimum Central Pressure |
|---|---|---|---|---|
| Vongfong | 3 | May 12May 12-16 | 120 mph | 957 mb |
| Nuri | TS | June 13Jun 13 | 40 mph | 997 mb |
| Sinlaku | TS | August 1Aug 1-2 | 40 mph | 993 mb |
| Hagupit | 1 | August 2Aug 2-4 | 85 mph | 971 mb |
| Jangmi | TS | August 9Aug 9-11 | 45 mph | 990 mb |
| Not_Named | TS | August 9Aug 9-10 | 50 mph | 1005 mb |
| Mekkhala | 1 | August 10Aug 10-11 | 80 mph | 980 mb |
| Higos | TS | August 18Aug 18-19 | 60 mph | 991 mb |
| Bavi | 3 | August 22Aug 22-27 | 115 mph | 942 mb |
| Maysak | 4 | August 28-September 3Aug 28-Sep 3 | 145 mph | 921 mb |
| Haishen | 4 | August 31-September 7Aug 31-Sep 7 | 155 mph | 915 mb |
| Noul | TS | September 15Sep 15-18 | 60 mph | 990 mb |
| Dolphin | TS | September 20Sep 20-24 | 70 mph | 980 mb |
| Kujira | 1 | September 27Sep 27-30 | 75 mph | 974 mb |
| Chan-Hom | 1 | October 5Oct 5-11 | 90 mph | 962 mb |
| Linfa | TS | October 10Oct 10-11 | 45 mph | 999 mb |
| Nangka | TS | October 12Oct 12-14 | 60 mph | 989 mb |
| Saudel | 2 | October 20Oct 20-25 | 95 mph | 968 mb |
| Molave | 3 | October 24Oct 24-28 | 125 mph | 950 mb |
| Goni | 5 | October 28-November 5Oct 28-Nov 5 | 195 mph | 884 mb |
| Atsani | TS | November 2Nov 2-7 | 60 mph | 993 mb |
| Etau | TS | November 9Nov 9 | 45 mph | 998 mb |
| Vamco | 4 | November 10Nov 10-15 | 130 mph | 945 mb |
| Storm Type | Count | 1981-2010 Mean |
1981-2020 Rank* |
1945-2020 Record |
|---|---|---|---|---|
| Tropical Storm Winds ≥ 39 mph (34 kts) | 23 | 26.8 | 32nd (tied with 1 other season) | 38 (1964) |
| Typhoon Winds ≥ 74 mph (64 kts) | 12 | 17.0 | 34th (tied with 2 other seasons) | 26 (1964) |
| Major Typhoon Winds ≥ 111 mph (96 kts) | 7 | 9.0 | 29th (tied with 4 other seasons) | 16 (2015) |
| Accumulated Cyclone Energy ACE×10⁴ kt² | 150.0 | 307.3 | 38th | 570.4 (1997) |
North Indian
| Name |
Maximum CategoryMax Cat |
Dates >39 mph |
Maximum Sustained Winds | Minimum Central Pressure |
|---|---|---|---|---|
| Amphan | 5 | May 16May 16-21 | 165 mph | 901 mb |
| Nisarga | 1 | June 2Jun 2-3 | 85 mph | 975 mb |
| Gati | 3 | November 21Nov 21-23 | 115 mph | 967 mb |
| Nivar | 1 | November 23Nov 23-26 | 80 mph | 981 mb |
| Burevi | TS | December 1Dec 1-4 | 50 mph | 999 mb |
| Storm Type | Count | 1981-2010 Mean |
1981-2020 Rank* |
1972-2020 Record |
|---|---|---|---|---|
| Tropical Storm Winds ≥ 39 mph (34 kts) | 5 | 5.0 | 14th (tied with 12 other seasons) | 11 (1992) |
| Cyclone Winds ≥ 74 mph (64 kts) | 4 | 1.6 | 3rd (tied with 3 other seasons) | 6 (2019) |
| Major Cyclone Winds ≥ 111 mph (96 kts) | 2 | 0.7 (7 in 10 seasons) | 3rd (tied with 5 other seasons) | 3 (1999, 2019) |
| Accumulated Cyclone Energy ACE×10⁴ kt² | 26.6 | 19.1 | 12th | 86.7 (2019) |
South Indian
| Name |
Maximum CategoryMax Cat |
Dates >39 mph |
Maximum Sustained Winds | Minimum Central Pressure |
|---|---|---|---|---|
| Belna | 3 | December 5Dec 5-11 | 115 mph | 959 mb |
| Ambali | 4 | December 5Dec 5-8 | 155 mph | 929 mb |
| Calvinia | 1 | December 29-January 1Dec 29-Jan 1 | 80 mph | 973 mb |
| Not_Named | TS | January 22Jan 22-23 | 40 mph | 1000 mb |
| Diane | TS | January 25Jan 25-27 | 60 mph | 985 mb |
| Esami | TS | January 25Jan 25-26 | 50 mph | 991 mb |
| Francisco | TS | February 4Feb 4-6 | 50 mph | 994 mb |
| Francisco | TS | February 14Feb 14 | 45 mph | 1003 mb |
| Gabekile | 1 | February 15Feb 15-18 | 85 mph | 978 mb |
| Herold | 3 | March 13Mar 13-19 | 115 mph | 963 mb |
| Irondro | 2 | April 2Apr 2-6 | 105 mph | 958 mb |
| Jeruto | TS | April 14Apr 14-15 | 45 mph | 999 mb |
| Storm Type | Count | 1981-2010 Mean |
1981-2020 Rank* |
1956-2020 Record |
|---|---|---|---|---|
| Tropical Storm Winds ≥ 39 mph (34 kts) | 11 | 10.5 | 11th (tied with 9 other seasons) | 16 (1997) |
| Cyclone Winds ≥ 74 mph (64 kts) | 6 | 6.0 | 16th (tied with 8 other seasons) | 11 (2019) |
| Major Cyclone Winds ≥ 111 mph (96 kts) | 3 | 3.0 | 16th (tied with 10 other seasons) | 9 (2019) |
| Accumulated Cyclone Energy ACE×10⁴ kt² | 53.6 | 92.7 | 31st | 186.9 (1994) |
Australia
| Name |
Maximum CategoryMax Cat |
Dates >39 mph |
Maximum Sustained Winds | Minimum Central Pressure |
|---|---|---|---|---|
| Blake | TS | January 5Jan 5-8 | 60 mph | 989 mb |
| Claudia | 2 | January 11Jan 11-16 | 95 mph | 971 mb |
| Damien | 2 | February 6Feb 6-9 | 105 mph | 961 mb |
| Uesi | 1 | February 9Feb 9-15 | 85 mph‖ | 971 mb‖ |
| Ferdinand | 2 | February 23Feb 23-29 | 105 mph | 962 mb |
| Esther | TS | February 23Feb 23-28 | 60 mph | 992 mb |
| Not_Named | TS | March 11Mar 11 | 40 mph | 1003 mb |
| Irondro | 2 | April 2Apr 2-6 | 105 mph** | 958 mb** |
| Harold | 5 | April 2Apr 2-10 | 165 mph†† | 912 mb†† |
| Mangga | TS | May 21May 21-23 | 45 mph | 996 mb |
| ‖Value occurred in the Southwest Pacific | ||||
| **Value occurred in the South Indian | ||||
| ††Value occurred in the Southwest Pacific | ||||
| Storm Type | Count | 1981-2010 Mean |
1981-2020 Rank* |
1956-2020 Record |
|---|---|---|---|---|
| Tropical Storm Winds ≥ 39 mph (34 kts) | 10 | 11.3 | 24th (tied with 2 other seasons) | 19 (1999) |
| Tropical Cyclone Winds ≥ 74 mph (64 kts) | 3 | 4.9 | 27th (tied with 10 other seasons) | 9 (1992, 1996) |
| Major Tropical Cyclone Winds ≥ 111 mph (96 kts) | 0 | 2.2 | 35th (tied with 5 other seasons) | 6 (2015) |
| Accumulated Cyclone Energy ACE×10⁴ kt² | 30.7 | 62.4 | 34th | 111.3 (1999) |
Southwest Pacific
| Name |
Maximum CategoryMax Cat |
Dates >39 mph |
Maximum Sustained Winds | Minimum Central Pressure |
|---|---|---|---|---|
| Rita | 1 | November 24Nov 24-26 | 75 mph | 983 mb |
| Sarai | 1 | December 26Dec 26-31 | 80 mph | 975 mb |
| Tino | 1 | January 16Jan 16-19 | 80 mph | 964 mb |
| Not_Named | TS | January 25Jan 25-26 | 40 mph | 1000 mb |
| Uesi | 1 | February 9Feb 9-15 | 85 mph | 971 mb |
| Vicky | TS | February 21Feb 21-22 | 50 mph | 996 mb |
| Wasi | TS | February 21Feb 21-23 | 60 mph | 995 mb |
| Gretel | TS | March 14Mar 14-16 | 60 mph | 971 mb |
| Harold | 5 | April 2Apr 2-10 | 165 mph | 912 mb |
| Storm Type | Count | 1981-2010 Mean |
1981-2020 Rank* |
1956-2020 Record |
|---|---|---|---|---|
| Tropical Storm Winds ≥ 39 mph (34 kts) | 9 | 7.5 | 12th (tied with 1 other season) | 17 (1998) |
| Tropical Cyclone Winds ≥ 74 mph (64 kts) | 5 | 4.1 | 9th (tied with 5 other seasons) | 11 (1998) |
| Major Tropical Cyclone Winds ≥ 111 mph (96 kts) | 1 | 1.9 | 19th (tied with 13 other seasons) | 6 (2003) |
| Accumulated Cyclone Energy ACE×10⁴ kt² | 56.0 | 50.8 | 13th | 139.9 (1998) |
Global
| Name |
Maximum CategoryMax Cat |
Dates >39 mph |
Maximum Sustained Winds | Minimum Central Pressure |
|---|---|---|---|---|
| Calvinia | 1 | December 29-January 1Dec 29-Jan 1 | 80 mph | 973 mb |
| Blake | TS | January 5Jan 5-8 | 60 mph | 989 mb |
| Claudia | 2 | January 11Jan 11-16 | 95 mph | 971 mb |
| Tino | 1 | January 16Jan 16-19 | 80 mph | 964 mb |
| Not_Named | TS | January 22Jan 22-23 | 40 mph | 1000 mb |
| Diane | TS | January 25Jan 25-27 | 60 mph | 985 mb |
| Esami | TS | January 25Jan 25-26 | 50 mph | 991 mb |
| Not_Named | TS | January 25Jan 25-26 | 40 mph | 1000 mb |
| Francisco | TS | February 4Feb 4-6 | 50 mph | 994 mb |
| Damien | 2 | February 6Feb 6-9 | 105 mph | 961 mb |
| Uesi | 1 | February 9Feb 9-15 | 85 mph | 971 mb |
| Francisco | TS | February 14Feb 14 | 45 mph | 1003 mb |
| Gabekile | 1 | February 15Feb 15-18 | 85 mph | 978 mb |
| Vicky | TS | February 21Feb 21-22 | 50 mph | 996 mb |
| Wasi | TS | February 21Feb 21-23 | 60 mph | 995 mb |
| Ferdinand | 2 | February 23Feb 23-29 | 105 mph | 962 mb |
| Esther | TS | February 23Feb 23-28 | 60 mph | 992 mb |
| Not_Named | TS | March 11Mar 11 | 40 mph | 1003 mb |
| Herold | 3 | March 13Mar 13-19 | 115 mph | 963 mb |
| Gretel | TS | March 14Mar 14-16 | 60 mph | 971 mb |
| Irondro | 2 | April 2Apr 2-6 | 105 mph | 958 mb |
| Harold | 5 | April 2Apr 2-10 | 165 mph | 912 mb |
| Jeruto | TS | April 14Apr 14-15 | 45 mph | 999 mb |
| Vongfong | 3 | May 12May 12-16 | 120 mph | 957 mb |
| Amphan | 5 | May 16May 16-21 | 165 mph | 901 mb |
| Arthur | TS | May 17May 17-19 | 60 mph | 990 mb |
| Mangga | TS | May 21May 21-23 | 45 mph | 996 mb |
| Bertha | TS | May 27May 27 | 50 mph | 1007 mb |
| Amanda:Cristobal | TS | May 31-June 8May 31-Jun 8 | 60 mph | 992 mb |
| Nisarga | 1 | June 2Jun 2-3 | 85 mph | 975 mb |
| Nuri | TS | June 13Jun 13 | 40 mph | 997 mb |
| Dolly | TS | June 23Jun 23-24 | 45 mph | 1002 mb |
| Boris | TS | June 25Jun 25-26 | 40 mph | 1005 mb |
| Edouard | TS | July 6Jul 6 | 45 mph | 1005 mb |
| Cristina | TS | July 7Jul 7-12 | 70 mph | 993 mb |
| Fay | TS | July 9Jul 9-11 | 60 mph | 998 mb |
| Douglas | 4 | July 20Jul 20-29 | 130 mph | 954 mb |
| Gonzalo | TS | July 22Jul 22-25 | 65 mph | 997 mb |
| Hanna | 1 | July 24Jul 24-26 | 85 mph | 973 mb |
| Isaias | 1 | July 30-August 4Jul 30-Aug 4 | 85 mph | 987 mb |
| Sinlaku | TS | August 1Aug 1-2 | 40 mph | 993 mb |
| Hagupit | 1 | August 2Aug 2-4 | 85 mph | 971 mb |
| Elida | 2 | August 9Aug 9-12 | 100 mph | 975 mb |
| Jangmi | TS | August 9Aug 9-11 | 45 mph | 990 mb |
| Not_Named | TS | August 9Aug 9-10 | 50 mph | 1005 mb |
| Mekkhala | 1 | August 10Aug 10-11 | 80 mph | 980 mb |
| Josephine | TS | August 13Aug 13-16 | 45 mph | 1005 mb |
| Kyle | TS | August 14Aug 14-16 | 50 mph | 1000 mb |
| Genevieve | 4 | August 16Aug 16-21 | 130 mph | 950 mb |
| Fausto | TS | August 16Aug 16 | 40 mph | 1004 mb |
| Higos | TS | August 18Aug 18-19 | 60 mph | 991 mb |
| Laura | 4 | August 21Aug 21-28 | 150 mph | 938 mb |
| Marco | 1 | August 22Aug 22-25 | 75 mph | 991 mb |
| Bavi | 3 | August 22Aug 22-27 | 115 mph | 942 mb |
| Hernan | TS | August 26Aug 26-28 | 45 mph | 1001 mb |
| Iselle | TS | August 26Aug 26-30 | 60 mph | 997 mb |
| Maysak | 4 | August 28-September 3Aug 28-Sep 3 | 145 mph | 921 mb |
| Haishen | 4 | August 31-September 7Aug 31-Sep 7 | 155 mph | 915 mb |
| Nana | 1 | September 1Sep 1-3 | 75 mph | 994 mb |
| Omar | TS | September 2Sep 2 | 40 mph | 1003 mb |
| Julio | TS | September 5Sep 5-6 | 45 mph | 1004 mb |
| Paulette | 2 | September 7Sep 7-22 | 105 mph | 965 mb |
| Rene | TS | September 7Sep 7-12 | 50 mph | 1000 mb |
| Sally | 2 | September 12Sep 12-17 | 105 mph | 967 mb |
| Karina | TS | September 13Sep 13-16 | 60 mph | 996 mb |
| Teddy | 4 | September 14Sep 14-23 | 140 mph | 945 mb |
| Vicky | TS | September 14Sep 14-17 | 50 mph | 1000 mb |
| Noul | TS | September 15Sep 15-18 | 60 mph | 990 mb |
| Wilfred | TS | September 18Sep 18-20 | 40 mph | 1007 mb |
| Alpha | TS | September 18Sep 18 | 50 mph | 998 mb |
| Beta | TS | September 18Sep 18-22 | 60 mph | 994 mb |
| Dolphin | TS | September 20Sep 20-24 | 70 mph | 980 mb |
| Lowell | TS | September 21Sep 21-25 | 50 mph | 999 mb |
| Kujira | 1 | September 27Sep 27-30 | 75 mph | 974 mb |
| Marie | 4 | September 29-October 6Sep 29-Oct 6 | 130 mph | 948 mb |
| Gamma | TS | October 3Oct 3-5 | 70 mph | 980 mb |
| Delta | 4 | October 5Oct 5-10 | 140 mph | 953 mb |
| Chan-Hom | 1 | October 5Oct 5-11 | 90 mph | 962 mb |
| Norbert | TS | October 6Oct 6-14 | 50 mph | 1001 mb |
| Linfa | TS | October 10Oct 10-11 | 45 mph | 999 mb |
| Nangka | TS | October 12Oct 12-14 | 60 mph | 989 mb |
| Epsilon | 3 | October 19Oct 19-26 | 115 mph | 952 mb |
| Saudel | 2 | October 20Oct 20-25 | 95 mph | 968 mb |
| Molave | 3 | October 24Oct 24-28 | 125 mph | 950 mb |
| Zeta | 2 | October 25Oct 25-29 | 105 mph | 973 mb |
| Goni | 5 | October 28-November 5Oct 28-Nov 5 | 195 mph | 884 mb |
| Eta | 4 | November 1Nov 1-13 | 150 mph | 923 mb |
| Atsani | TS | November 2Nov 2-7 | 60 mph | 993 mb |
| Odalys | TS | November 3Nov 3-5 | 50 mph | 1000 mb |
| Etau | TS | November 9Nov 9 | 45 mph | 998 mb |
| Theta | TS | November 10Nov 10-15 | 70 mph | 989 mb |
| Vamco | 4 | November 10Nov 10-15 | 130 mph | 945 mb |
| Iota | 5 | November 13Nov 13-18 | 160 mph | 917 mb |
| Alicia | 1 | November 14Nov 14-17 | 75 mph | 983 mb |
| Polo | TS | November 18Nov 18-19 | 45 mph | 1004 mb |
| Gati | 3 | November 21Nov 21-23 | 115 mph | 967 mb |
| Nivar | 1 | November 23Nov 23-26 | 80 mph | 981 mb |
| Burevi | TS | December 1Dec 1-4 | 50 mph | 999 mb |
| Bongoyo | TS | December 7Dec 7-11 | 60 mph | 992 mb |
| Not_Named | TS | December 8Dec 8-11 | 50 mph | 992 mb |
| Not_Named | TS | December 11Dec 11-12 | 45 mph | 997 mb |
| Yasa | 5 | December 12Dec 12-19 | 160 mph | 914 mb |
| Zazu | TS | December 13Dec 13-16 | 60 mph | 985 mb |
| Chalane | TS | December 25Dec 25-30 | 70 mph | 990 mb |
| Storm Type | Count | 1981-2010 Mean |
1981-2020 Rank* |
1972-2020 Record |
|---|---|---|---|---|
| Tropical Storm Winds ≥ 39 mph (34 kts) | 103 | 86.8 | 1st (tied with 1 other season) | 103 (2018, 2020) |
| Tropical Cyclone Winds ≥ 74 mph (64 kts) | 45 | 47.5 | 26th (tied with 2 other seasons) | 59 (1990, 1992, 2018) |
| Major Tropical Cyclone Winds ≥ 111 mph (96 kts) | 21 | 23.4 | 25th (tied with 7 other seasons) | 39 (2015) |
| Accumulated Cyclone Energy ACE×10⁴ kt² | 579.9 | 770.2 | 36th | 1,163.1 (1992) |
Data Description
The data in this report are derived from NCEI's IBTrACS dataset (Knapp et al. 2010; Schreck et al. 2014). IBTrACS tropical cyclone track and intensity data from agencies and sources around the globe. In this report, data from NOAA's National Hurricane Center (NHC) are used for the North Atlantic and East Pacific. The other basins use data from the U.S. Military's Joint Typhoon Warning Center (JTWC).
Historical values use the "best track" data that have been analyzed by forecasters after the season using all available data. Operational procedures and observing systems have changed with time and between regions, which makes these data heterogeneous. Intensity data are generally the most reliable since the early 1970s in the Atlantic (Landsea and Franklin 2013) and since the mid-1980s in other regions (Chu et al. 2002). The number of short-lived storms (≤2 days) has also increased since around 2000 due to improvements in observations and analysis techniques (Landsea et al. 2010).
Values for the current year are provisional values from the operational forecast advisories. IBTrACS obtains these from NCEP's TC Vitals, the NCAR Tropical Cyclone Guidance Project, and NHC provisional data. These values are subject to change during the post-season best track analysis. They also only include 6-hourly storm fixes, which means they may miss special advisories at landfall, peak intensity, etc.
The tropical cyclone seasons in the Southern Hemisphere begin in July and end in June, while the Northern Hemisphere seasons are counted from January to December. Storms are counted in all basins, months, and years in which they occur, which means some storms may appear more than once. However, the global totals only include each storm one time.
References
- Chu, J.-H., C. R. Sampson, A. S. Levine, and E. Fukada, 2002: The joint typhoon warning center tropical cyclone best-tracks, 1945–2000. Naval Research Laboratory, Reference Number NRL/MR/7540-02-16, 22 pp., https://www.metoc.navy.mil/jtwc/products/best-tracks/tc-bt-report.html.
- Knapp, K. R., M. C. Kruk, D. H. Levinson, H. J. Diamond, and C. J. Neumann, 2010: The International Best Track Archive for Climate Stewardship (IBTrACS). Bull. Amer. Meteor. Soc., 91, 363–376, https://doi.org/10.1175/2009BAMS2755.1.
- Landsea, C. W., and J. L. Franklin, 2013: Atlantic Hurricane database uncertainty and presentation of a new database format. Mon. Wea. Rev., 141, 3576–3592, https://doi.org/10.1175/MWR-D-12-00254.1.
- ——, G. A. Vecchi, L. Bengtsson, and T. R. Knutson, 2010: Impact of duration thresholds on Atlantic tropical cyclone counts. J. Climate, 23, 2508–2519, https://doi.org/10.1175/2009JCLI3034.1.
- Schreck, C. J., K. R. Knapp, and J. P. Kossin, 2014: The Impact of Best Track Discrepancies on Global Tropical Cyclone Climatologies using IBTrACS. Mon. Wea. Rev., 142, 3881–3899, https://doi.org/10.1175/MWR-D-14-00021.1.