Note: This Synoptic Discussion describes recent weather events and climate anomalies in relation to the phenomena that cause the weather. These phenomena include the jet stream, fronts and low pressure systems that bring precipitation, high pressure systems that bring dry weather, and the mechanisms which control these features — such as El Niño, La Niña, and other oceanic and atmospheric drivers (PNA, NAO, AO, and others). The report may contain more technical language than other components of the State of the Climate series.
Summary
The Earth's ocean-atmosphere system was technically in an ENSO-neutral state during September 2017. The upper-level circulation pattern underwent a significant shift over the contiguous United States (CONUS) at mid-month, changing from a predominantly ridge-West/trough-East pattern during the first half of the month to a trough-West/ridge-East pattern for the last half of the month. The temperature anomaly pattern concurrently switched from warm-West/cold-East to cold-West/warm-East. Aside from rain dropped by tropical systems, the precipitation pattern was mostly drier than normal for the first half of the month. Fronts and low pressure systems moving in the western trough brought above-normal precipitation to much of the West and Plains during the last half of the month, helping to quench wildfires and contract drought, while the East remained dry beneath the long-wave ridge, which led to expansion of drought and abnormal dryness. Hurricanes Irma and Maria brought rain and devastation to parts of the U.S. this month. The upper-level circulation, temperature, and precipitation anomaly patterns suggested that the atmospheric drivers originating in the North Pacific may have had an influence on the month's weather, but tropical cyclones were also an important factor. See below for details.
Synoptic Discussion
 Animation of daily upper-level circulation for the month.
|
 Animation of daily surface fronts and pressure systems for the month.
|
In the Northern Hemisphere, September marks the beginning of climatological fall (autumn) which is the time of year when solar heating decreases as the sun angle decreases, and an expanding circumpolar vortex forces the jet stream to migrate southward. Polar air masses begin to influence the weather over the contiguous U.S. (CONUS) more, and the warm, dry subtropical high pressure belts influence the weather less.
During September 2017, the atmospheric circulation was highly meridional. A meridional circulation pattern transfers heat from the low latitudes to higher latitudes and transports colder air masses from the poles southward, which helps to balance the distribution of heat across the Earth. But the circulation behaved in an unusual way by "flipping" at mid-month, changing from a stable long-wave ridge-West/trough-East pattern for the first half of the month to a pattern consisting of a trough in the West and ridge in the East for the last half of the month. Each of these patterns was characterized by specific weather phenomena, temperature anomalies, precipitation anomalies, and impacts.
 500-mb mean circulation for the CONUS for September 1-14, 2017, showing a long-wave ridge in the West and trough in the East.
|
 500-mb mean circulation for the CONUS for September 15-28, 2017, showing a long-wave trough in the West and ridge in the East.
|
 500-mb anomalies for the CONUS for September 1-14, 2017.
|
 500-mb anomalies for the CONUS for September 15-28, 2017.
|
 Temperature departure map for the CONUS for September 1-14, 2017.
|
 Temperature departure map for the CONUS for September 15-28, 2017.
|
 Percent of normal precipitation map for the CONUS for September 1-14, 2017.
|
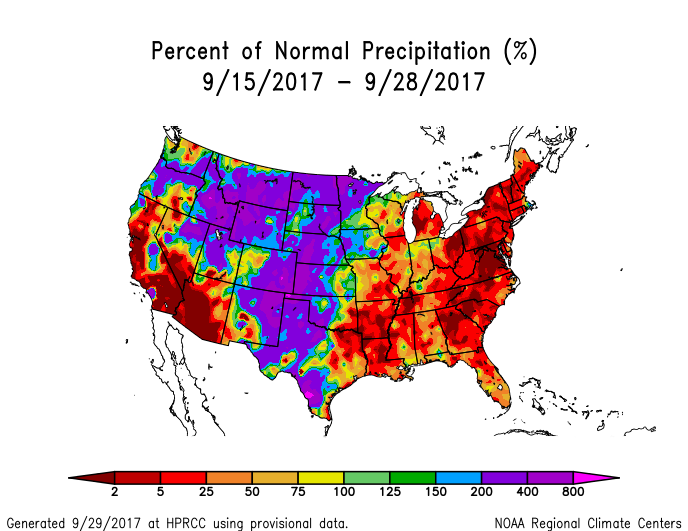 Percent of normal precipitation map for the CONUS for September 15-28, 2017.
|
On a day-by-day basis, the ridge-West/trough-East pattern was relatively stable during September 1-12, and began to transition to the opposite pattern during the 13th-14th. The trough-West/ridge-East pattern was relatively stable during September 15-26, and began to break down during the 27th-30th, becoming transitory.
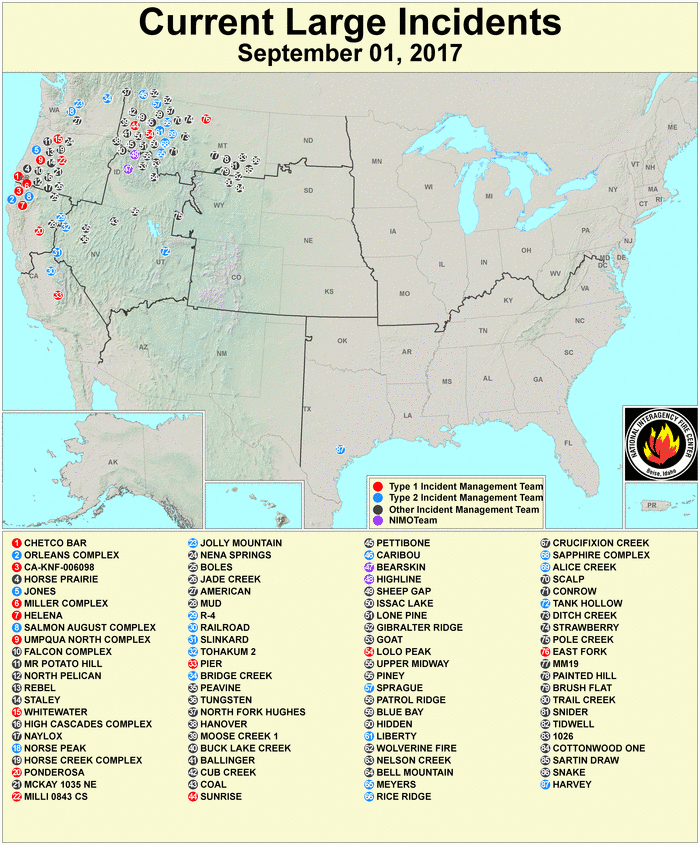
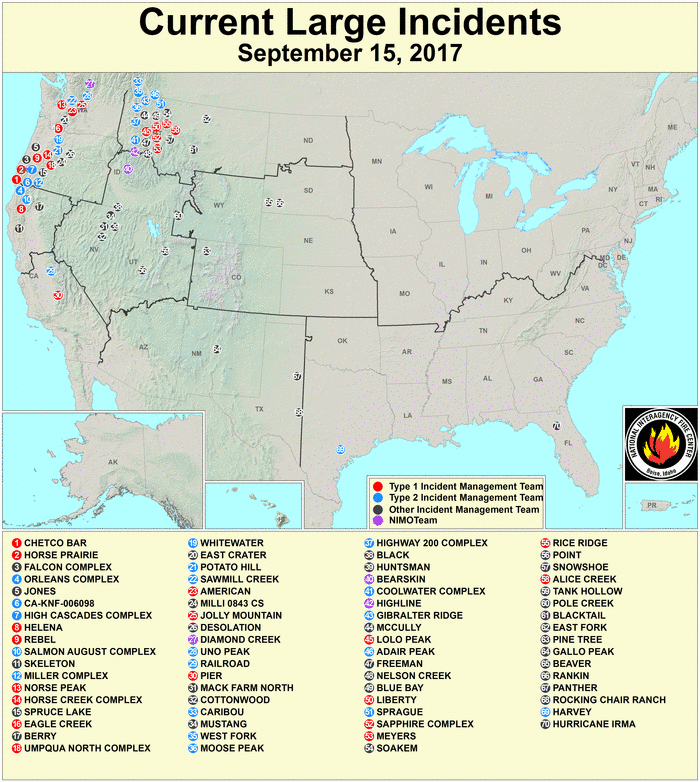
- During the first half of the month, the long-wave ridge in the West deflected Pacific air masses and fronts well to the north into western Canada. Subsiding air associated with ridges tends to dry out and warm up adiabatically as it descends, and the clear skies allow sunshine to further warm the ground and air, so the western CONUS had unusually warm temperatures for September 1-14. Much of the West was drier than normal, although the Southwest was wetter than normal due to rains from the remnants of Tropical Storm Lidia early in the month and a subsequent cutoff low. Dozens of large wildfires were burning across the West at the beginning of the month, and the continued hot and dry weather was perfect for keeping them going (wildfire maps for September 1, 11, 15, 25, 27, 30) and for expanding and intensifying drought, especially in the Northwest and northern High Plains of Montana (U.S. Drought Monitor [USDM] maps for September 12 compared to August 29).
- In the eastern U.S., strong short-wave troughs moved through the long-wave trough, dragging cold and dry Canadian air masses southward across the eastern and central CONUS which resulted in well-below-normal temperatures for the first half of the month. The northwesterly flow at the upper levels of the atmosphere generally kept Gulf of Mexico moisture out of the CONUS, with much of the Plains and Midwest having below-normal precipitation. At the beginning of the month, the remnants of Hurricane Harvey were swept up in a cold front, and at mid-month Hurricane Irma slammed into Florida then deeper into the Southeast. These two tropical systems, and rain from other fronts, gave the Southeast and parts of the Ohio Valley and New England a wetter-than-normal September 1-14.
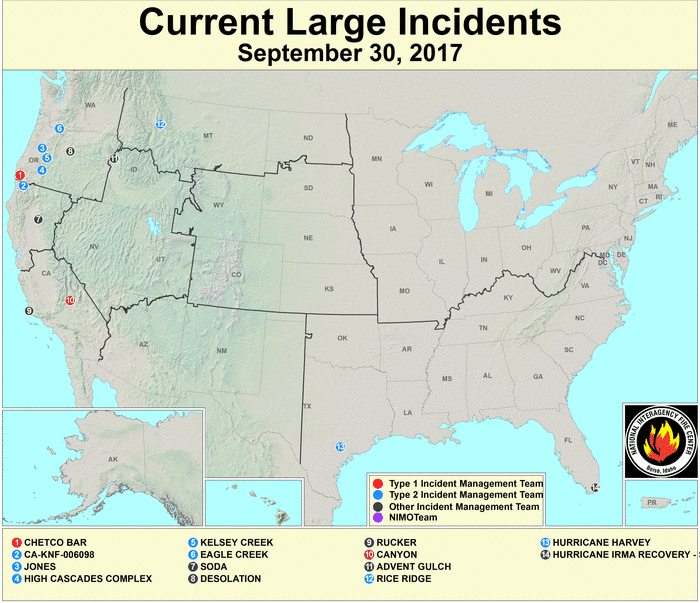
- As the remnants of Irma were swept across the eastern U.S. then out to sea in the westerly flow during September 13-16, the upper-level circulation pattern shifted to a long-wave trough in the West and ridge in the East. Pacific fronts and lows, and cooler Canadian air masses, were now funneled into the West, bringing colder-than-normal temperatures to the West and northern Plains during the last half of the month. The Pacific air masses gave much of the West above-normal precipitation for these weeks, while the fronts and lows were able to tap Gulf of Mexico moisture in a southerly flow when they crossed the Rockies to give the Great Plains above-normal precipitation. The western precipitation helped to diminish the wildfire threat (wildfire maps for September 1, 11, 15, 25, 27, 30) and contract drought (USDM maps for September 26 compared to September 12).
- The ridge in the East deflected the storm track to the north into Canada during the last half of the month, so fronts frequently stalled out over the Plains and Upper Midwest, leaving much of the Deep South, and CONUS east of the Mississippi River, drier than normal. With descending air beneath the ridge, sunny skies, and a southerly flow advecting warmer air masses north, the eastern half of the CONUS had warmer-than-normal temperatures for September 15-28. The eastern ridge and its steering currents also helped keep Hurricane Jose out to sea, where it meandered just off the East Coast for several days. The ridge's steering currents, and the weakness in the surface pressure field created by Jose's earlier trek near the East Coast, helped keep Hurricane Maria away from the CONUS as it followed in Jose's footsteps along the western edge of the North Atlantic High.
The regional and meridional characteristics of the atmospheric circulation and temperature and precipitation anomalies become hard to identify at the monthly level because the averaging process masks out the extremes that occurred during the two halves of the month.
- The monthly averaged upper-level circulation consists of two troughs — one over the Southwest and one over the Southeast, representing the aggregated effects of the western trough (Southwest) and Hurricanes Harvey and Irma (Southeast) — and above-normal 500-mb heights from the central Plains to Northeast, representing the aggregated effect of the eastern ridge.
- The monthly upper-level circulation anomalies are reflected in the monthly temperature anomalies at the surface. Monthly temperatures were near to slightly below average beneath the Southwest and Southeast troughs, and above average from the central Plains to Northeast beneath the above-normal 500-mb height anomalies. The greatest temperature anomalies were over this warm central Plains to Northeast corridor, but monthly temperatures were also notably warmer than normal across parts of the West Coast, Florida, and New Mexico.
- The September statewide average temperature ranks also reflected the result of averaging the extreme regimes of the first half of the month and second half of the month. Nine states in the Great Lakes to Northeast had September temperature ranks in the top ten warmest category, but the rest of the states ranked only moderately warm or near average. For the nation as a whole, September 2017 ranked as the 26th warmest September in the 123-year record.
- When daily temperature records are examined, the extreme warmth was a little more extreme, persistent, and/or widespread than the extreme cold. When integrated across the month, there were 7,567 record warm daily high (4,147) and low (3,420) temperature records. This was a little more than two times the 3,459 record cold daily high (2,250) and low (1,209) temperature records.
- September is in the transition period between summer and fall when heating demand in the northern states increases while cooling demand in the southern states can still be significant. The circulation pattern was highly meridional this month and flipped at mid-month. Heating demand was high in parts of the country and cooling demand was high in other parts during different times in the month, and both were low during other times in the month. The aggregate effect was a REDTI (Residential Energy Demand Temperature Index) value for September 2017 which ranked near the bottom third of the 123-year historical record for September at 44th lowest. This reflected an overall lower heating and cooling demand averaged across the country and for the entire month and is consistent with above-normal monthly temperatures in the more heavily-populated northern states of the Great Lakes and Northeast.
- The monthly precipitation anomaly pattern mostly reflected the impact of the wet anomalies. Where it was wetter than average during either half of the month, the monthly anomaly pattern was near to wetter than average. September dryness was evident generally for those areas which were drier than normal during both halves of the month. The driest corridor was from eastern Texas and Louisiana to the Great Lakes, but the month was also drier-than-normal across much of the Mid-Atlantic to Northeast and parts of the Southwest and Northwest. Five states ranked in the top ten driest category and included Louisiana (which tied the driest September on record), Illinois (fifth driest), Michigan (fifth driest), Missouri (fifth driest), and Arkansas (eighth driest). For the nation as a whole, September 2017 ranked as the 37th driest September on record, but it would have been a much drier rank if not for the rains of Harvey and Irma and the late-month fronts in the Plains.
- Some of the upper-level lows and their associated cold fronts had air that was cold enough for snow to form. Storm systems during the 16th-17th and 20th-25th dropped snow mostly on the northern Rockies, but much of the snow melted after a few days. Based on the 1966-2017 satellite record, September 2017 had the third largest September snow cover area for the CONUS in the 49-year satellite record. But this is early in the snow season when small amounts of snow can result in extreme ranks.
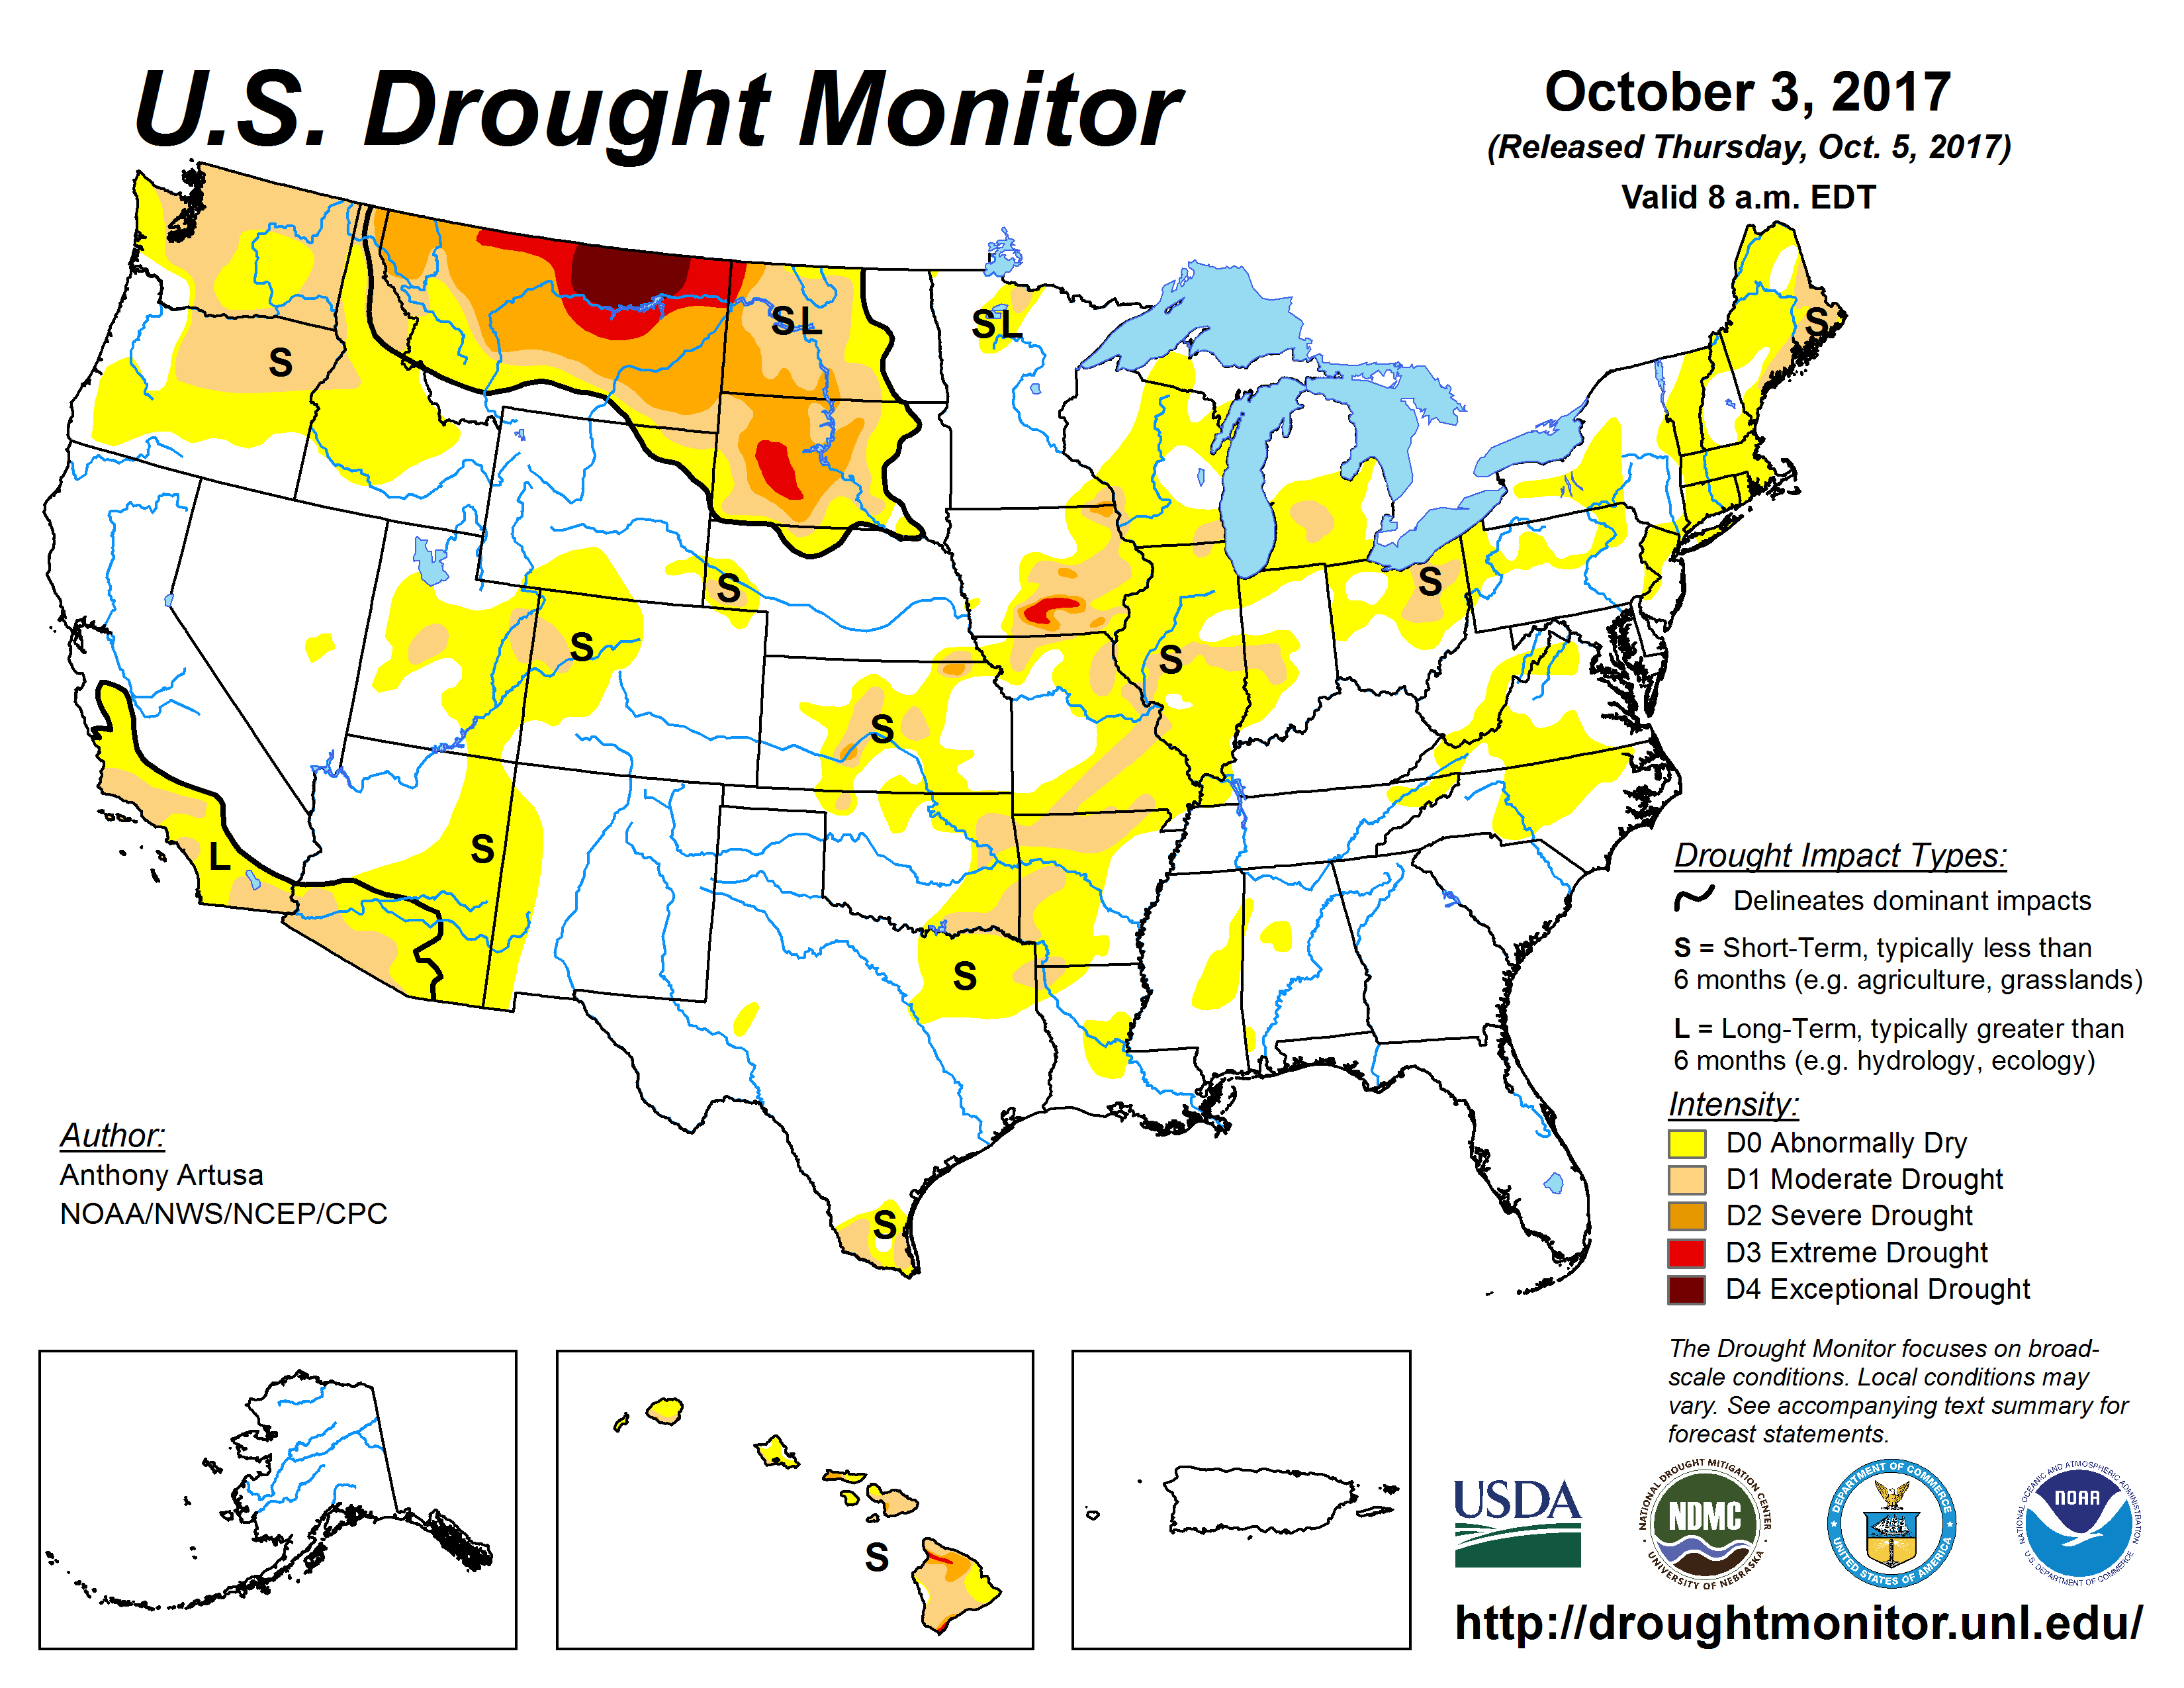
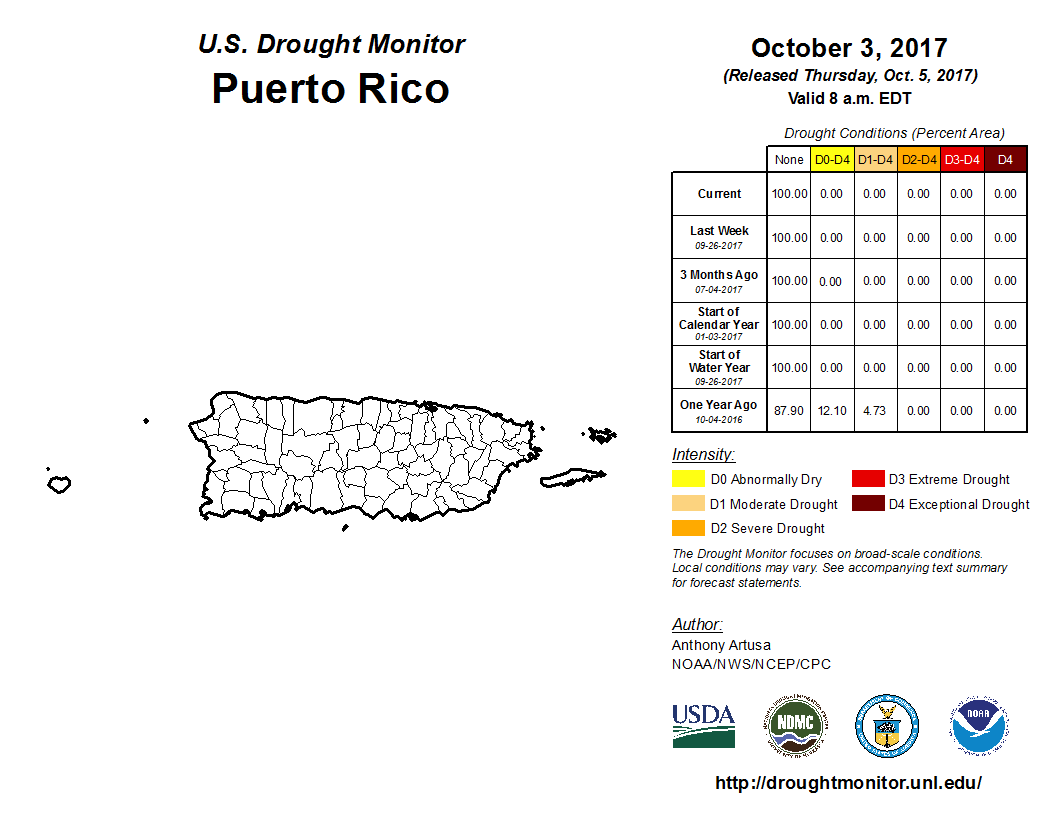
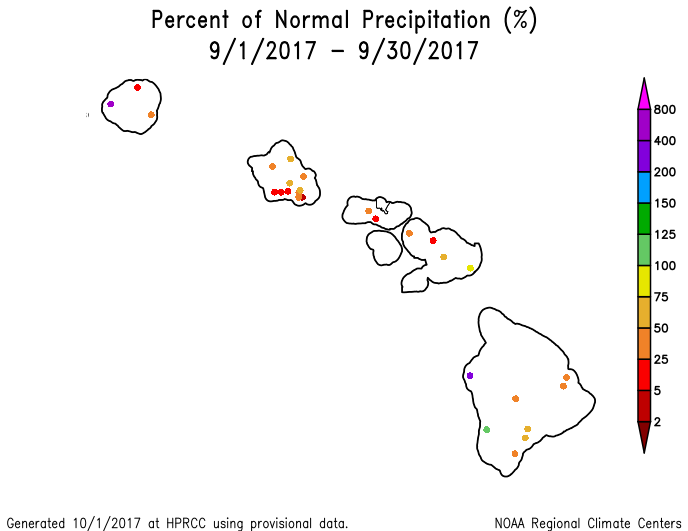
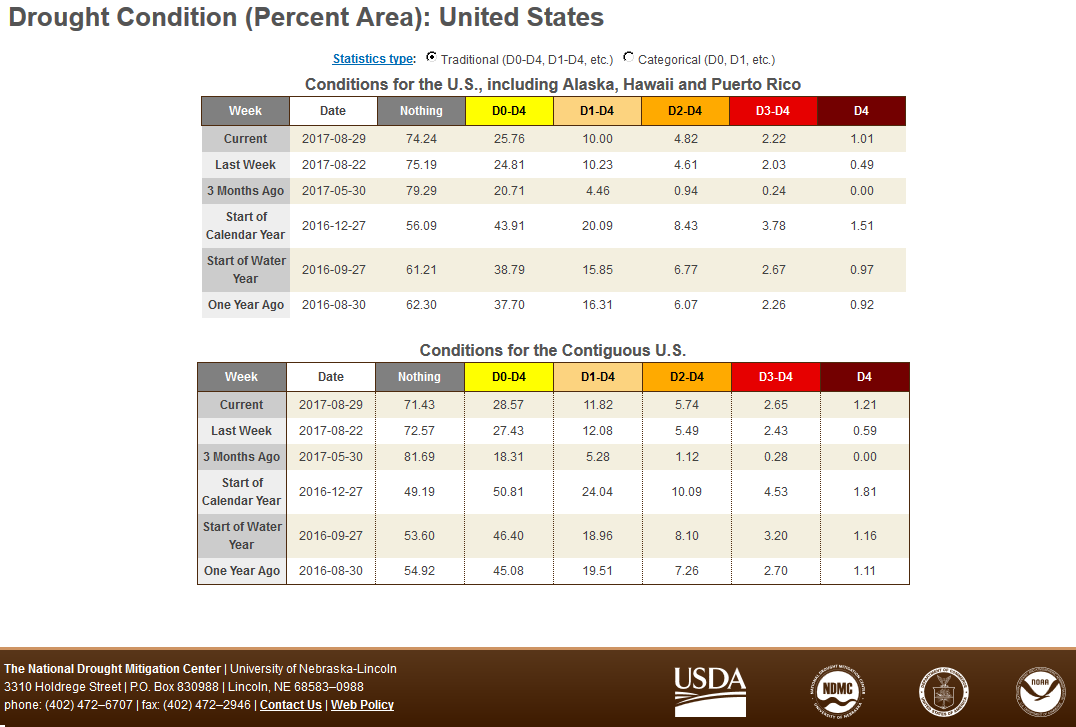
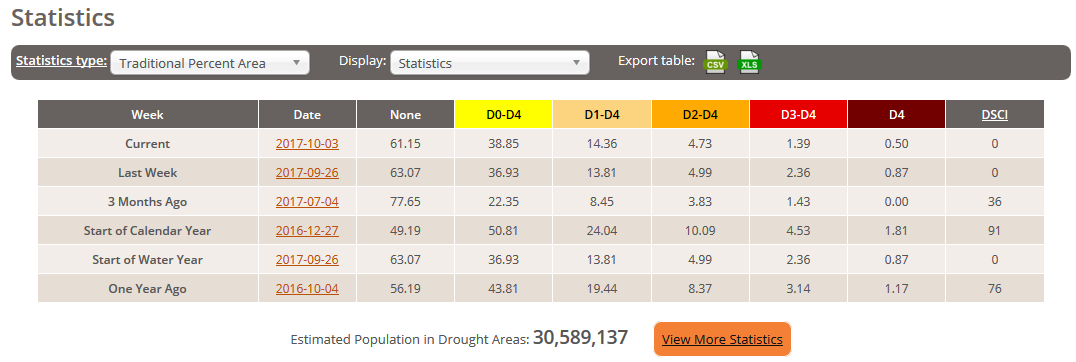
- The above-normal precipitation helped shrink drought and abnormally dry areas across parts of the Northwest, northern Rockies, and central to northern Plains, especially in the Dakotas and Montana which had been suffering from significant drought. Above-normal precipitation also helped eliminate abnormally dry areas in Alaska and Puerto Rico. But the dry weather from eastern Texas to the Great Lakes and across much of the Mid-Atlantic to Northeast states was, in some areas, a continuation of dryness that has lasted for the last two to three months. Drought and abnormal dryness expanded or intensified in the Arklatex, Midwest, and parts of the Mid-Atlantic to Northeast. Continued dryness in Hawaii (last 1, 2, and 3 months) expanded and intensified drought in the Aloha State. Expansion outweighed contraction, so at the national level drought expanded from 11.8 percent of the CONUS at the end of August to 14.4 percent of the CONUS at the end of September (from 10.0 percent to 12.1 percent for all of the U.S.).
Typically tropical cyclone activity is enhanced in the Eastern North Pacific and inhibited in the North Atlantic during El Niños, and inhibited in the Eastern North Pacific and enhanced in the North Atlantic during La Niñas, due mostly to changes in vertical wind shear during the two extreme events. The relationship is unclear during ENSO-neutral events. The tropical Pacific Ocean was in an ENSO-neutral state during September 2017. Without ENSO-related inhibitors shearing tropical systems, the mid-latitude jet stream and North Pacific and North Atlantic Highs had more of a controlling influence. The Atlantic and East Pacific basins saw slightly more active tropical cyclone activity than average.
- The Atlantic hurricane season runs from June 1st through November 30th and six tropical systems (Hurricanes Harvey, Irma, Jose, Katia, Lee, and Maria) were active in the North Atlantic during September. Hurricane Harvey ravaged Texas and Louisiana with flooding rains in August. Its remnants moved north and became entrained in a cold front over Tennessee on September 1st, then moved with the frontal system to bring rain along its path from the Ohio Valley to Northeast early in the month. Hurricane Irma raked the Antilles Island Chain, including Puerto Rico and the U.S. Virgin Islands, with devastating winds and heavy rains as it was steered along the southern boundary of the North Atlantic High. It tracked up the Florida peninsula along a weakness in the pressure field, bringing widespread damage to the Sunshine State. Irma ploughed into the interior Southeast just as the upper-level circulation pattern over the eastern CONUS shifted from an upper-level trough to an upper-level ridge. The moisture from the remnants of Irma brought widespread rain to the Southeast and Midwest before being caught up in the jet stream flow and carried northeast. Hurricane Jose followed a few days later in Irma's track, brushing the northern islands of the Lesser Antilles before being steered north. By the time Jose approached the U.S. mainland, the eastern ridge had become established and kept it out to sea, but just off the East Coast. In the meantime, Hurricane Katia developed in the western Gulf of Mexico and meandered under weak steering currents, eventually coming ashore in Mexico. But the remnants of Katia tracked across Mexico, re-emerged over the eastern Pacific and, like the legendary phoenix bird, eventually re-developed into Hurricane Otis. Hurricane Lee formed in the eastern tropical Atlantic and took a turn to the north early in its life, meandering into the heart of the North Atlantic High where it languished until being caught up in the jet stream and moved east near the end of the month. Hurricane Maria was a contemporary of Lee in time (both hurricanes lived during the last half of the month), but formed further west, closer to the Antilles. Steered by easterly winds along the southern side of the North Atlantic High, Maria took a path similar to that of Irma, bringing destruction to the Lesser Antilles before taking dead aim at Puerto Rico. After devastating the U.S. Virgin Islands and Puerto Rico, Maria turned north, following a weakness in the pressure field steering currents created by the earlier passage of Jose, and partially being deflected by the upper-level ridge over the eastern CONUS. Maria stayed out over the North Atlantic, brushing the Carolina coast with wind, surf, and rain, before being swept further out to sea by a fast-moving cold front.
- The Eastern North Pacific hurricane season runs from May 15th through November 30th and five tropical systems (Hurricanes Max, Norma, and Otis, and Tropical Storms Lidia and Pilar) were active during September. Tropical Storm Lidia formed at the end of August and slowly crawled north along Baja California beneath the upper-level ridge which began to dominate western North America at the beginning of September. Moisture from the remnants of Lidia fed showers over the Southwest early in the month. As mentioned earlier, the remnants of Atlantic Hurricane Katia drifted across Mexico then emerged over the eastern Pacific. By the time the low pressure depression had intensified into named storm Otis, it was well out to sea away from Mexico. Hurricane Otis continued drifting under weak steering currents until dissipating around September 21st. Hurricane Max formed off the coast of southern Mexico at mid-month, and brought rain and wind to Mexico during its short life. Hurricane Norma formed at mid-month and threatened the southern tip of Baja California before veering west under weak steering currents and dissipating. Tropical Storm Pilar tracked north along the western Mexico coast during the last half of the month before dissipating when it moved inland. By that time, the upper-level trough had become established over western North America and likely helped block Pilar's advance toward the U.S. Southwest.
- No tropical cyclones formed in, or moved into, the Central North Pacific.
- Five named tropical systems (Typhoons Sanvu, Talim, and Doksuri, and Tropical Storms Guchol and Mawar) were active in the western Tropical Pacific near the U.S.-Affiliated Pacific Islands (USAPI) in Micronesia, but none of them had any significant effect on the USAPI. Sanvu formed as an area of convection near Guam, but developed after it had moved away from the USAPI. Likewise for Talim which formed as a tropical disturbance between Guam and Chuuk. All five of these tropical cyclones reached tropical storm or typhoon status either west or north of the USAPI. A few other tropical disturbances briefly appeared within USAPI waters but quickly dissipated before developing further.
The Climate Extremes Index (CEI) aggregates temperature and precipitation extremes across space and time. During September 2017, the meridional circulation resulted in some extreme weather, but the flipping of the circulation to the opposite pattern at mid-month tended to dampen the effect of the extreme weather on the cumulative CEI. Several regions had top ten or near-top ten CEI components. For example, the Northeast region had its eighth most extreme warm minimum temperature component in the 1910-2017 record and eleventh most extreme warm maximum temperature component; the East North Central region had its seventh most extreme warm minimum temperature component, ninth most extreme warm maximum temperature component, and eighth most extreme wet spell component; and the Central region had its 13th most extreme days without precipitation component. Yet none of the nine regions had a regional CEI that ranked in the top ten most extreme. Even with the devastating hurricanes this month, the national CEI for September 2017 didn't make the top ten cut — with the tropical cyclone component, it ranked only 38th most extreme; without the tropical cyclone component, the rank was 90th most extreme out of 108 years, or 19th least extreme.
 North America monthly upper-level circulation pattern and anomalies. The upper-level circulation pattern during September flipped at mid-month. During the first half of the month, it mostly consisted of a ridge in the West and trough in the East. During the last half of the month, it mainly consisted of a trough in the West and ridge in the East. When these contrasting patterns are averaged over the month, the pattern consists of two troughs — one over the Southwest and one over the Southeast — with fairly zonal flow along the Canadian border with the hint of a ridge over the Upper Midwest. The upper-level (500-mb) height anomalies are slightly below normal with the troughs over the Southwest and Southeast, and well above normal from the central Plains to Northeast, extending into and across most of Canada. |
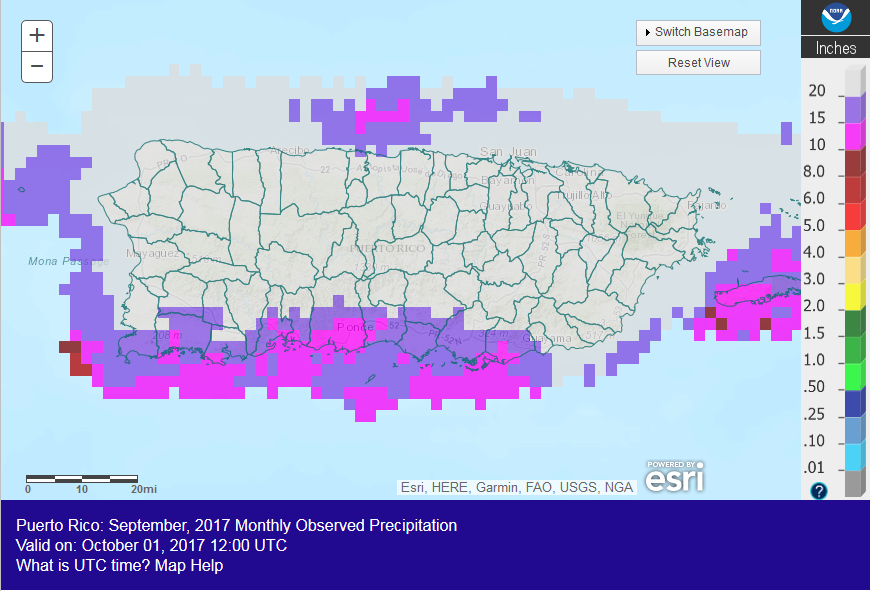
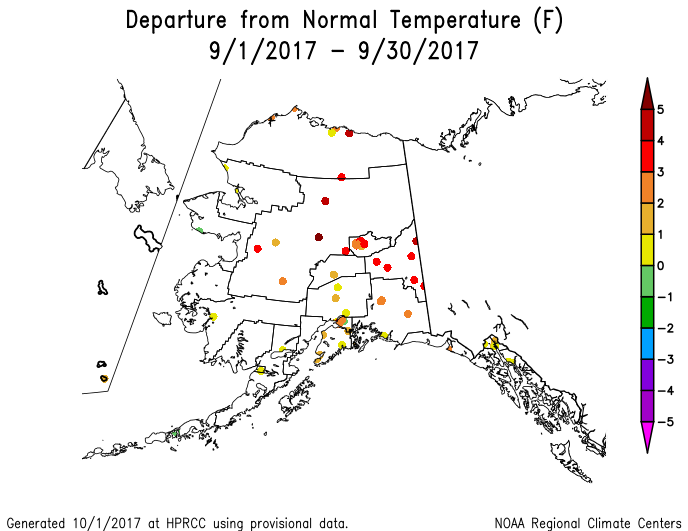
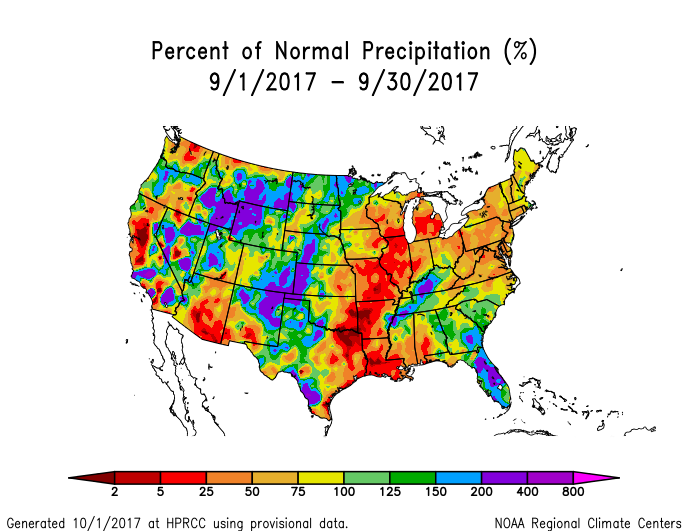 Map of monthly precipitation anomalies. The September precipitation anomaly pattern was driven largely by the dominant upper-level circulation and moisture from tropical cyclones. The upper-level ridge over the western CONUS during the first half of the month resulted in drier-than-normal conditions across most of the West, Great Plains, and Great Lakes, while frontal precipitation and rains from the remnants of Hurricanes Harvey and Irma soaked parts of the Ohio Valley, Southeast, and New England. The Southwest was wetter than normal during the first half of the month due to rains from the remnants of Tropical Storm Lidia and a subsequent cutoff low. During the second half of the month, above-normal precipitation fell across much of the West and Plains along fronts and lows associated with the western upper-level trough, while the eastern CONUS was drier than normal beneath a dominant upper-level ridge. The September monthly precipitation anomaly pattern results from a merging of these dichotomous half-month patterns. For the month as a whole, much of the West, Plains, and Southeast was wetter than normal, while other parts of the West, much of the Mid-Atlantic to Northeast, and the region from eastern Texas to the Great Lakes were drier than normal. Hawaii was mostly drier than normal. Precipitation anomaly maps for Puerto Rico were not available, but the island was generally wetter than normal from heavy rains associated with Hurricanes Irma and Maria. Alaska had a mixed precipitation anomaly pattern, with generally drier-than-normal conditions at stations in the interior southeast and wetter-than-normal conditions in the north. |
 Map of monthly temperature anomalies. The monthly temperature anomaly map represents a mixture of two dichotomous patterns. During the first half of the month, temperatures were much warmer than normal across the western half of the CONUS, beneath the predominant upper-level ridge, and much below normal across the eastern half, beneath the predominant upper-level trough. The pattern shifted at mid-month so that the last half of the month was colder than normal in the West and warmer than normal in the East. When averaged together, the monthly temperature anomaly pattern across the CONUS consisted of areas of below-normal and above-normal temperatures in both the West and the East, with above-normal temperatures dominating from the Upper Midwest to Northeast. Alaska was mostly warmer than normal for the month. |
 Northern Hemisphere monthly upper-level circulation pattern and anomalies. Global Linkages: The upper-level (500-mb) circulation anomaly pattern over North America was part of a complex long-wave pattern that stretched across the Northern Hemisphere. East-west trough/ridge pairs (or couplets) and anomaly couplets could be found in the monthly maps, especially over Eurasia, North Atlantic/Northern Europe, and North Pacific/North America. But they were much more evident in the anomaly maps when broken up into the first half of the month and second half of the month. The above-normal 500-mb heights were associated with upper-level ridging at the mid-latitudes; below-normal precipitation (over eastern Canada, northern Scandinavia); above-normal surface temperatures over most of Canada and western Russia; and warm SST anomalies in parts of the North Atlantic and North Pacific. The areas of below-normal 500-mb heights were associated with upper-level troughing; near- to below-normal surface temperatures over Europe and central Siberia; cool SST anomalies in parts of the North Pacific and North Atlantic; above-normal precipitation over Europe and central Siberia; and above-normal snow cover over central Siberia. Parts of Russia, Europe, and the CONUS were near to cooler than normal. But with large parts of the continents still having warmer-than-normal temperatures, and large portions of the Atlantic and Pacific Oceans having warmer-than-normal sea surface temperatures, the September 2017 global temperature was well above normal. |
Atmospheric Drivers
Subtropical highs, and fronts and low pressure systems moving in the mid-latitude storm track flow, are influenced by the broadscale atmospheric circulation. The circulation of the atmosphere can be analyzed and categorized into specific patterns. The Tropics, especially the equatorial Pacific Ocean, provides abundant heat energy which largely drives the world's atmospheric and oceanic circulation. The following describes several of these modes or patterns of the atmospheric circulation, their drivers, the temperature and precipitation patterns (or teleconnections) associated with them, and their index values this month:
-
El Niño Southern Oscillation (ENSO)
- Description: Oceanic and atmospheric conditions in the tropical Pacific Ocean can influence weather across the globe. ENSO is characterized by two extreme modes: El Niño (warmer-than-normal sea surface temperature [SST] anomalies in the tropical Pacific) and La Niña (cooler-than-normal SST anomalies), with the absence of either of these modes termed "ENSO-neutral" conditions.
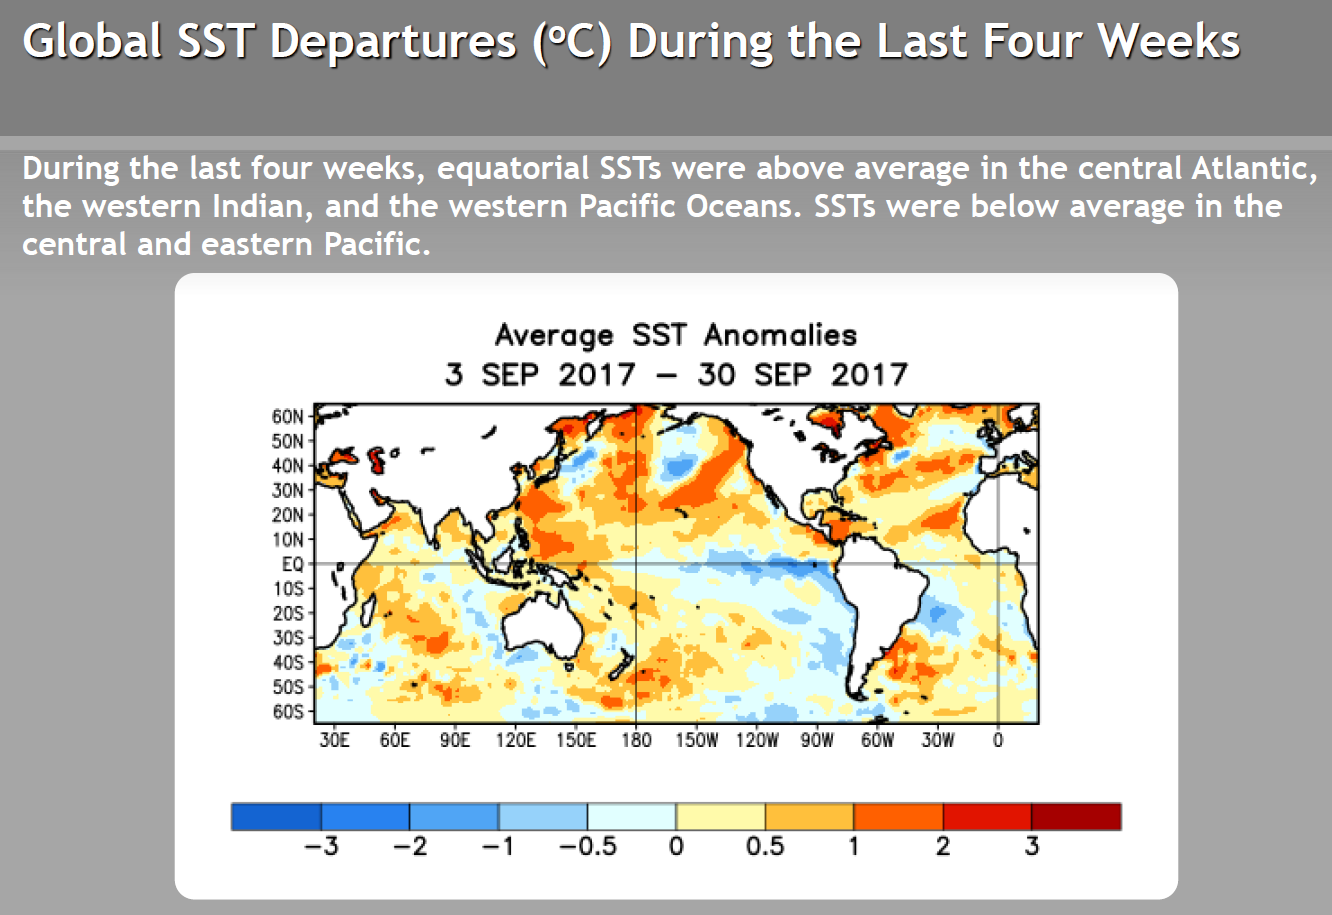
- Status: ENSO-neutral conditions were present during September 2017 with near to below-average SSTs across the central and eastern equatorial Pacific Ocean.
- Teleconnections (influence on weather): The NWS CPC has no teleconnections for ENSO-neutral conditions.
- Comparison to Observed: The September 2017 temperature and precipitation anomaly patterns do not match the teleconnection patterns for either El Niño or La Niña.
-
Madden-Julian Oscillation (MJO)
- Description: The MJO is a tropical disturbance or "wave" that propagates eastward around the global tropics with a cycle on the order of 30-60 days. It is characterized by regions of enhanced and suppressed tropical rainfall. One of its indices is a phase diagram which illustrates the phase (1-8) and amplitude of the MJO on a daily basis. The MJO is categorized into eight "phases" depending on the pattern of the location and intensity of the regions of enhanced and suppressed tropical rainfall. The MJO can enter periods of little or no activity, when it becomes neutral or incoherent and has little influence on the weather. Overall, the MJO tends to be most active during ENSO-neutral years, and is often absent during moderate-to-strong El Niño and La Niña episodes.
- Status: The MJO Wheeler-Hendon index spent most of the month inside the unit circle (i.e., was an incoherent signal), treading weakly into phases 2 and 3 near the end of the month. Other aspects of the tropical ocean-atmosphere system (referred to in the CPC reports as the background or low frequency state, Kelvin and Rossby waves, and tropical cyclone activity), as well as interactions with mid-latitude circulation patterns, appeared to play a role in influencing the month's climate (especially Kelvin and Rossby waves and tropical cyclones) (MJO updates for September 4, 11, 18, 25, and October 2).
- Teleconnections (influence on weather): The MJO's temperature and precipitation teleconnections to U.S. weather depend on time of year and MJO phase. There are no teleconnections for an incoherent MJO.
- The Pacific/North American (PNA) pattern
- Description: The PNA teleconnection pattern is associated with strong fluctuations in the strength and location of the East Asian jet stream. PNA-related blocking of the jet stream flow in the Pacific can affect weather downstream over North America, especially the West and especially in the winter half of the year.
- Status: The daily PNA index oscillated weakly around zero for most of the month, but ended the month strongly negative, averaging weakly negative for the month as a whole. The 3-month-averaged index was slightly positive.
- Teleconnections (influence on weather): To the extent teleconnections are known, a negaitive PNA for this time of year (October on the quarterly teleconnection maps) is associated with below-normal temperatures across Alaska, the West Coast, and western Canada; above-normal temperatures across the southern Plains and Southeast; below-normal upper-level circulation anomalies over western North America; above-normal upper-level circulation anomalies from Texas to the East Coast; and above-normal precipitation in the Midwest (although the precipitation teleconnections are weak).
- Comparison to Observed: The September 2017 temperature, precipitation, and upper-level circulation anomaly patterns do not agree with the teleconnections for a negative PNA. However, the upper-level circulation anomaly pattern for the last half of the month is a reasonable match for the teleconnections associated with a negative PNA.
- The Arctic Oscillation (AO) pattern
- Description: The AO teleconnection pattern relates upper-level circulation over the Arctic to circulation features over the Northern Hemisphere mid-latitudes and is most active during the cold season.
- Status: The daily AO index oscillated around zero for the first half of the month then turned negative, averaging negative for the month. The 3-month-averaged index was positive.
- Teleconnections (influence on weather): To the extent teleconnections are known, a negative AO in August (July-September in the AO Composites table) is typically associated with dry conditions in the southern Plains, Midwest, and Southeast; wet conditions in Kansas and Nebraska; above-normal temperatures in Texas; below-normal temperatures in the northern Plains; near-normal temperatures elsewhere across the CONUS; above-normal upper-level circulation anomalies over the Arctic Ocean extending into the North Atlantic; and below-normal upper-level circulation anomalies spanning both the North Pacific and North Atlantic Oceans and over eastern North America.
- Comparison to Observed: The September 2017 monthly temperature, precipitation, and upper-level circulation anomaly patterns do not agree with the teleconnections for a negative AO.
- The North Atlantic Oscillation (NAO) pattern
- Description: The NAO teleconnection pattern relates upper-level circulation over the North Atlantic Ocean to circulation features over the Northern Hemisphere mid-latitudes.
- Status: The daily NAO index was near zero at the beginning and end of the month, slightly negative in the middle of the month, and averaged negative for the month. The 3-month-averaged index was near zero.
- Teleconnections (influence on weather): To the extent teleconnections are known, a negative NAO during this time of year (October on the quarterly teleconnection maps) is associated with below-normal upper-level circulation anomalies over the eastern CONUS, extending across the North Atlantic to Western Europe; above-normal circulation anomalies over northern Canada to Greenland; and drier-than-normal precipitation anomalies in the Ohio Valley, but the precipitation teleconnections are weak. There are no temperature teleconnections in the CONUS.
- Comparison to Observed: The September 2017 precipitation and upper-level circulation anomaly patterns don't match the teleconnections for a negative NAO.
- The West Pacific (WP) pattern
- Description: The WP teleconnection pattern is a primary mode of low-frequency variability over the North Pacific and reflects zonal and meridional variations in the location and intensity of the (East Asian) jet stream in the western Pacific.
- Status: The monthly WP index was negative, and the three-month average WP index was also negative.
- Teleconnections (influence on weather): To the extent teleconnections are known, a negative WP during this time of year (October on the quarterly teleconnection maps) is typically associated with below-normal temperatures from Alaska to the central Plains and Great Lakes; below-normal circulation anomalies over the north central CONUS to central Canada; above-normal circulation anomalies over the eastern North Pacific; and above-normal precipitation in the Pacific Northwest, western to south central Canada, the Great Lakes, and the Southeast.
- Comparison to Observed: The September 2017 monthly temperature, precipitation, and upper-level circulation anomaly patterns do not agree with the teleconnections for a negative WP.
- The Pacific Transition (PT) pattern
- Description: The PT teleconnection pattern relates upper-level circulation over the central subtropical North Pacific to circulation features over North America. It is a significant factor in the earth's circulation during August and September.
- Status: The PT index was positive during September.
- Teleconnections (influence on weather): To the extent teleconnections are known, a positive PT is typically associated with warmer-than-normal temperatures for the western CONUS and western Canada, colder-than-normal temperatures for the eastern CONUS, and drier-than-normal conditions in the Midwest, Alaska, and parts of the Pacific Northwest to Northern Plains. The upper-level circulation anomalies for a positive PT are below-normal 500-mb geopotential heights over the eastern third of the CONUS into the North Atlantic, below-normal heights over the northeastern Pacific (including the Gulf of Alaska), and above-normal heights over the western half of the CONUS into south central Canada and across the central North Pacific.
- Observed: The September 2017 monthly precipitation, temperature, and upper-level circulation anomaly patterns do not match the teleconnections for a positive PT. However, the circulation, temperature, and precipitation anomaly patterns for the first half of September are all a very good match, and the monthly precipitation anomaly pattern has some agreement from the central Plains to Great Lakes, although it is opposite over the West.
- The East Pacific-North Pacific (EP-NP) pattern
- Description: The EP-NP teleconnection pattern relates SST and upper-level circulation patterns (geopotential height anomalies) over the eastern and northern Pacific to temperature, precipitation, and circulation anomalies downstream over North America. Its influence during the winter is not as strong as during the other three seasons.
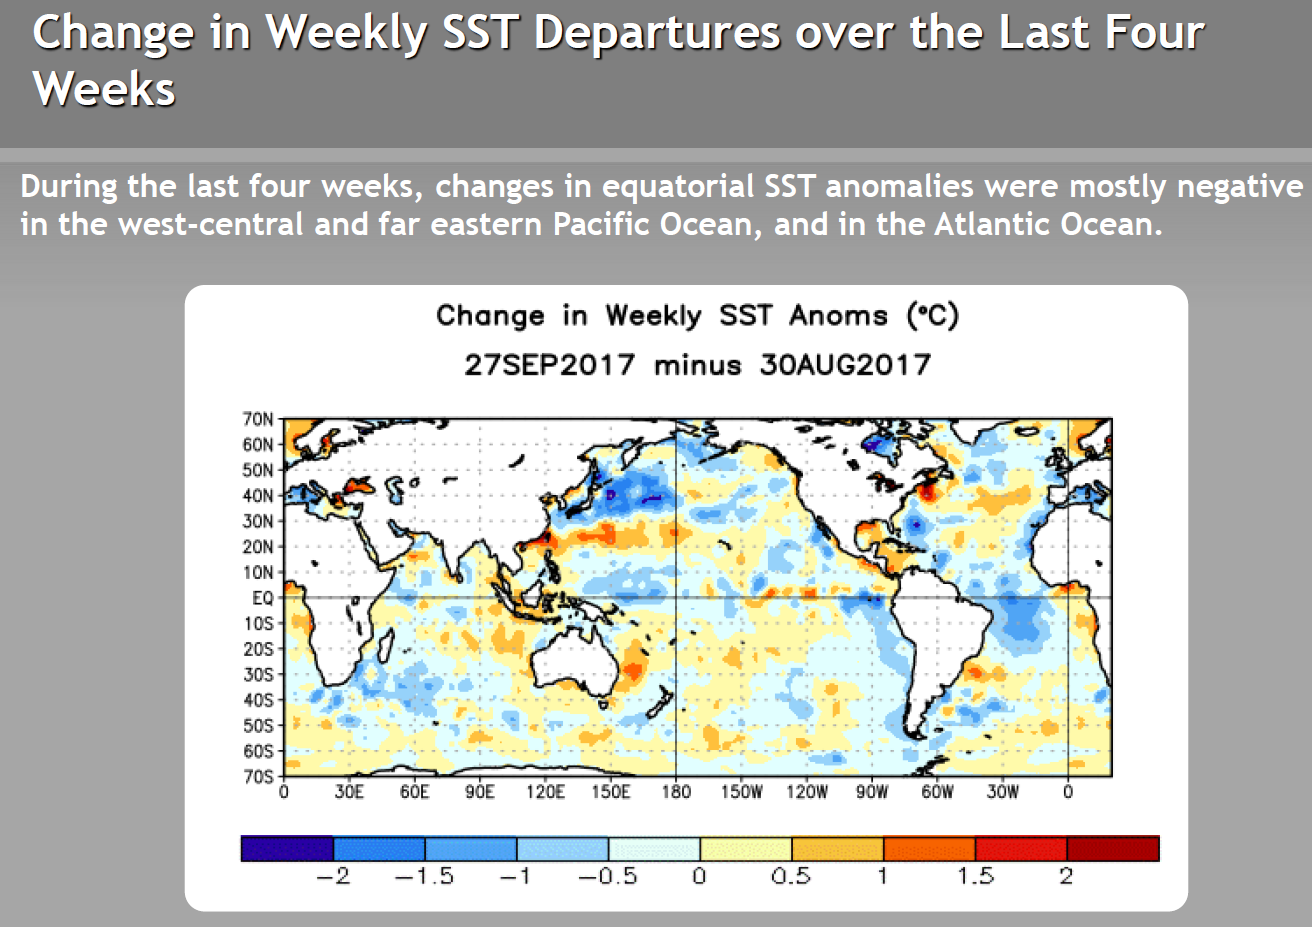
- Status: North Pacific SSTs cooled during September. They were still warmer than normal across most of the North Pacific, but pockets of cooler-than-normal SSTs developed or expanded near Japan, south of Alaska, and along the equatorial Pacific west of South America. Much of the North Atlantic continued warmer than normal, with notable warming occurring in the Caribbean Sea and Gulf of Mexico. The North Atlantic High (Bermuda High) and North Pacific High were evident on the average sea level pressure (SLP) field map. The SLP anomaly field indicated that the North Atlantic and North Pacific Highs were near normal strength, the North Pacific's Aleutian Low was shifted slightly over the Gulf of Alaska, and the North Atlantic's Icelandic Low was stronger than normal. The average SLP map also shows high pressure over the eastern CONUS, reflecting the frequent passage of Canadian air masses, with their associated higher pressures, behind cold fronts. Both the average and anomaly SLP maps show the effect of the hurricane track off the East Coast of the CONUS. The Aleutian and Icelandic Lows also reflected the slightly enhanced 500-mb troughing in those areas, although the monthly maps mask the greater variability that occurred during the first and second halves of the month (average and anomaly 500-mb map for September 1-14, average and anomaly 500-mb map for September 15-28). The September 2017 monthly EP-NP index was negative, as was the 3-month running mean.
- Teleconnections (influence on weather): To the extent teleconnections are known, a negative EP-NP index this time of year (October on the quarterly teleconnection maps) is typically associated with warmer-than-normal temperatures across the CONUS from the Great Plains to East Coast (except the Southeast) and across central to eastern Canada; below-normal temperatures over Alaska; below-normal upper-level circulation anomalies (weaker upper-level ridge) over Alaska and western Canada; and above-normal upper-level circulation anomalies across central to eastern North America (weaker upper-level trough) and over the central North Pacific. The precipitation teleconnections are weak but suggest wetter-than-normal conditions over the Pacific Northwest.
- Comparison to Observed: The September 2017 upper-level circulation anomaly pattern is similar to the teleconnections for a negative EP-NP, but appears shifted slightly. The temperature anomaly pattern has some agreement over the CONUS, although it is not as extensive, and it is opposite over Alaska. The precipitation anomaly pattern has some agreement where the few teleconnections exist. However, there is a much better correlation between eastern CONUS temperature anomalies and eastern North America upper-level circulation anomalies for the second half of the month with the corresponding teleconnection patterns.
Examination of the available circulation indices and their teleconnection patterns, and comparison to observed September 2017 monthly temperature, precipitation, and circulation anomaly patterns, suggest that it was difficult to trace the weather over the CONUS in September to any specific atmospheric drivers. The MJO was weak to incoherent; the equatorial Pacific was in an ENSO-neutral state; and the PNA, AO, and NAO daily indices oscillated around zero for most of the month, moving into negative territory briefly at various times of the month and averaged negative for the month. The WP was negative for the month, while the PT was positive for the month. There was generally little to no agreement between the monthly observed patterns and the teleconnections for these indices. The EP-NP teleconnections had some agreement with the observed monthly upper-level circulation anomaly pattern, but it appeared shifted. There was little agreement for the monthly temperature and precipitation anomaly patterns.
However, when the observed anomaly patterns for the two halves of the month are compared separately, there is some agreement. The PT teleconnections are a good match for the upper-level circulation, temperature, and precipitation anomaly patterns for the first half of the month. For the last half of the month, the PNA teleconnections are a good match for the upper-level circulation anomaly pattern, and the EP-NP also is a good match for the upper-level circulation and temperature anomaly patterns.
This month illustrates several things. First, it illustrates how the weather and climate anomaly patterns are influenced by atmospheric drivers (or modes of atmospheric variability) originating in the North Pacific. Second, it illustrates how tropical cyclones can have an important effect on the monthly climate. Third, it shows the importance of selecting an appropriate time scale to examine and how signals can be masked when averaging over a monthly time scale.