Note: This Synoptic Discussion describes recent weather events and climate anomalies in relation to the phenomena that cause the weather. These phenomena include the jet stream, fronts and low pressure systems that bring precipitation, high pressure systems that bring dry weather, and the mechanisms which control these features — such as El Niño, La Niña, and other oceanic and atmospheric drivers (PNA, NAO, AO, and others). The report may contain more technical language than other components of the State of the Climate series.
Summary
The Earth's ocean-atmosphere system continued in an ENSO-neutral state during September 2018. Like the last several months, the upper-level circulation was quite active this month with shortwave ridges and troughs migrating through the jet stream flow over the contiguous United States (CONUS). This activity took place within a bigger picture wherein a large broadscale/long-wave ridge dominated the overarching circulation in the East and South, while troughs dominated the monthly circulation in the Northwest to north central regions, especially later in the month. Ridging kept precipitation below normal across the West (which brought little relief to those fighting the numerous wildfires) and temperatures above normal in the Southwest, while ridging in the East brought record to near-record warm temperatures. Several tropical systems contributed heavy precipitation to the monthly totals in parts of the country, especially east of the Rockies and in Hawaii. Rain from frontal systems and tropical systems gave the CONUS the third wettest September in the 1895-2018 record, with drought and abnormal dryness contracting in the Plains to Great Lakes and parts of the Southwest, Southeast, and Northeast, as well as Hawaii. Expansion of drought or abnormal dryness occurred over the drier-than-normal areas, especially parts of the West, northern Plains, and Southeast. Drought contraction outweighed expansion this month, so the national drought footprint shrank when compared to the end of August. The active troughs and lows, and their associated fronts, as well as the tropical systems, generated severe weather almost every day, and resulted in a total (preliminary) tornado count that was above the long-term average. Numerous tropical cyclones developed in the Atlantic and Pacific basins, with several turning north and reaching the mid-latitudes to add their energy and moisture to the westerly circulation. See below for details.
Synoptic Discussion
 Animation of daily upper-level circulation for the month.
|
 Animation of daily surface fronts and pressure systems for the month.
|
In the Northern Hemisphere, September marks the beginning of climatological fall (autumn) which is the time of year when solar heating decreases as the sun angle decreases, and an expanding circumpolar vortex forces the jet stream to migrate southward. Polar air masses begin to influence the weather over the contiguous U.S. (CONUS) more, and the warm, dry subtropical high pressure belts influence the weather less.
The upper-level circulation during September 2018 was a continuation of the tug of war between the subtropical high pressure systems, with their warm and dry weather, and the mid-latitude troughs, fronts, and low pressure systems, which generally bring wet and cooler weather from the north, but the subtropical highs held on a little while longer, with help from upper-level ridging. And this month, tropical systems entered into the mix, bringing rain to the CONUS in an assault from the south.
When broken down into sub-monthly circulation regimes:
- During September 1-10, subtropical highs dominated the North Atlantic Ocean and southeastern CONUS, as well as over the North Pacific and U.S. Southwest, with short-wave troughs staying along the northern tier states. The ridging kept temperatures warmer than normal in the West and East.
- During September 11-19, an upper-level trough held sway over the West, while high pressure continued its dominance over the southern Plains to East. The circulation pattern was reflected at the surface by below-normal temperatures from the West Coast to northern Rockies and above-normal temperatures across most of the rest of the CONUS.
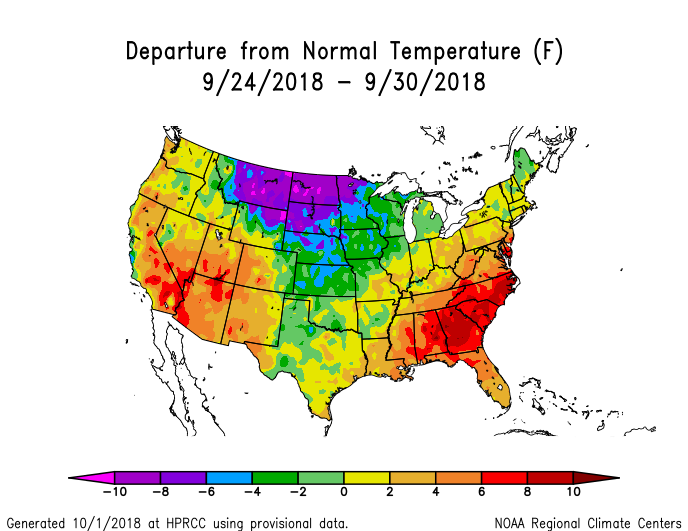
- During the last third of the month (September 20-30), the jet stream became more elongated (meridional) with stronger troughs migrating across the CONUS. A trough became "stuck" over the northern Plains during the 25th-28th, with ridges over the West and East Coasts. This was reflected at the surface by below-normal temperatures from the northern and central Plains to Great Lakes, where cold fronts frequently passed, and above-normal temperatures in the Southwest and Southeast, which were dominated by the ridging. At the end of the month (September 29-30), an upper-level low from the Pacific moved into the Pacific Northwest, forcing a ridge ahead of it which pushed the trough out of the northern Plains.
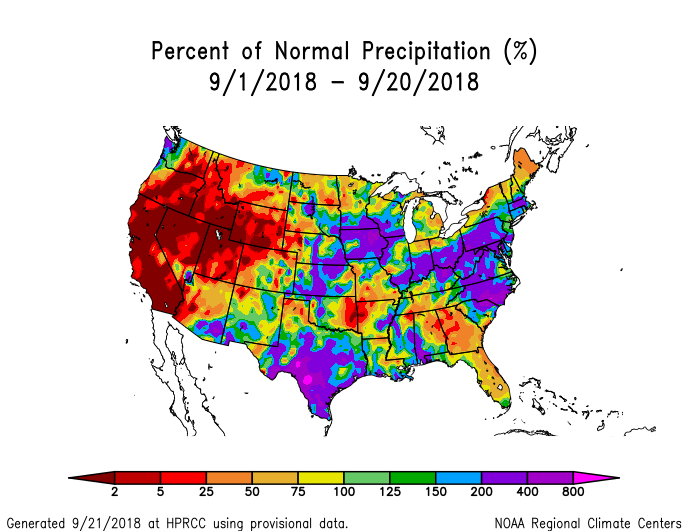
The precipitation pattern was controlled largely by the upper-level circulation regime, with their fronts and surface lows, but the tropical systems added a complicating factor:
-
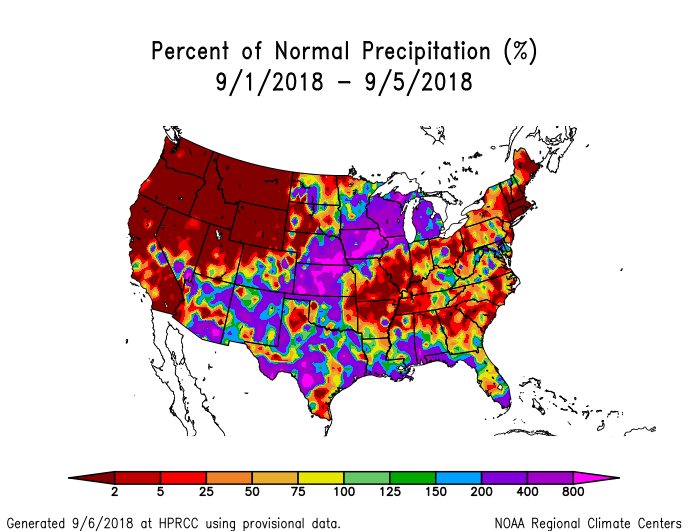
For September 1-20, fronts move across the northern tier states, mostly blocked by the subtropical highs from penetrating too far south, but there were a few exceptions. The fronts generated above-normal precipitation across the Plains to Great Lakes during the 1st to 5th, but then things got complicated. The exceptions:
- September 3-11: One front penetrated into the southern Plains. Meanwhile, Tropical Storm Gordon moved west across the Gulf of Mexico (steered along the southern periphery of the North Atlantic High [also known as the Bermuda High]), coming ashore along the central Gulf coast. Gordon then moved north and became absorbed into the cold front which had penetrated into the southern Plains, and then propagated along the front across the Midwest to Northeast. Gordon's tropical moisture enhanced the precipitation that was already falling along the front, resulting in widespread above-normal amounts. The rain and clouds along the front and associated with Gordon kept temperatures cooler than normal from the southern Plains to Great Lakes, while the subtropical highs and upper-level ridging kept temperatures warmer than normal in the West and Southeast.
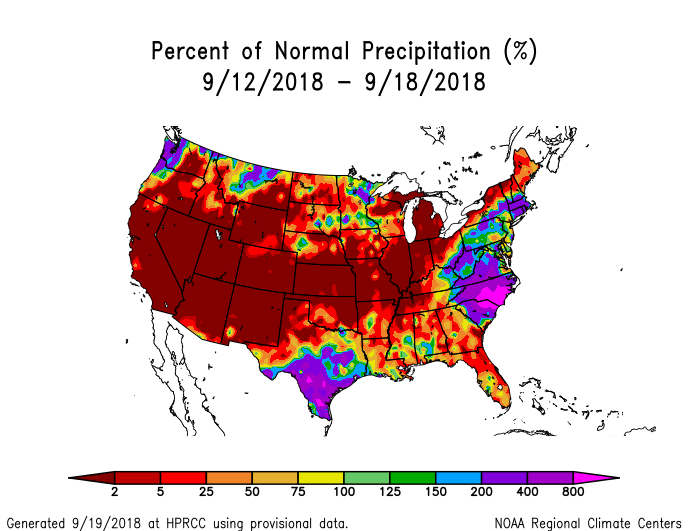
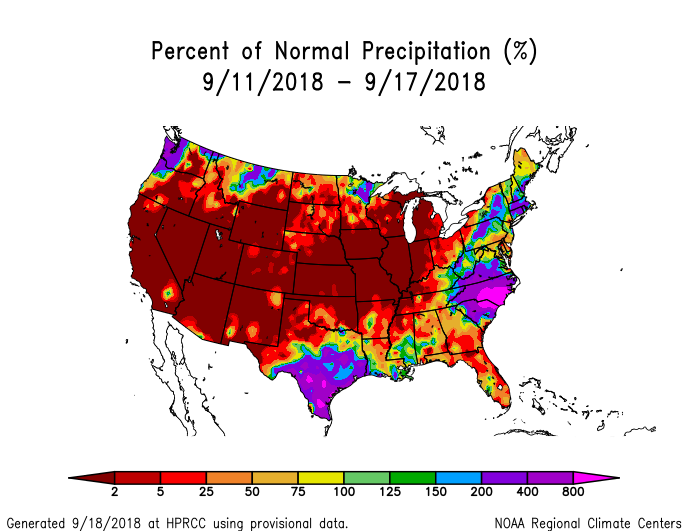
- September 12-18: Hurricane Florence was steered by the Bermuda High into the Carolina coast. It then stalled over the Carolinas beneath upper-level large-scale ridging with weak steering currents. Florence's remnants were finally ejected by a mid-latitude short-wave trough and tracked across the Appalachian chain and into the Northeast. The tropical cyclone's slow movement across the Carolinas resulted in above-normal precipitation and devastating flooding in the eastern part of the two states, and it left a trail of above-normal precipitation further along its track.
- Surface fronts or weak upper-level lows lingered over southern Texas for much of September 8-17, bringing above-normal precipitation.
- September 19-21: Moisture from Tropical Depression 19-E, which fell apart over northwest Mexico, moved across the U.S. Southwest before being swept up by the front and frontal low over Texas, adding to the rainfall in those areas.
- For September 21-30, the shift in the upper-level pattern allowed fronts to move south across the Plains and frequently reach the Gulf of Mexico and Atlantic coasts. With the Gulf and Atlantic moisture sources now open, precipitation was above-normal as the moist southerly flow encountered the frontal lifting from the western Gulf Coast up to the Northeast.
- The western U.S. mostly missed out on the storms, fronts, and convection. A few Pacific fronts crossed the West, but the region was dominated mostly by upper-level ridging or a precipitation-inhibiting northwesterly flow which kept precipitation consistently well below normal.
 500-mb mean circulation for the CONUS for September 2018.
|
 500-mb circulation anomalies for the CONUS for September 2018.
|
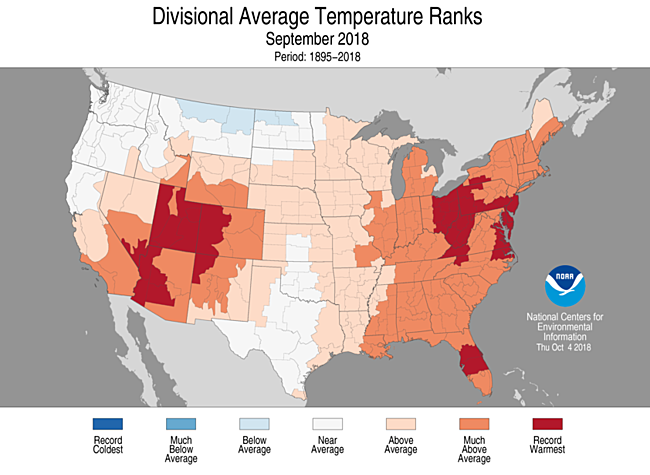
 Temperature anomalies (departure from normal) for the CONUS for September 2018.
|
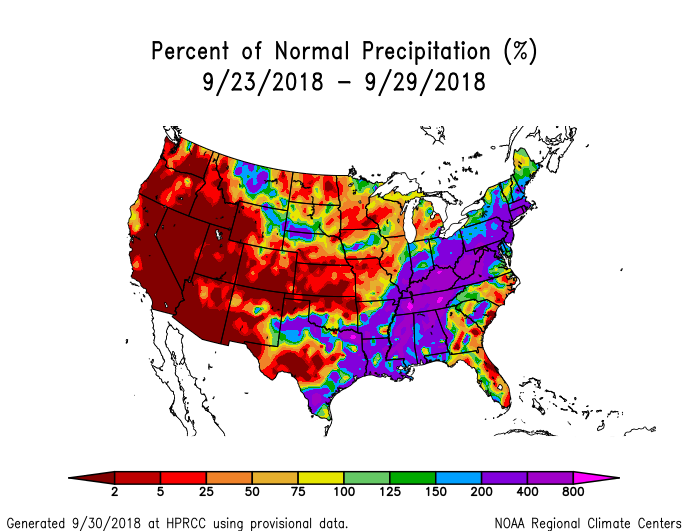
 Precipitation anomalies (percent of normal) for the CONUS for September 2018.
|
The long-wave circulation pattern averaged across the entire month integrates the sub-monthly regimes and shows a positively-tilted trough stretching from the West Coast to central Canada, with ridging and above-normal heights from the Southwest to East Coast. Monthly temperatures were warmer than normal beneath the ridges and above-normal 500-mb height anomalies in the Southwest and across most of the country from the Mississippi River to East Coast. Monthly temperatures were cooler than normal in the Northwest to northern Plains where troughing and below-normal 500-mb heights dominated. The precipitation anomaly pattern for the month (the wet areas) represented an additive result of rainfall from the individual frontal passages and low pressure systems, as well as the tropical systems. The dry areas resulted from persistence of upper-level ridging, or were areas where the fronts didn't quite reach or the frontal rains missed purely by chance. The circulation during this month was also reflected in severe weather, drought, and regional records.
- The extreme warmth contributed to record statewide temperature ranks. In addition to being the fourth warmest September in the 1895-2018 record nationally, September 2018 ranked as the warmest September on record for Arizona, Utah, Florida, Ohio, West Virginia, Maryland, and Delaware, and ranked in the top ten warmest category for 22 additional states in the West and from the Mississippi River eastwards. On a statewide basis, Texas and West Virginia had the wettest September on record with 14 additional states east of the Rockies ranking in the top ten wettest category. Four states, all in the West, ranked in the top ten driest category. Nationally, September 2018 ranked as the third wettest September in the 1895-2018 record.
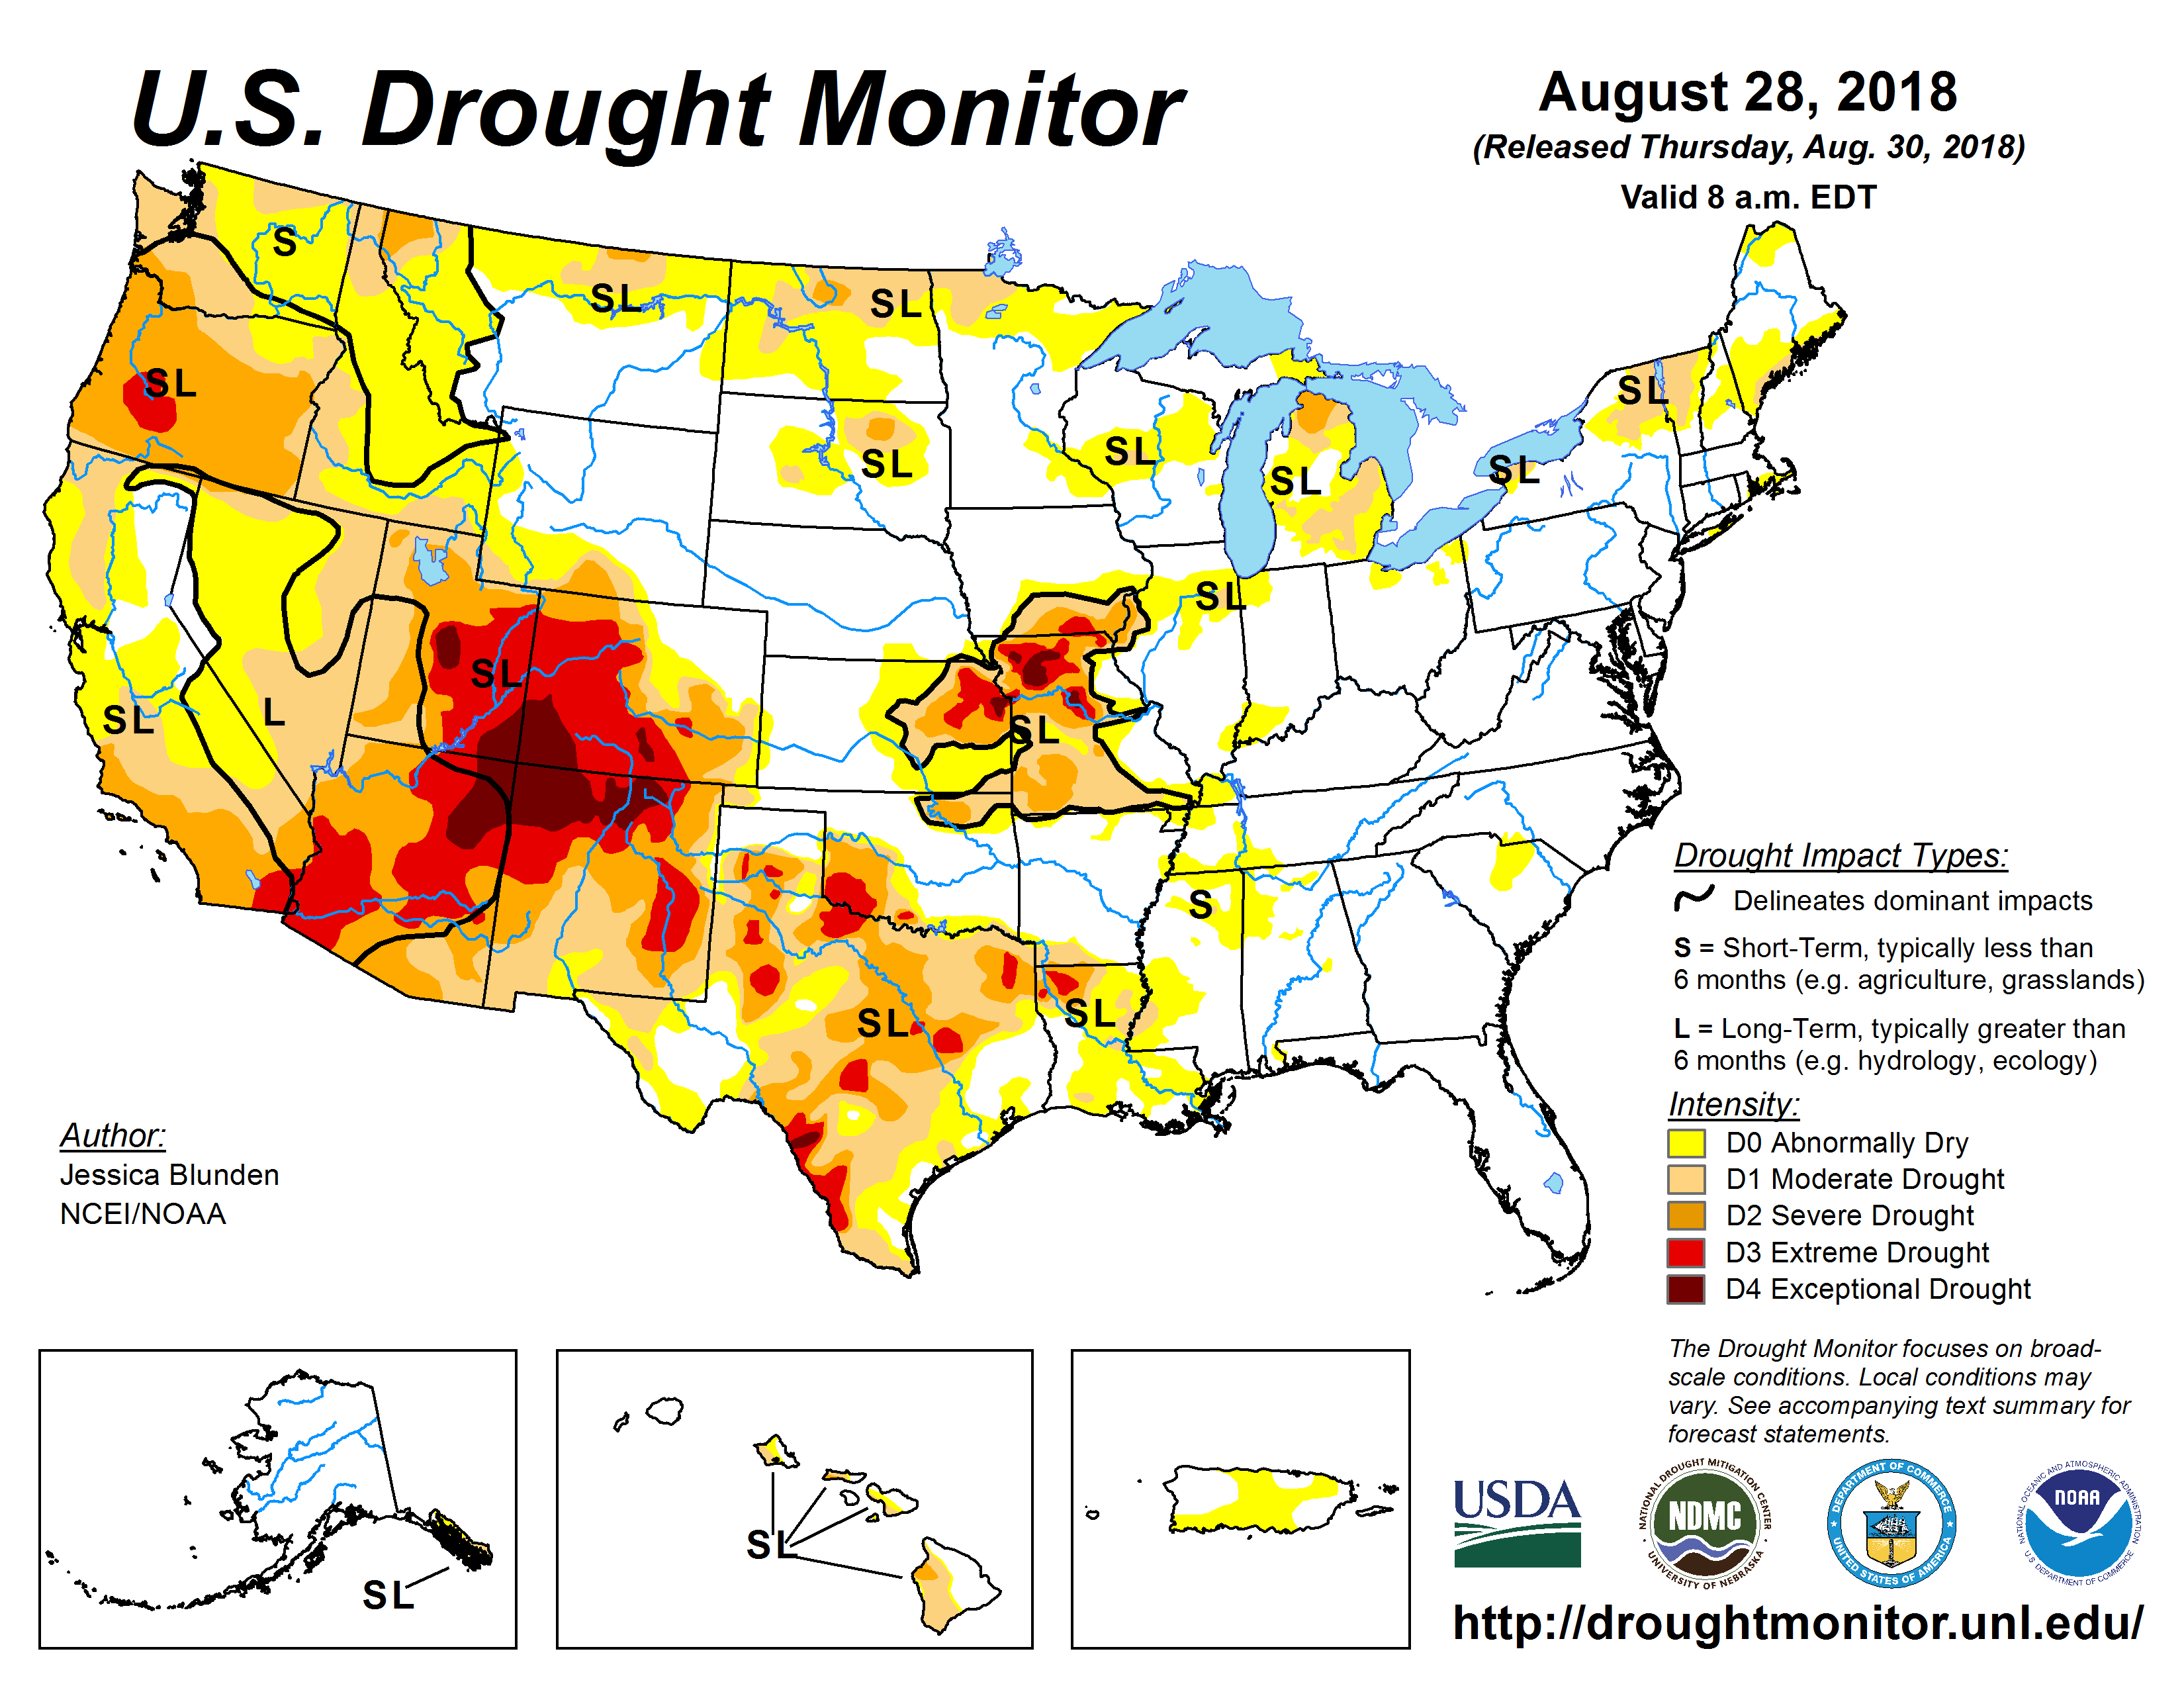
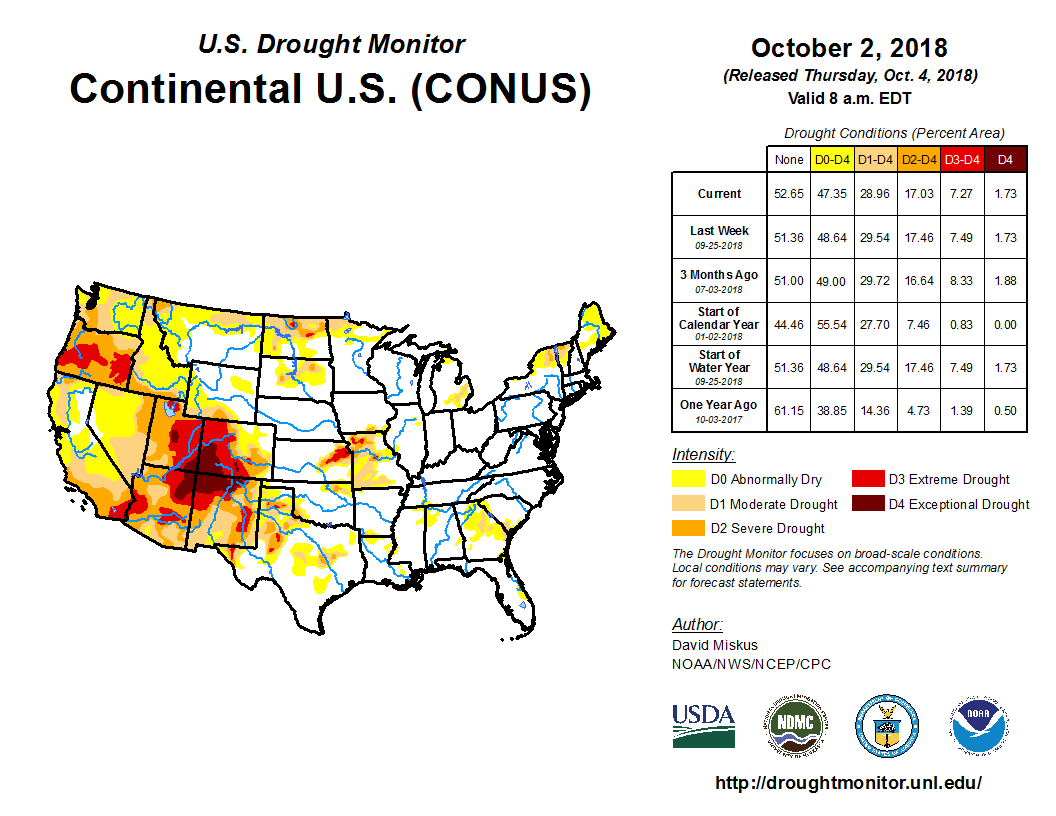
- Much of the precipitation during September fell on areas that were in drought at the end of August and contracted drought and abnormal dryness, while other drought areas continued quite dry. Drought and abnormal dryness contracted across much of Texas, parts of the central and northern Plains to Midwest, and parts of the West, Southeast, and Northeast, as well as Hawaii and Puerto Rico. Drought and abnormal dryness developed, expanded, or intensified in other parts of the West, northern Plains, Southeast, and Northeast, as well as southeast Alaska. Contraction outweighed expansion this month, so at the national level drought contracted from 34.4 percent of the CONUS at the end of August to 29.0 percent of the CONUS at the end of September (from 29.2 percent to 24.6 percent for all of the U.S.).
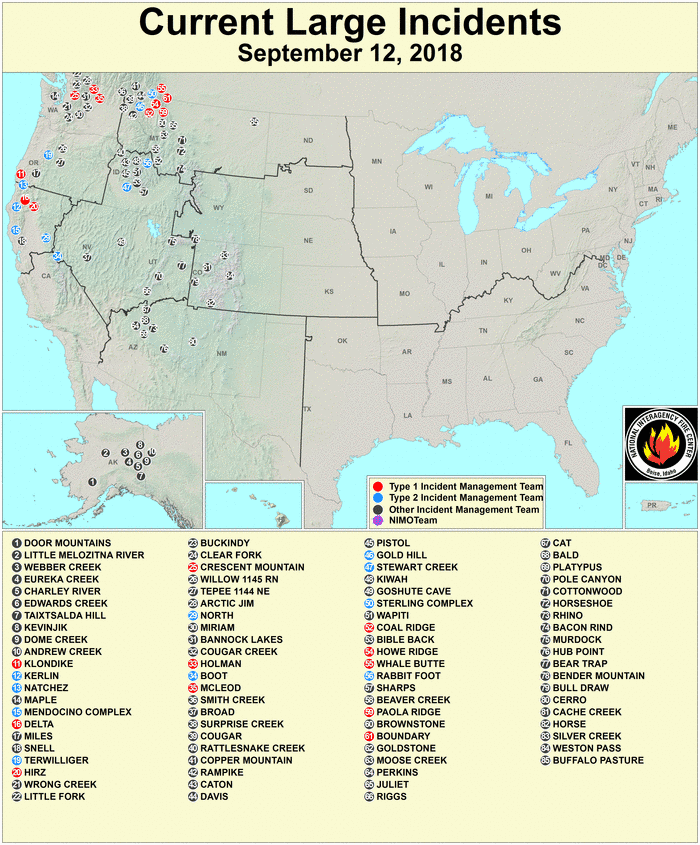
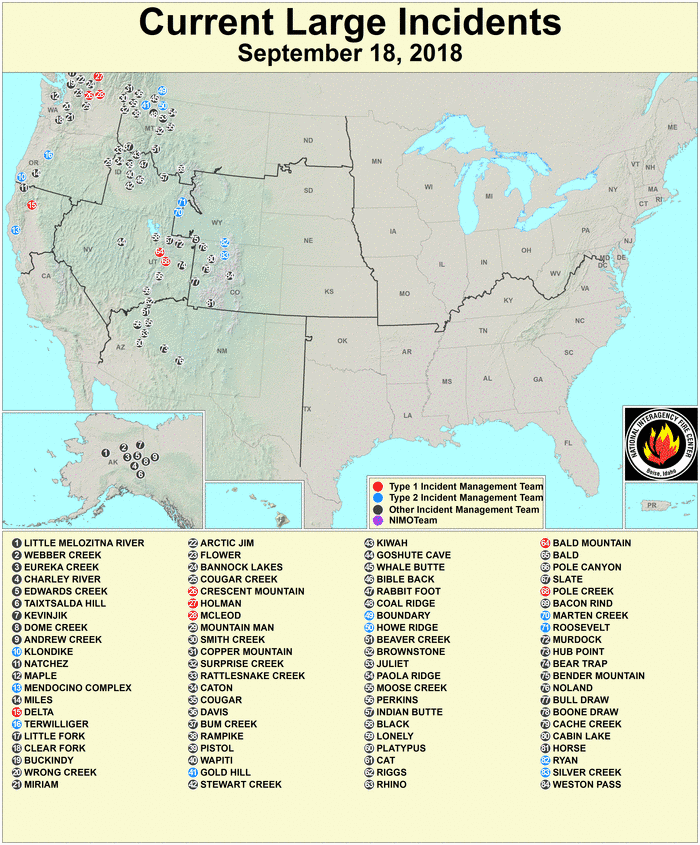
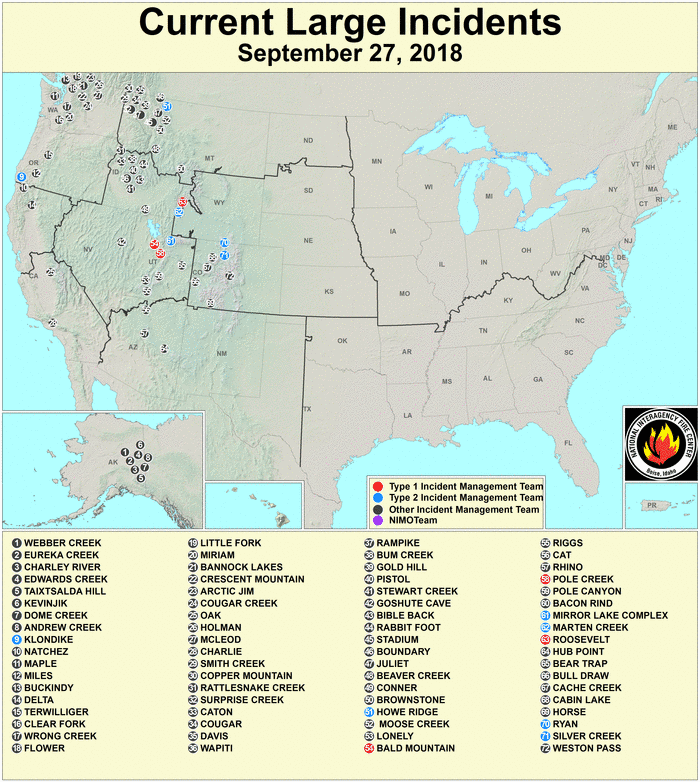
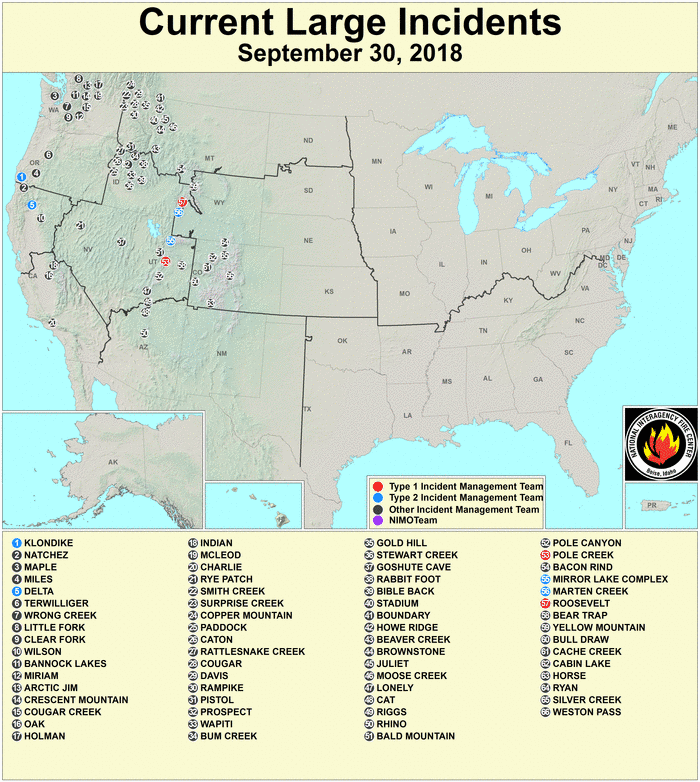
- The hot and dry weather in the West maintained conditions favorable for the continuation of wildfires (sunny skies, hot temperatures, low humidity, lack of precipitation, windy weather). The month began with nearly a hundred large wildfires burning across much of the West and parts of interior Alaska (wildfire maps for August 1, 8, 12, 18, 23, 27, 30). By the end of September, the large wildfires essentially ended in Alaska, but over 60 were still burning across the western CONUS.
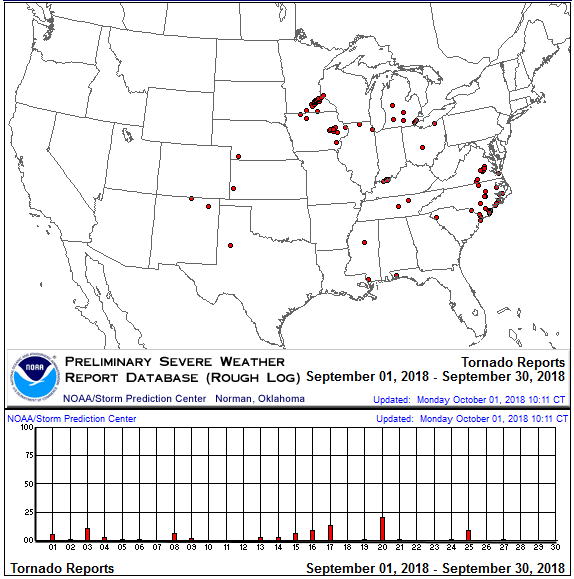
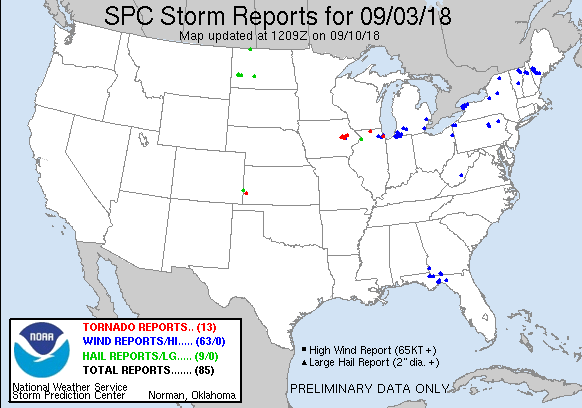
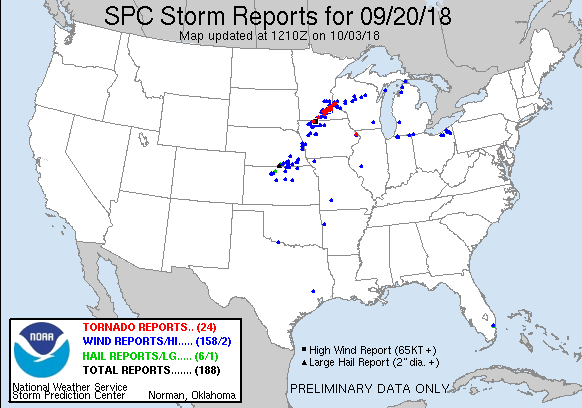
- The atmospheric circulation needed to create the instability and dynamics favorable for severe weather consists largely of a southwesterly flow across the central part of the CONUS, which funnels moist Gulf of Mexico air and its latent heat energy into the mix. Surface fronts provide additional atmospheric lifting. The changing direction of the circulation around surface lows and the upper-level troughs and lows above them adds spin to the rising air, which enhances the formation of tornadoes; these conditions are also frequent around tropical cyclones. This upper-level circulation pattern occurred frequently as the short-wave troughs and closed lows, and their associated surface fronts and lows, moved across the country, with some type of severe weather (hail, strong winds, or tornadoes) occurring almost every day. The number of tornadoes for September 2018 (97 based on preliminary data) was more than the September average of 74. Notable outbreaks of tornadoes occurred as strong frontal systems and upper-level troughs moved across the Midwest (September 3, 20, and 25) and across the Mid-Atlantic in association with Hurricane Florence (September 16 and 17).
Typically tropical cyclone activity is enhanced in the Eastern North Pacific and inhibited in the North Atlantic during El Niños, and inhibited in the Eastern North Pacific and enhanced in the North Atlantic during La Niñas, due mostly to changes in vertical wind shear during the two extreme events. The relationship is unclear during ENSO-neutral events. Warm sea surface temperatures (SSTs) fuel tropical cyclones while vertical wind shear tears them apart. The tropical Pacific Ocean was in an ENSO-neutral state during September 2018.
- The Atlantic hurricane season runs from June 1st through November 30th and the Eastern North Pacific (ENP) hurricane season runs from May 15th through November 30th.
- The North Atlantic basin was very busy this September, with eight tropical systems (Hurricanes Florence, Helene, and Isaac; Tropical Storms Gordon, Joyce, Kirk, and Leslie; and Tropical Depression 11) active during the month, plus a couple brief tropical disturbances. Tropical Storm Gordon, which formed as a disturbance near Cuba early in the month, was steered to the west across the Gulf of Mexico by the easterly winds along the southern periphery of the Bermuda High. Gordon was the first of the systems to make landfall on the CONUS, crossing at the middle Gulf coast then merging with a cold front. It left a trail of moisture from the Gulf Coast and, as part of the frontal zone, across the Midwest and Northeast. Hurricane Florence, which formed as a tropical depression off the coast of Africa at the end of August, tracked across the Atlantic in the easterly steering currents along the southern edge of the North Atlantic High (Bermuda High). By the time Florence made landfall along the Carolina coast, the subtropical high stretched from the North Atlantic, across the Southeast, to the southern Plains, which made the steering currents weak. Consequently, Florence stalled out, and the southeasterly onshore flow at its northeastern quadrant pulled in Atlantic moisture continuously, day after day, inundating the eastern Carolinas with flooding rains. After slowly meandering across the Carolinas, the system eventually was pulled north into the westerlies, dropping above-normal rainfall as it tracked across the Appalachian chain and Northeast. Hurricane Helene also formed off the coast of Africa and tracked westward for a few days before being pulled north by a mid-latitude trough which protruded into the central North Atlantic. The trough pulled Helene northward into the westerlies, where it transitioned into a strong extratropical cyclone and took aim on the islands of the United Kingdom. Hurricane Isaac formed off the coast of Africa about a week after Florence. Isaac tracked westward in the Northeast Trade Winds along the southern periphery of the North Atlantic High, eventually falling apart when it reached the Lesser Antilles in the eastern Caribbean. Tropical Storm Kirk began as a disturbance off the coast of Africa and trekked westward in the easterly Trade Winds along the southern periphery of the North Atlantic High. Kirk traveled rapidly to the west, and its warp speed likely prevented it from becoming better organized and strengthening during this time. Kirk fell apart when it encountered increasing shear associated with upper-level westerlies over the eastern Caribbean Sea. Tropical Depression 11 formed in the tropical North Atlantic east of the Lesser Antilles. It lasted only a few days before moving into a region of increasing shear and drier air which eventually dissipated it. Tropical Storm Joyce began as a subtropical storm and had the misfortune of living too close to Helene. Joyce started out on a westerly track, but the larger circulation of Hurricane Helene turned Joyce to the southwest, then a mid-latitude trough grabbed hold of Joyce, with the tropical storm eventually moving east into a region of dry and stable air, cool sea surface temperatures (SSTs), and moderate to strong westerly shear, which are factors that tear tropical systems apart. Tropical Storm Leslie also began as a subtropical storm in the central North Atlantic at mid-month. Leslie led a strange life, embedded at birth within an upper-level low with very light steering currents then circling aimlessly in the central Atlantic, pulled to and fro by various mid-latitude troughs. At one point it transitioned to a mid-latitude frontal low, then became cut-off from the mid-latitude flow, then became subtropical again, then took on the circulation features and deep-layer warm core structure of a tropical system, finally strengthening into a tropical storm near the end of September. In early October, Leslie made the big leagues when it strengthened into a hurricane. A tropical disturbance formed over the western Gulf along the Texas coast on September 3 and lasted barely a day, but brought rain to southeast Texas. Another tropical disturbance (98L) formed during the last half of the month in the western North Atlantic, but it was weak, difficult to analyze, and didn't amount to much.
- Seven tropical systems were active in the Eastern North Pacific basin during September 2018, including Hurricanes Miriam, Norman, Olivia, and Rosa; Tropical Storms Paul and Sergio; and Tropical Depression 19-E. Hurricanes Miriam and Norman formed in late August and moved west under the easterly steering currents along the southern periphery of the North Pacific High. Strong mid- to upper-level trough in the westerlies weakened the High and pulled both hurricanes north, although about a week apart and in slightly different locations. Strong vertical wind shear associated with the troughs tore Miriam and Norman apart well northeast of Hawaii. An area of convection (Invest 91E) was noticed at the end of August. This disturbance became a Tropical Depression (17E) on September 1, then eventually evolved into Hurricane Olivia. Like most tropical systems in this part of the world, Olivia moved west in the easterly steering currents along the southern edge of the North Pacific High, but this system took aim at Hawaii. Fortunately, strong vertical wind shear weakened Olivia to tropical storm strength by the time it crossed Hawaii, so tropical rains were the major concern. Olivia eventually met its end due to strong wind shear further west of Hawaii. Tropical Storm Paul was steered northwest by a subtropical ridge to parallel the Mexican coast, before being pushed to the west into a drier air mass over a cooler ocean. Paul lost its cyclonic characteristics over this destructive environment, eventually degenerating into a surface trough east of Hawaii. Short-lived Tropical Depression 19-E formed mid-month in the Gulf of California between northwestern Mexico and Baja California. An upper-level trough moving into the western CONUS steered the depression into northwest Mexico, where it quickly dissipated, but its remnants dumped heavy rain across northwestern Mexico and into the U.S. Southwest and southern Plains. Hurricane Rosa began like Miriam and Norman, moving in a westerly to northwesterly track off the coast of southern Mexico, steered by the North Pacific High's easterly trade winds. But, like 19-E, Rosa was pulled north then northeast by an upper-level trough moving into the western CONUS. At the end of September, Rosa was bearing down on Baja California, and in early October its remnants would bring heavy rain to northwest Mexico and the U.S. Southwest. Tropical Storm Sergio formed at the end of September just south of southern Mexico and was steered west by the easterly trades along the southern periphery of the North Pacific High. In early October, Sergio strengthened to hurricane status and was continuing on a westerly to west-northwesterly track.
- Five tropical systems were active in the Central North Pacific basin during September. Three were hurricanes (Miriam, Norman, and Olivia) which entered the basin from the East Pacific and were discussed previously. A fourth, Hurricane Walaka, developed near the end of the month well south of Hawaii and tracked west along the southern periphery of the North Pacific High. The region it was moving through had ideal conditions for strengthening — high SSTs, low shear, high ocean heat content and plenty of deep moisture — so Walaka reached hurricane status just as the month ended, in early October. The fifth was a tropical disturbance (96C) which formed in the mid-latitudes of the central North Pacific; it appeared to have originated as an upper-level closed low, but was classified as a tropical disturbance. Tropical Disturbance 96C was short-lived, lasting only a couple days at the beginning of the month.
- Like previous months, there was a lot of tropical activity in the western tropical Pacific during September, with seven tropical cyclones (Typhoons Jebi, Mangkhut, Trami, Kong-Rey, and Olivia; Tropical Storm Barijat; and Tropical Depression 29W) and two tropical disturbances (91W and 97W). Many of these originated as disturbances within the waters of the U.S.-Affiliated Pacific Islands (USAPI) (Micronesia), then strengthened into typhoons as they crossed into the more favorable environment over the Philippine Sea. Jebi, which had its origins in late August, was a super typhoon at the beginning of September, moving northwest along the eastern periphery of the North Pacific High. After crossing Japan as a category 1 typhoon, Jebi became entrained in a mid-latitude trough and added its energy and moisture to the mid-latitude westerly circulation. Super Typhoon Mangkhut formed as a depression in eastern USAPI waters near the Marshall Islands. The easterly trade winds south of the North Pacific High steered it westward in northern USAPI waters. Mangkhut crossed the Marianas as a typhoon, eventually traversing the northern Philippines and dissipating over southern China. Super Typhoon Trami formed in mid-month as a depression in USAPI waters, and achieved tropical storm status just west of the Marianas. Trami was steered northwest then north along the western periphery of the North Pacific High, eventually strengthening into a super typhoon. It weakened as it continued north, crossing Japan, then came under the influence of the mid-latitude westerlies where it was transformed into an extratropical cyclone and added its energy to the westerly circulation. Tropical Depression 29W formed well north of the USAPI. It stayed out to sea and, like Trami, 29W was steered north along the western periphery of the North Pacific High, eventually being picked up by the westerlies and being transformed into an extratropical system. Typhoon Kong-Rey developed as a large but weak circulation in eastern Micronesian waters near the end of the month. It tracked west-northwest across the USAPI, passing near the Marianas as a tropical storm. Kong-Rey strengthened to a typhoon over the Philippine Sea and was headed northwest toward the East China Sea in early October. Hurricane Olivia briefly passed into Western North Pacific waters (when it became designated as a typhoon) from the Central North Pacific before meeting its end (see Central North Pacific discussion). Tropical Disturbance 97W formed in USAPI waters east of Guam at the beginning of September, and Tropical Disturbance 91W formed in eastern USAPI waters in mid-September, but both remained weak and dissipated after a couple days. Tropical Storm Barijat formed near the Philippines and moved west, never threatening the USAPI.
 North America monthly upper-level circulation pattern and anomalies. The upper-level circulation pattern during September, when averaged for the month, consisted of high pressure with above-normal 500-mb heights across the eastern CONUS stretching to the southern Plains and Southwest. A 500-mb trough with below-normal 500-mb height anomalies stretched from the Pacific Northwest to the northern Plains and into central Canada. A ridge with above-normal heights was anchored over Alaska. |
|
Map of monthly precipitation anomalies. Monthly precipitation was drier than normal across most of the West, across Georgia and Florida, and a few areas in the Plains to Mid-Mississippi Valley, as well as western and southern Alaska, parts of Hawaii's Big Island, and parts of southern and eastern Puerto Rico. September was wetter than normal across much of the Plains to East Coast, most of Hawaii, northeast Alaska, and parts of western and northern Puerto Rico. |
|
Map of monthly temperature anomalies. Monthly temperatures were warmer than normal across the Southwest, central Plains, and all of the CONUS east of the Mississippi, as well as most of Alaska. September temperatures were near to cooler than normal across the Pacific Northwest and parts of the northern Plains, northern half of California, and parts of Texas. |