Temperature
Coinciding with the release of the January 2023 Global Climate Report, the NOAA Global Surface Temperature (NOAAGlobalTemp) dataset version 5.1.0 replaced version 5.0.0. This new version includes complete global coverage and an extension of the data record back in time an additional 30 years to January 1850. While anomalies and ranks might differ slightly from what was reported previously, the main conclusions regarding global climate change are very similar to the previous version. Please see our Commonly Asked Questions Document and web story for additional information.
NOAA's National Centers for Environmental Information calculates the global temperature anomaly every month based on preliminary data generated from authoritative datasets of temperature observations from around the globe. The major dataset, NOAAGlobalTemp version 5.1.0, updated in 2023, uses comprehensive data collections of increased global area coverage over both land and ocean surfaces. NOAAGlobalTempv5.1.0 is a reconstructed dataset, meaning that the entire period of record is recalculated each month with new data. Based on those new calculations, the new historical data can bring about updates to previously reported values. These factors, together, mean that calculations from the past may be superseded by the most recent data and can affect the numbers reported in the monthly climate reports. The most current reconstruction analysis is always considered the most representative and precise of the climate system, and it is publicly available through Climate at a Glance.
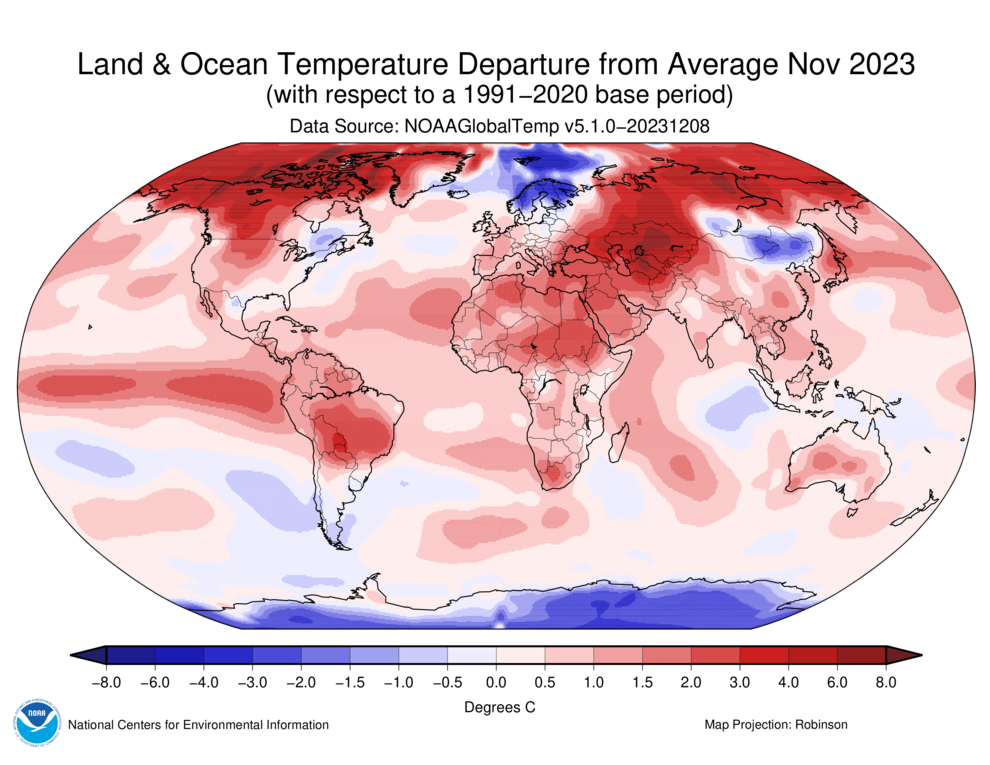
November 2023
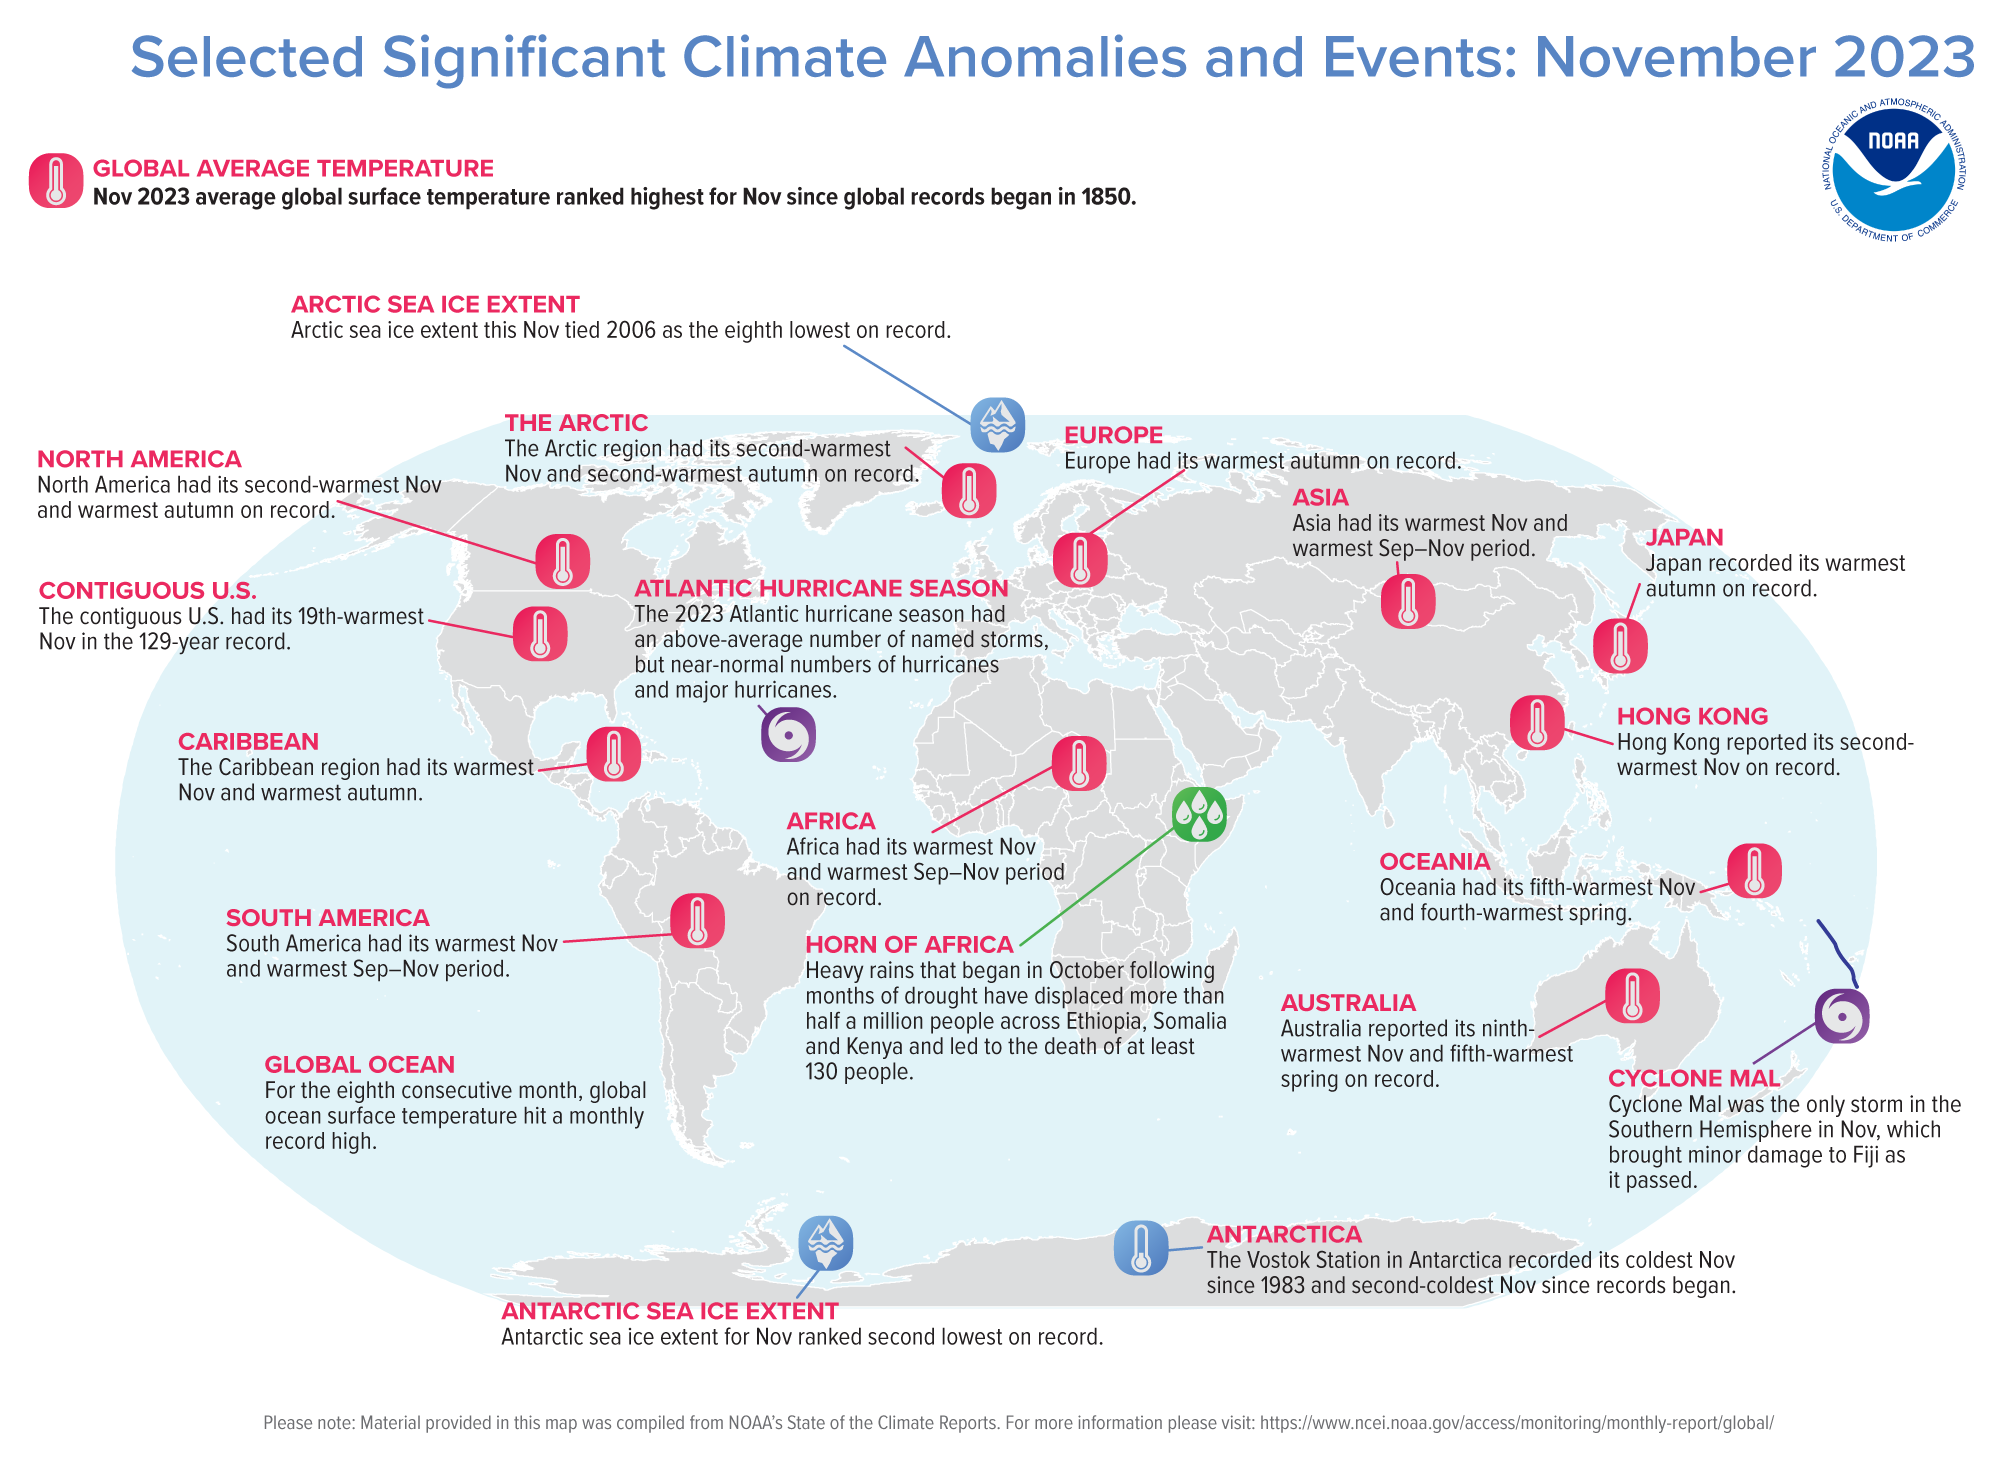
The November global surface temperature was 1.44°C (2.59°F) above the 20th-century average of 12.9°C (55.2°F), making it the warmest November on record. This was 0.38°C (0.68°F) above the previous record from November 2015. November 2023 marked the 47th-consecutive November and the 537th-consecutive month with temperatures at least nominally above the 20th-century average.
November saw a record-high monthly global ocean surface temperature for the eighth consecutive month. El Niño conditions that emerged in June continued into November, and according to NOAA's Climate Prediction Center there is a 60% chance that El Niño will continue through April–June 2024.
The Northern Hemisphere had its warmest November on record at 2.07°C (3.73°F) above average. Both land and ocean temperatures were at record-highs for the Northern Hemisphere this November. The Arctic region had its second-warmest November on record.
November 2023 in the Southern Hemisphere also ranked warmest on record at 0.81°C (1.46°F) above average. While the average ocean-only temperature for November in the Southern Hemisphere ranked highest on record this November, the land-only temperature tied 2016 for the eighth highest on record. Meanwhile, the Antarctic region tied 1959 for its sixth-coolest November.
A smoothed map of blended land and sea surface temperature anomalies is also available.
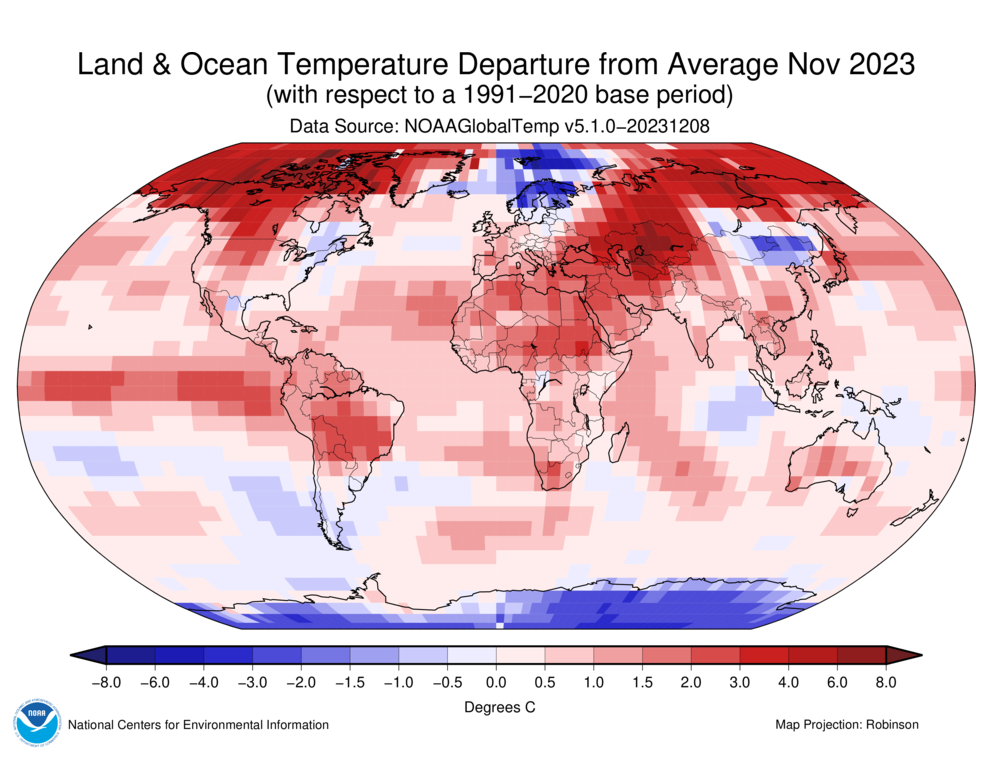
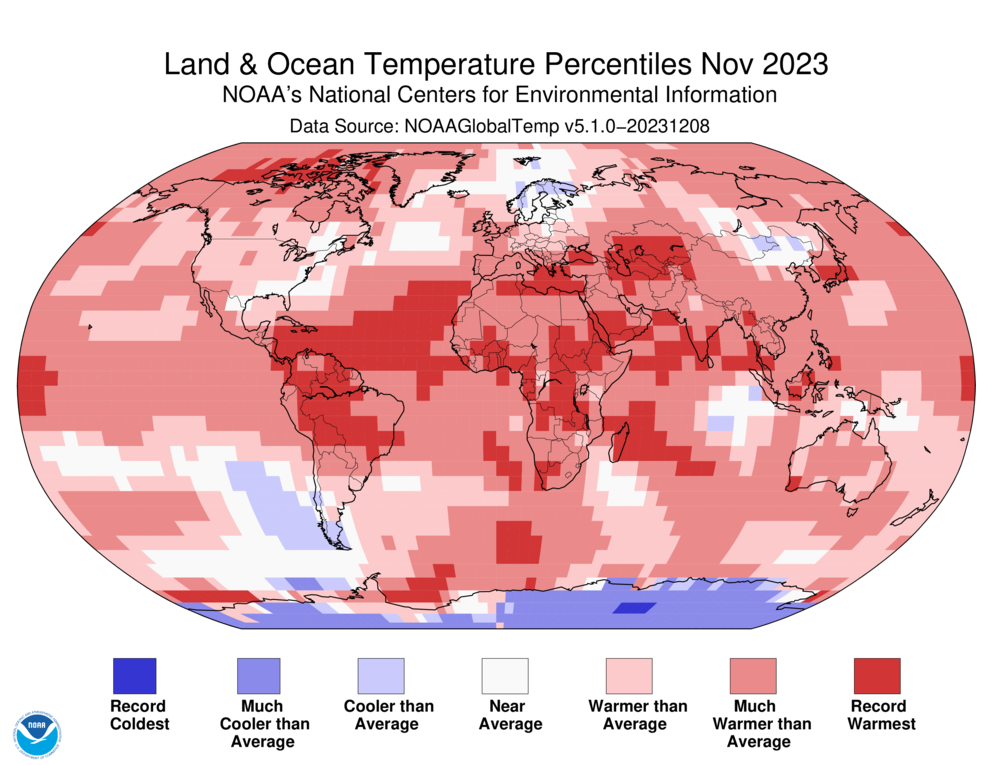
Temperatures were above average throughout most of South America, northern, western, and central North America, Africa, western and southern Europe, western, central, and southern Asia, Oceania, and the Arctic. Parts of northern North America, northern and central South America, Africa, and eastern and southern Asia experienced record-warm temperatures this month. Sea surface temperatures were above average across much of the northern and western Pacific as well as the central and southern Atlantic and the western Indian Oceans. Record-warm temperatures covered nearly 13% of the world's surface this November, which was the highest percentage for November since the start of records in 1951.
Temperatures were near to cooler than average across much of Antarctica as well as across parts of eastern North America, northern Europe, southern South America, and central-eastern Asia. Sea surface temperatures were near to below average over parts of the southeastern Pacific Ocean, the eastern Indian Ocean, and the northern Atlantic Ocean. Less than 1% of the world's surface had a record-cold November.
South America, Africa, and Asia each had their warmest November on record.
- November in Brazil was warm, with twelve consecutive days of above-average temperatures and a record-high 44.8°C (112.6°F) reached on November 19 in the municipality of Araçuaí.
- Hong Kong had its second-warmest November on record.
- November in Pakistan ranked eighth warmest on record.
November 2023 ranked second warmest on record for North America and fifth warmest for Oceania.
- The contiguous U.S. had its 19th-warmest November in the 129-year record.
- The Caribbean Islands region had its warmest November on record.
- November in Cuba ranked third warmest since records began in 1951.
- New Zealand had a November temperature that was 0.4°C above its 1991–2020 average, ranking as the 34th-warmest November since records began in 1909.
- November in Australia ranked ninth-warmest on record.
Europe tied 2003 for its 15th-warmest November on record.
- Italy recorded its eighth-warmest November on record.
- The United Kingdom reported a near-average temperature for November, just 0.1°C below average.
- Norway had its coldest November since 2010.
- November in Estonia was 0.7°C below the long-term average.
- Latvia recorded a November temperature that was 0.5°C below the monthly norm.
| November | Anomaly | Rank (out of 174 years) | Records | ||||
|---|---|---|---|---|---|---|---|
| °C | °F | Year(s) | °C | °F | |||
| Global | |||||||
| Land | +2.42 | +4.36 | Warmest | 1st | 2023 | +2.42 | +4.36 |
| Coolest | 174th | 1875 | -1.15 | -2.07 | |||
| Ocean | +1.00 | +1.80 | Warmest | 1st | 2023 | +1.00 | +1.80 |
| Coolest | 174th | 1909 | -0.48 | -0.86 | |||
| Land and Ocean | +1.44 | +2.59 | Warmest | 1st | 2023 | +1.44 | +2.59 |
| Coolest | 174th | 1908 | -0.54 | -0.97 | |||
| Northern Hemisphere | |||||||
| Land | +3.04 | +5.47 | Warmest | 1st | 2023 | +3.04 | +5.47 |
| Coolest | 174th | 1875 | -1.48 | -2.66 | |||
| Ocean | +1.34 | +2.41 | Warmest | 1st | 2023 | +1.34 | +2.41 |
| Coolest | 174th | 1909, 1912 | -0.53 | -0.95 | |||
| Land and Ocean | +2.07 | +3.73 | Warmest | 1st | 2023 | +2.07 | +3.73 |
| Coolest | 174th | 1856 | -0.76 | -1.37 | |||
| Southern Hemisphere | |||||||
| Land | +1.02 | +1.84 | Warmest | 8th | 2009 | +1.56 | +2.81 |
| Coolest | 167th | 1917 | -0.66 | -1.19 | |||
| Ties: 2016 | |||||||
| Ocean | +0.76 | +1.37 | Warmest | 1st | 2023 | +0.76 | +1.37 |
| Coolest | 174th | 1909 | -0.45 | -0.81 | |||
| Land and Ocean | +0.81 | +1.46 | Warmest | 1st | 2023 | +0.81 | +1.46 |
| Coolest | 174th | 1924 | -0.43 | -0.77 | |||
| Antarctic | |||||||
| Land and Ocean | -0.33 | -0.59 | Warmest | 169th | 1997 | +1.13 | +2.03 |
| Coolest | 6th | 2022 | -0.83 | -1.49 | |||
| Ties: 1959 | |||||||
| Arctic | |||||||
| Land and Ocean | +4.50 | +8.10 | Warmest | 2nd | 2020 | +4.91 | +8.84 |
| Coolest | 173rd | 1968 | -2.74 | -4.93 | |||
500 mb maps
In the atmosphere, 500-millibar height pressure anomalies correlate well with temperatures at the Earth's surface. The average position of the upper-level ridges of high pressure and troughs of low pressure—depicted by positive and negative 500-millibar height anomalies on the map—is generally reflected by areas of positive and negative temperature anomalies at the surface, respectively.

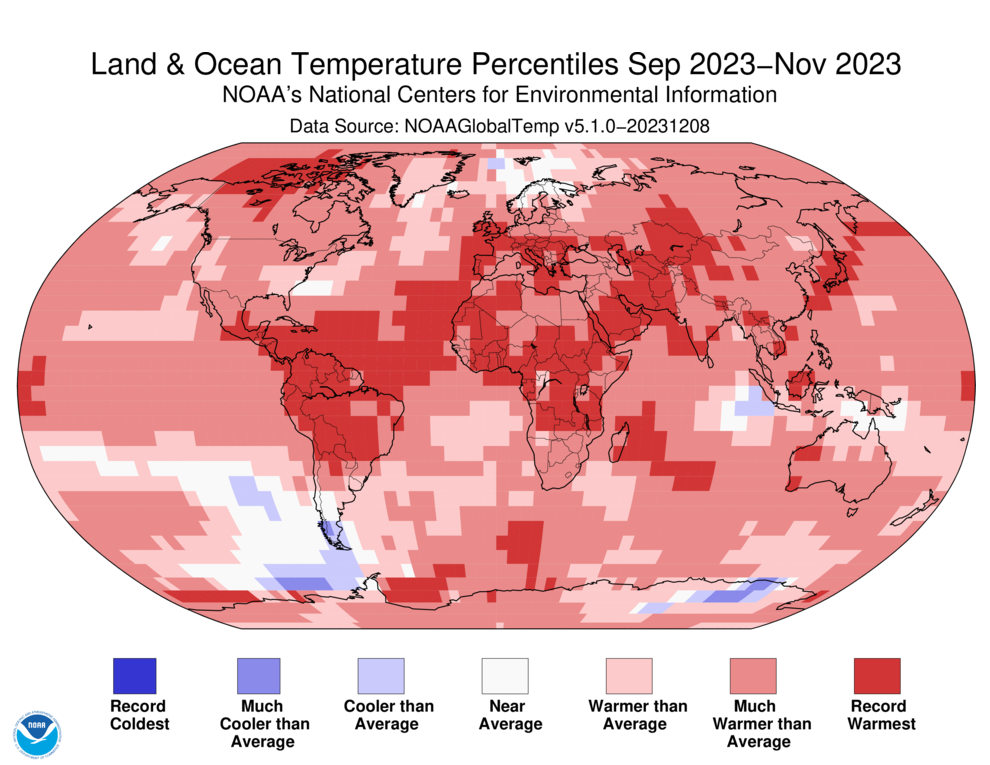
Seasonal Temperature: September–November 2023
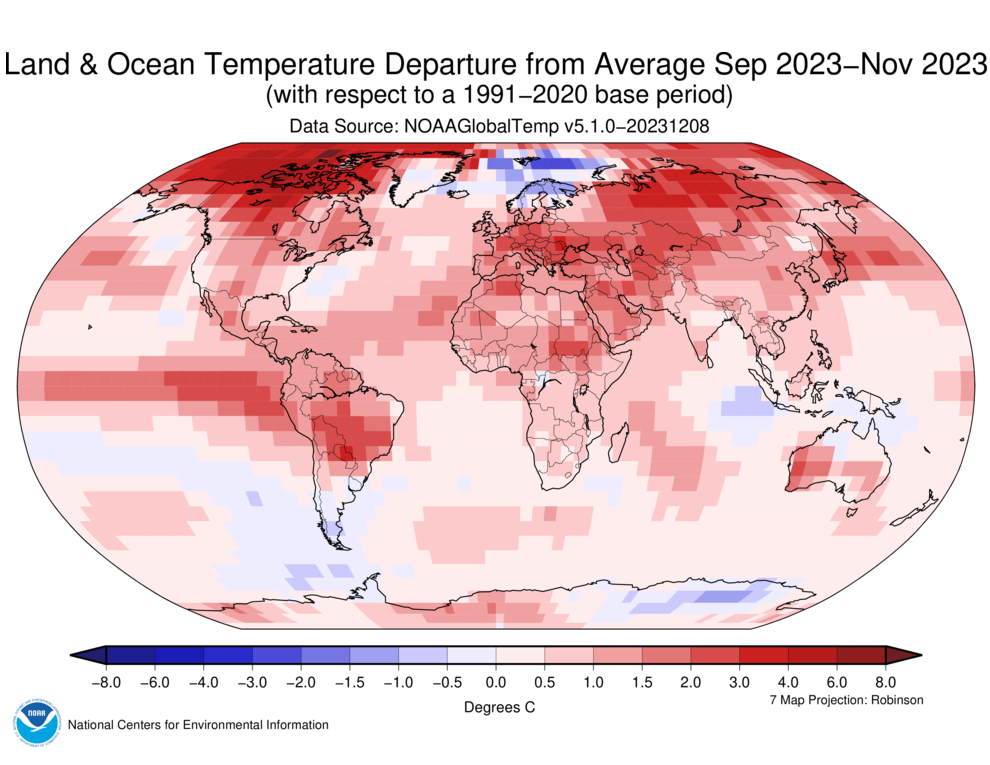
The September–November 2023 global surface temperature was 1.41°C (2.54°F) above the 20th-century average of 14.0°C (57.1°F). This ranks as the warmest September–November period in the 174-year record, and a substantial leap (+0.39°C or +0.70°F) above the previous record from 2015. The past ten September–November periods have been the ten warmest such periods on record. The September–November 2023 global surface temperature departure from average also marks the largest positive seasonal temperature anomaly on record.
The September–November period is defined as the Northern Hemisphere's meteorological autumn and the Southern Hemisphere's meteorological spring. The Northern Hemisphere autumn 2023 temperature ranked warmest on record at 1.91°C or 3.44°F above average. Spring in the Southern Hemisphere ranked warmest on record at 0.92°C or 1.66°F above average.
North America and Europe had their warmest autumns on record, and South America, Africa and Asia also had their warmest September–November periods on record. The spring season in Oceania ranked fourth warmest on record. The Arctic experienced its second-warmest autumn and the Antarctic region had its 12th-warmest spring on record.
A smoothed map of blended land and sea surface temperature anomalies is also available.
Over the land surface, air temperatures for the season were above average across much of North America, northern and central South America, Europe, Asia, Africa, and Oceania. Every continent experienced some area of record-warm temperatures this September–November season. Temperatures were below or near average across parts of southern South America, Scandinavia, and Antarctica.
Sea surface temperatures for the season were above average across much of the northern and western Pacific, parts of the tropical eastern and southern Pacific, and most of the Atlantic and western Indian Oceans. Sea surface temperatures were near or below average across parts of the southeastern Pacific and the eastern Indian Oceans.
| September–November | Anomaly | Rank (out of 174 years) | Records | ||||
|---|---|---|---|---|---|---|---|
| °C | °F | Year(s) | °C | °F | |||
| Global | |||||||
| Land | +2.29 | +4.12 | Warmest | 1st | 2023 | +2.29 | +4.12 |
| Coolest | 174th | 1875, 1884 | -0.76 | -1.37 | |||
| Ocean | +1.02 | +1.84 | Warmest | 1st | 2023 | +1.02 | +1.84 |
| Coolest | 174th | 1908, 1909 | -0.43 | -0.77 | |||
| Land and Ocean | +1.41 | +2.54 | Warmest | 1st | 2023 | +1.41 | +2.54 |
| Coolest | 174th | 1912 | -0.48 | -0.86 | |||
| Northern Hemisphere | |||||||
| Land | +2.60 | +4.68 | Warmest | 1st | 2023 | +2.60 | +4.68 |
| Coolest | 174th | 1884 | -0.99 | -1.78 | |||
| Ocean | +1.38 | +2.48 | Warmest | 1st | 2023 | +1.38 | +2.48 |
| Coolest | 174th | 1912 | -0.52 | -0.94 | |||
| Land and Ocean | +1.91 | +3.44 | Warmest | 1st | 2023 | +1.91 | +3.44 |
| Coolest | 174th | 1912 | -0.71 | -1.28 | |||
| Southern Hemisphere | |||||||
| Land | +1.59 | +2.86 | Warmest | 1st | 2023 | +1.59 | +2.86 |
| Coolest | 174th | 1986 | -0.57 | -1.03 | |||
| Ocean | +0.76 | +1.37 | Warmest | 1st | 2023 | +0.76 | +1.37 |
| Coolest | 174th | 1909 | -0.40 | -0.72 | |||
| Land and Ocean | +0.92 | +1.66 | Warmest | 1st | 2023 | +0.92 | +1.66 |
| Coolest | 174th | 1924 | -0.40 | -0.72 | |||
| Antarctic | |||||||
| Land and Ocean | +0.49 | +0.88 | Warmest | 12th | 1988 | +0.95 | +1.71 |
| Coolest | 163rd | 1986 | -0.92 | -1.66 | |||
| Arctic | |||||||
| Land and Ocean | +3.40 | +6.12 | Warmest | 2nd | 2020 | +3.51 | +6.32 |
| Coolest | 173rd | 1885 | -1.35 | -2.43 | |||
Select national information is highlighted below. Please note that different countries report anomalies with respect to different base periods. The information provided here is based directly upon these data:
- Italy recorded its warmest autumn on record.
- Autumn in Germany ranked second warmest on record.
- The Netherlands had its second-warmest autumn since records began.
- Autumn in Japan ranked warmest on record.
- According to the Hong Kong Observatory, autumn in Hong Kong ranked second warmest on record.
- The contiguous U.S. had its sixth-warmest autumn on record.
- The United Kingdom had its sixth-warmest autumn since records began in 1884.
- Australia recorded its fifth-warmest spring since records began in 1910.
- Spring 2023 in New Zealand ranked 10th warmest on record at 0.7°C above average.
Year-to-date Temperature: January–November 2023
The January–November global surface temperature ranked highest in the 174-year record at 1.15°C (2.07°F) above the 1901–2000 average of 14.0°C (57.2°F). This surpassed the previous record from January–November 2016 by 0.11°C (0.20°F). According to NCEI's statistical analysis and data through November, there is a greater than 99% chance that 2023 will rank as the warmest year on record.
January–November in the Northern Hemisphere ranked warmest on record at 1.50°C (2.70°F) above average. Both the ocean-only and land-only temperatures also ranked highest on record for the Northern Hemisphere year-to-date period. January–November in the Southern Hemisphere also ranked warmest on record at 0.81°C (1.46°F) above average. The ocean-only temperature ranked record-high while average land-only temperature ranked third highest on record for the Southern Hemisphere.
South America, Africa, and Europe had their warmest year-to-date periods, while it was the second-warmest such period on record for Asia and North America. January–November 2023 ranked 11th warmest on record for Oceania.


A smoothed map of blended land and sea surface temperature anomalies is also available.
January to November was characterized by warmer-than-average conditions across much of eastern, southern, and northern North America, South America, Europe, Africa, the Arctic, Oceania, and Asia. Sea surface temperatures were above-average throughout most of the northern, western, and subtropical eastern Pacific Ocean, as well as the Atlantic and Indian Oceans.
Temperatures were near or below average across parts of western North America, Greenland, southern South America, and Antarctica. Sea surface temperatures were near to below average across parts of the southeastern Pacific Ocean.
| January–November | Anomaly | Rank (out of 174 years) | Records | ||||
|---|---|---|---|---|---|---|---|
| °C | °F | Year(s) | °C | °F | |||
| Global | |||||||
| Land | +1.73 | +3.11 | Warmest | 1st | 2023 | +1.73 | +3.11 |
| Coolest | 174th | 1884 | -0.73 | -1.31 | |||
| Ocean | +0.89 | +1.60 | Warmest | 1st | 2023 | +0.89 | +1.60 |
| Coolest | 174th | 1904 | -0.44 | -0.79 | |||
| Land and Ocean | +1.15 | +2.07 | Warmest | 1st | 2023 | +1.15 | +2.07 |
| Coolest | 174th | 1904, 1909, 1911 | -0.44 | -0.79 | |||
| Northern Hemisphere | |||||||
| Land | +2.03 | +3.65 | Warmest | 1st | 2023 | +2.03 | +3.65 |
| Coolest | 174th | 1884 | -0.90 | -1.62 | |||
| Ocean | +1.10 | +1.98 | Warmest | 1st | 2023 | +1.10 | +1.98 |
| Coolest | 174th | 1904 | -0.51 | -0.92 | |||
| Land and Ocean | +1.50 | +2.70 | Warmest | 1st | 2023 | +1.50 | +2.70 |
| Coolest | 174th | 1917 | -0.53 | -0.95 | |||
| Southern Hemisphere | |||||||
| Land | +1.05 | +1.89 | Warmest | 3rd | 2019 | +1.11 | +2.00 |
| Coolest | 172nd | 1917 | -0.66 | -1.19 | |||
| Ocean | +0.75 | +1.35 | Warmest | 1st | 2023 | +0.75 | +1.35 |
| Coolest | 174th | 1911 | -0.41 | -0.74 | |||
| Land and Ocean | +0.81 | +1.46 | Warmest | 1st | 2023 | +0.81 | +1.46 |
| Coolest | 174th | 1911 | -0.40 | -0.72 | |||
| Antarctic | |||||||
| Land and Ocean | +0.13 | +0.23 | Warmest | 42nd | 2007 | +0.69 | +1.24 |
| Coolest | 133rd | 1962 | -0.56 | -1.01 | |||
| Arctic | |||||||
| Land and Ocean | +2.44 | +4.39 | Warmest | 4th | 2016 | +3.04 | +5.47 |
| Coolest | 171st | 1966 | -1.19 | -2.14 | |||
Precipitation
The maps shown below represent land-only precipitation anomalies (left, using a base period of 1961–1990) and land-only percent of normal precipitation (right, using the period of record) based on the GHCN dataset of land surface stations.
November 2023


Above-average November precipitation was observed across parts of Europe, western Canada, southeastern South America, eastern Africa, southern India, and northern and eastern Asia. Meanwhile, drier-than-average conditions were present across much of the U.S. as well as across parts of Africa, Japan, and western Australia.
Global Precipitation Climatology Project (GPCP)
The following analysis is based upon the Global Precipitation Climatology Project (GPCP) Interim Climate Data Record. It is provided courtesy of the GPCP Principal Investigator team at the University of Maryland.
November Highlights:
- About six months into the current El Niño, the tropical rainfall patterns have mainly followed suit with floods and landslides in east Africa and parts of South America, along with continuing drought over the Amazon in South America.
- Again, the warmest November has the global wettest precipitation estimate and a very intense rainfall band across the planetary Intertropical Convergence Zone region.
- Europe saw a second month with above average precipitation to further relieve earlier drought conditions.
- The southern U.S. still remained mostly dry, even though El Niño conditions are usually associated with mostly positive precipitation anomalies

As the Northern Hemisphere fall season neared an end in November, the Asian monsoon rainfall field settled southward over the Indian Ocean and the Maritime Continent (see Fig. 1, top panel) along with other tropical rainfall features such as the ocean Intertropical Convergence Zone (ITCZ) feature and rain over Africa. The mid-latitudes also showed the typical southwest to northeast oriented features across Europe and the northern portions of the Pacific and Atlantic Oceans. In the southern middle latitude oceans, wet and dry features are oriented northwest to southeast, with a narrow ring of higher precipitation circling the globe at 60°S.
The maps of deviation from November climatology (Fig. 1, middle and bottom panels) show intense positive and negative anomalies across the tropics and broader areas of wetter and drier than normal across the middle latitudes of both hemispheres. The wet and dry features across the tropics are closely related to the continuing and intensifying El Niño (Niño 3.4 Index now up to ~ +2.0). Figure 2 shows the El Niño composite for the month of November (from previous Novembers with El Niño present) and a repeat of this November's anomaly field for easy comparison. There are many overlapping areas with the same sign of deviation in the two panels. In fact, this month's correlation of the anomaly patterns over the 40°N–40°S region is +0.47, the highest correlation so far in this El Niño run from early in 2023. This indicates the strengthening of the El Niño influence on precipitation, at least in the tropics.
In the tropical Pacific, along the equator the ITCZ shows very intense positive rainfall anomalies for this November, with a narrow east-west negative band just to the north, very similar to the El Niño composite. To the west, a dry area over New Guinea and Java and westward across much of the Indian Ocean along the equator matches up with the composite, except west of 80°E. The El Niño composite shows a broad area of positive anomaly expected over the western half of the Indian Ocean, both north and south of the equator, with extension into the Horn of Africa and eastern Africa. In the actual results for this past month, a strong positive rainfall anomaly existed in the far western Indian Ocean and across central Africa. The heavy rainfall with this feature resulted in flooding and landslides at various times during the month in Somalia, Kenya, Ethiopia and surrounding areas with significant loss of life. However, over Australia, the composite indicates the likelihood of drier than normal conditions, but the past month shows a mixed pattern, with more than half of the country showing positive anomaly conditions.

The South America anomaly pattern for this month shows a reasonable match with the El Niño composite, with dry conditions prevailing over the northern portion of the continent, including most of the Amazon basin, where a major drought continues. Just south of the observed, intense rainfall deficit across the Amazon and extending out into the Atlantic, a wetter-than-normal feature is evident along the coast of southern Brazil and also extending to the east. That feature was associated with flooding during a sequence of weather events in the general border regions of Paraguay, Uruguay, Argentina and Brazil.
While South America's anomaly pattern for this November can be linked to El Niño, in North America the past month's precipitation does not match what is typical under El Niño conditions. While the El Niño composite has a well-defined positive precipitation anomaly lying across the southern U.S. and Mexico, extending up from the eastern Pacific ITCZ, the anomaly pattern for this November is evident in the southern portions of that area, but not across most of the U.S. portion where dry conditions exist. However, heavy rain events in South Texas, Louisiana, and South Florida may indicate a northward creeping El Niño effect. A mostly dry pattern over most of the rest of North America was related to drought-like conditions elsewhere, especially in the east, where there were even wildfires under the dry conditions in the mountains of Virginia, although there was some rain in the last half of the month along the east coast which did alleviate some of the drought conditions. Although the Atlantic hurricane season ended quietly in general, a small tropical disturbance hit the Dominican Republic (and Haiti and Jamaica) with significant floods there.

In the North Atlantic and into Europe, a positive precipitation anomaly extends from off the coast of the southeast U.S., across the Atlantic to the northeast and then across all of Europe and into northern Asia. This monthly feature was related to the passage of strong cyclonic storms and fronts hitting the U.K. and the continent from the Atlantic and also storms hitting the Black Sea area (Russia, Ukraine, Turkey, Greece) further south. The widespread precipitation did much to alleviate the drought conditions over much of Europe.
On a global basis, November 2023 was the warmest November on record, in terms of global surface temperature. As noted previously in some (not all) other similar months, this is connected with a global precipitation estimate also a record high for November 2023. Gu and Adler (2022) have explored this weak positive relation on an annual scale. Another, clearly visible trend on a near global-scale pattern for Novembers, Fig. 3 shows the mean precipitation for two latitude bands (land + ocean) over the last 40+ years, which show the upward trend in the ITCZ region (0–10°N) and the downward trend in the northern mid-latitude region (30–40°N), with the ITCZ band hitting a record value for this November, indicating the overall strength of the deep tropical rainfall under these very warm conditions.
For the three-month September–November season compilation, Figure 4 shows the mean precipitation map and the associated anomaly field. Since the El Niño has been operating over these three months its effects are still obvious, but somewhat smoothed out, with a mostly wet Africa, mostly dry Australia, mostly dry South and North America and mostly wet Eurasia. Over oceans, the wet and dry features of El Niño dominate over the tropics to mostly complete the picture.
References
- Adler, R., G. Gu, M. Sapiano, J. Wang, G. Huffman 2017. Global Precipitation: Means, Variations and Trends During the Satellite Era (1979-2014). Surveys in Geophysics 38: 679-699, doi:10.1007/s10712-017-9416-4
- Adler, R., M. Sapiano, G. Huffman, J. Wang, G. Gu, D. Bolvin, L. Chiu, U. Schneider, A. Becker, E. Nelkin, P. Xie, R. Ferraro, D. Shin, 2018. The Global Precipitation Climatology Project (GPCP) Monthly Analysis (New Version 2.3) and a Review of 2017 Global Precipitation. Atmosphere. 9(4), 138; doi:10.3390/atmos9040138
- Gu, G., and R. Adler, 2022. Observed Variability and Trends in Global Precipitation During 1979-2020. Climate Dynamics, doi:10.1007/s00382-022-06567-9
- Huang, B., Peter W. Thorne, et. al, 2017: Extended Reconstructed Sea Surface Temperature version 5 (ERSSTv5), Upgrades, validations, and intercomparisons. J. Climate, doi: 10.1175/JCLI-D-16-0836.1
- Huang, B., V.F. Banzon, E. Freeman, J. Lawrimore, W. Liu, T.C. Peterson, T.M. Smith, P.W. Thorne, S.D. Woodruff, and H-M. Zhang, 2016: Extended Reconstructed Sea Surface Temperature Version 4 (ERSST.v4). Part I: Upgrades and Intercomparisons. J. Climate, 28, 911-930, doi:10.1175/JCLI-D-14-00006.1.
- Menne, M. J., C. N. Williams, B.E. Gleason, J. J Rennie, and J. H. Lawrimore, 2018: The Global Historical Climatology Network Monthly Temperature Dataset, Version 4. J. Climate, in press. https://doi.org/10.1175/JCLI-D-18-0094.1.
- Peterson, T.C. and R.S. Vose, 1997: An Overview of the Global Historical Climatology Network Database. Bull. Amer. Meteorol. Soc., 78, 2837-2849.
- Vose, R., B. Huang, X. Yin, D. Arndt, D. R. Easterling, J. H. Lawrimore, M. J. Menne, A. Sanchez-Lugo, and H. M. Zhang, 2021. Implementing Full Spatial Coverage in NOAA's Global Temperature Analysis. Geophysical Research Letters 48(10), e2020GL090873; doi:10.1029/2020gl090873.