Significant Events

The Atlantic continued its record-setting pace in September, which is the climatological peak of hurricane season. The 10 named storms that formed in September broke the previous record of eight, which happened in 2002, 2007, and 2010. Five named storms were active on September 14 alone—the first time since 1971 to have that many simultaneously. The season as a whole has produced 23 storms, which puts 2020 six storms ahead of the current record-holder, 2005, through September. However, as has been the case all year, many of the storms in September were weak or short-lived. Four of the ten named storms became hurricanes, but only one, Teddy, became a major hurricane. Similar to the rest of the season, half of the named storms lasted 3 days or less. As a result, the Accumulated Cyclone Energy (ACE), which measures the strength and duration of tropical storms and hurricanes, is about 20-25% above average and just on the cusp of the top one-third of years since 1981 for both September alone and the season as a whole.
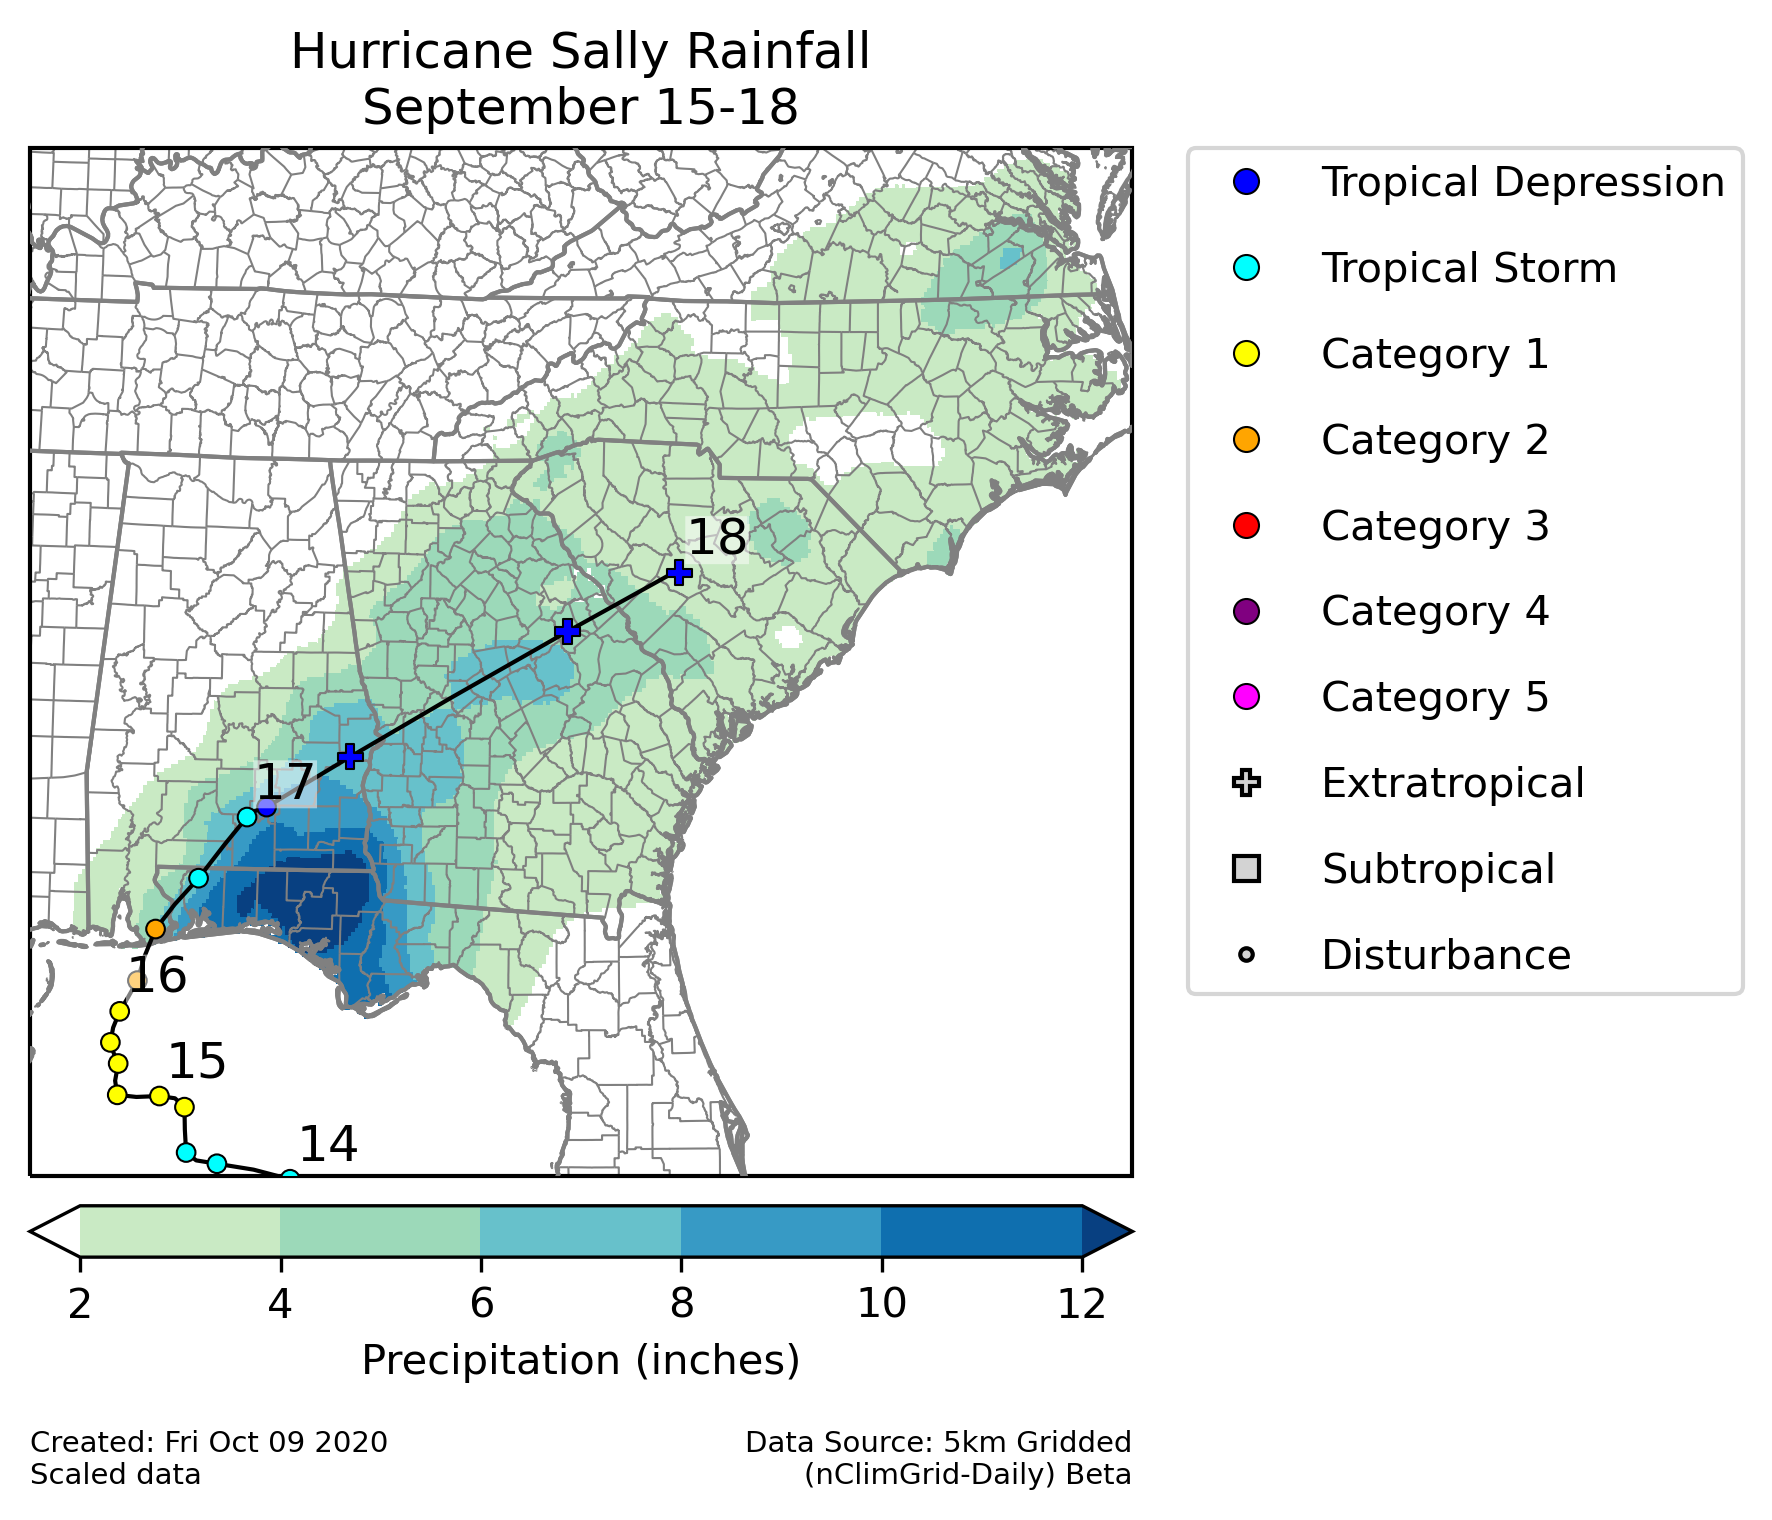
Hurricane Teddy was the strongest storm in September and the second major hurricane of the 2020 Atlantic hurricane season. It was a typical Cape Verde hurricane but it recurved northward and largely stayed out to sea until its landfall in Nova Scotia as an post-tropical storm with gale-force winds. Hurricane Sally was the fourth hurricane to make landfall over the contiguous U.S. in 2020. It came ashore in Alabama as a category 2 hurricane and brought heavy rain across the Southeast. The heaviest rain fell in the Florida Panhandle, but totals over 2 inches in four days were observed a swath extending to southeastern Virginia.
In contrast to the Atlantic, the East Pacific has remained unusually quiet in 2020. Four named storms developed during September, which is close to the 1981-2010 average of 3.6. However, none of them attained hurricane strength during the month. Hurricane Marie became a named storm on September 29 but became a hurricane on October 1. The season as a whole remains in the bottom third of years since 1981 for most metrics, and the ACE is less than half of its 1981-2010 mean value through September.
North Atlantic
| Name |
Maximum CategoryMax Cat |
Dates >39 mph |
Maximum Sustained Winds | Minimum Central Pressure |
|---|---|---|---|---|
| Nana | 1 | September 1Sep 1-3 | 75 mph | 994 mb |
| Omar | TS | September 2Sep 2 | 40 mph | 1003 mb |
| Paulette | 2 | September 7Sep 7-22 | 105 mph | 965 mb |
| Rene | TS | September 7Sep 7-12 | 50 mph | 1000 mb |
| Sally | 2 | September 12Sep 12-17 | 105 mph | 967 mb |
| Teddy | 4 | September 14Sep 14-23 | 140 mph | 945 mb |
| Vicky | TS | September 14Sep 14-17 | 50 mph | 1000 mb |
| Wilfred | TS | September 18Sep 18-20 | 40 mph | 1007 mb |
| Alpha | TS | September 18Sep 18 | 50 mph | 998 mb |
| Beta | TS | September 18Sep 18-22 | 60 mph | 994 mb |
| Storm Type | Count | 1981-2010 Mean |
1981-2020 Rank* |
1851-2020 Record |
|---|---|---|---|---|
| Tropical Storm Winds ≥ 39 mph (34 kts) | 10 | 4.0 | 1st | 10† (2020) |
| Hurricane Winds ≥ 74 mph (64 kts) | 4 | 2.6 | 5th (tied with 8 other Septembers) | 5 (1981, 1998, 2000, 2005) |
| Major Hurricane Winds ≥ 111 mph (96 kts) | 1 | 1.3 | 16th (tied with 16 other Septembers) | 3 (1981, 1996, 2004, 2010, 2017) |
| Accumulated Cyclone Energy ACE×10⁴ kt² | 62.6 | 51.2 | 14th | 173.7 (2017) |
| †Previous record 8 (2002, 2007, 2010) | ||||
| Storm Type | Count | 1981-2010 Mean |
1981-2020 Rank* |
1851-2020 Record |
|---|---|---|---|---|
| Tropical Storm Winds ≥ 39 mph (34 kts) | 23 | 9.2 | 1st | 23‡ (2020) |
| Hurricane Winds ≥ 74 mph (64 kts) | 8 | 4.7 | 2nd (tied with 4 other seasons) | 10 (2005) |
| Major Hurricane Winds ≥ 111 mph (96 kts) | 2 | 2.2 | 12th (tied with 12 other seasons) | 6 (2004) |
| Accumulated Cyclone Energy ACE×10⁴ kt² | 104.0 | 83.5 | 13th | 219.0 (2004) |
| ‡Previous record 17 (2005, 2011) | ||||
East Pacific
| Name |
Maximum CategoryMax Cat |
Dates >39 mph |
Maximum Sustained Winds | Minimum Central Pressure |
|---|---|---|---|---|
| Julio | TS | September 5Sep 5-6 | 45 mph | 1004 mb |
| Karina | TS | September 13Sep 13-16 | 60 mph | 996 mb |
| Lowell | TS | September 21Sep 21-25 | 50 mph | 999 mb |
| Marie | 4 | September 29-October 6Sep 29-Oct 6 | 130 mph‖ | 948 mb‖ |
| ‖Value occurred in October | ||||
| Storm Type | Count | 1981-2010 Mean |
1981-2020 Rank* |
1949-2020 Record |
|---|---|---|---|---|
| Tropical Storm Winds ≥ 39 mph (34 kts) | 4 | 3.6 | 15th (tied with 8 other Septembers) | 6 (1992, 1994, 1997, 2001, 2005, 2019) |
| Hurricane Winds ≥ 74 mph (64 kts) | 0 | 2.3 | 37th (tied with 3 other Septembers) | 6 (1992) |
| Major Hurricane Winds ≥ 111 mph (96 kts) | 0 | 1.1 | 26th (tied with 14 other Septembers) | 3 (1983, 1985, 1992, 1993) |
| Accumulated Cyclone Energy ACE×10⁴ kt² | 7.0 | 35.7 | 35th | 111.8 (1992) |
| Storm Type | Count | 1981-2010 Mean |
1981-2020 Rank* |
1949-2020 Record |
|---|---|---|---|---|
| Tropical Storm Winds ≥ 39 mph (34 kts) | 13 | 14.1 | 26th (tied with 2 other seasons) | 22 (1992) |
| Hurricane Winds ≥ 74 mph (64 kts) | 3 | 7.5 | 39th (tied with 1 other season) | 14 (1990, 1992) |
| Major Hurricane Winds ≥ 111 mph (96 kts) | 2 | 3.7 | 28th (tied with 7 other seasons) | 9 (1993) |
| Accumulated Cyclone Energy ACE×10⁴ kt² | 54.8 | 110.9 | 34th | 255.1 (1992) |
| *Tropical cyclone data before 1981 have a low bias due to limited access to satellite data and techniques over the open ocean. | ||||