Summary
The Atlantic hurricane season was relatively quiet in October. Major Hurricane Sam and Tropical Storm Victor both formed in September but continued into the first few days of October. In fact, Sam contributed most of the accumulated cyclone energy (ACE: an integrated metric of the strength, frequency, and duration of tropical storms) for October. After Sam dissipated on October 5, there was no other tropical activity in the Atlantic until Tropical Storm Wanda formed in the far northeastern Atlantic on October 31. Typically 2-3 storms develop during October with one becoming a hurricane.
The Atlantic hurricane season through October has had 21 named storms, which is the third most on record. The numbers of hurricanes, major hurricanes, and ACE are all above normal but well behind record levels.
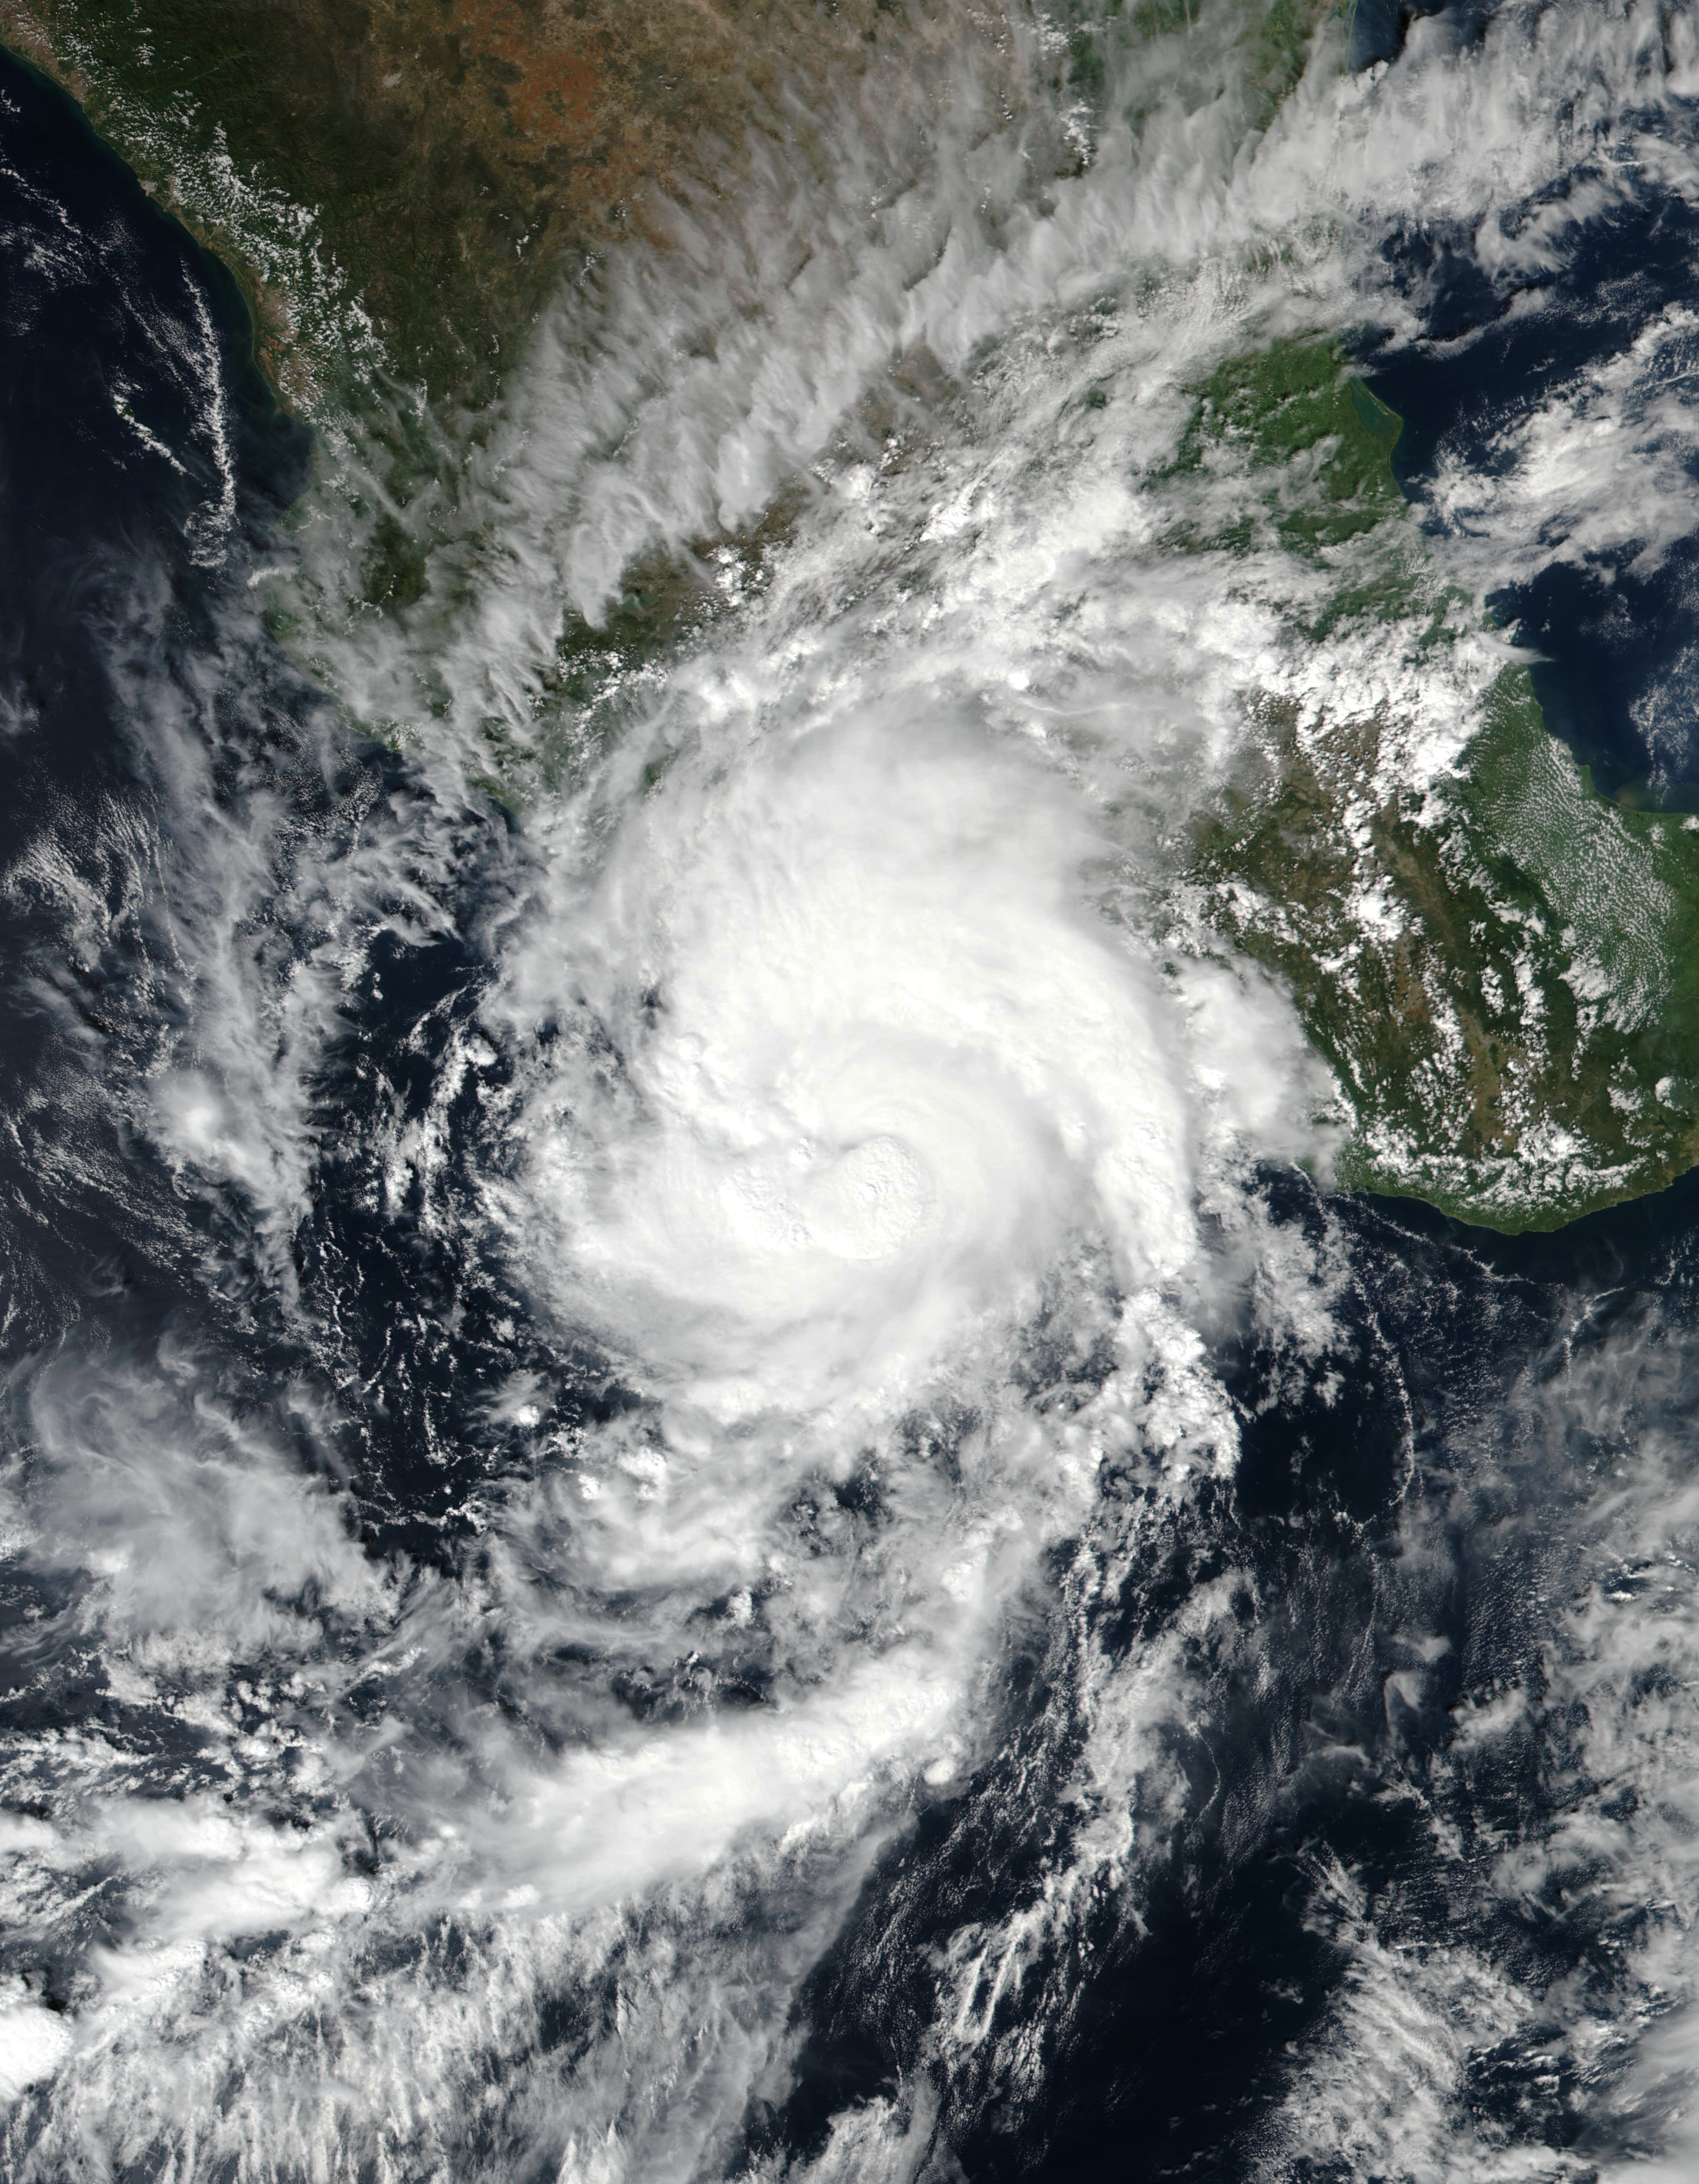
The East Pacific had two hurricanes in October, Pamela and Rick, both of which made landfall in Mexico. Having two hurricanes in October is more than normal, but most other metrics were near normal for October. For the season through October, the number of named storms is above normal, the number of hurricanes is near normal, and the major hurricanes and ACE are both below normal.
In the West Pacific, the remnants of Super Typhoon Mindulle continued from September into October. Four other named storms developed in October, including two typhoons. These numbers were both near normal. However, the West Pacific typically has two major typhoons in October, but 2021 had none. The ACE was also below normal. The West Pacific season through October remains below normal by most metrics.
The North Indian Ocean had two related tropical cyclones, Gulab and Shaheen. Tropical Storm Gulab formed over the Bay of Bengal and made landfall in northeastern India. Its circulation continued across Northern India and reemerged over the Arabian Sea where it redeveloped. The Indian Meteorological Department (IMD) gave this redeveloped storm a new name, Shaheen. Regardless of whether it is counted as one or two storms, the Indian Ocean was quiet in October, as is normal, since neither Gulab or Shaheen intensified beyond tropical storm strength.
Globally, there were 11 named storms including 6 hurricane-strength tropical cyclones in October, which are both near normal. However, only one storm, the continuation of Sam from September in the Atlantic, was a major tropical cyclone. Typically, about 4 major tropical cyclones develop in October. The global ACE was about half of its typical level for October in large part due to the lack of major typhoons in the West Pacific. The global number of named storms for 2021 through October remains above normal, but all other metrics are below normal.
North Atlantic
| Name |
Maximum CategoryMax Cat |
Dates >39 mph |
Maximum Sustained Winds | Minimum Central Pressure |
|---|---|---|---|---|
| Sam | 4 | September 23-October 5Sep 23-Oct 5 | 155 mph† | 929 mb† |
| Victor | TS | September 29-October 2Sep 29-Oct 2 | 65 mph | 997 mb |
| Wanda | TS | October 31-November 2Oct 31-Nov 2 | 50 mph | 987 mb |
| †Value occurred in September | ||||
| Storm Type | Count | 1991-2020 Mean |
1981-2021 Rank* |
1851-2021 Record |
|---|---|---|---|---|
| Tropical Storm Winds ≥ 39 mph (34 kts) | 3 | 3.2 | 14th (tied with 7 other Octobers) | 9 (1950) |
| Hurricane Winds ≥ 74 mph (64 kts) | 1 | 1.7 | 17th (tied with 15 other Octobers) | 5 (1870, 1878, 1950, 2010) |
| Major Hurricane Winds ≥ 111 mph (96 kts) | 1 | 0.8 (8 in 10 Octobers) | 6th (tied with 13 other Octobers) | 3 (2020) |
| Accumulated Cyclone Energy ACE×10⁴ kt² | 23.6 | 21.5 | 16th | 87.8 (1878) |
| Storm Type | Count | 1991-2020 Mean |
1981-2021 Rank* |
1851-2021 Record |
|---|---|---|---|---|
| Tropical Storm Winds ≥ 39 mph (34 kts) | 21 | 13.5 | 3rd | 27 (2020) |
| Hurricane Winds ≥ 74 mph (64 kts) | 7 | 6.6 | 13th (tied with 5 other seasons) | 14 (2005) |
| Major Hurricane Winds ≥ 111 mph (96 kts) | 4 | 3.0 | 8th (tied with 3 other seasons) | 7 (2005) |
| Accumulated Cyclone Energy ACE×10⁴ kt² | 144.3 | 115.8 | 11th | 252.6 (1933) |
East Pacific
| Name |
Maximum CategoryMax Cat |
Dates >39 mph |
Maximum Sustained Winds | Minimum Central Pressure |
|---|---|---|---|---|
| Pamela | 1 | October 10Oct 10-13 | 80 mph | 985 mb |
| Rick | 2 | October 22Oct 22-25 | 105 mph | 977 mb |
| Storm Type | Count | 1991-2020 Mean |
1981-2021 Rank* |
1949-2021 Record |
|---|---|---|---|---|
| Tropical Storm Winds ≥ 39 mph (34 kts) | 2 | 2.8 | 24th (tied with 10 other Octobers) | 6 (1992, 2018) |
| Hurricane Winds ≥ 74 mph (64 kts) | 2 | 1.3 | 9th (tied with 8 other Octobers) | 3 (10 Octobers) |
| Major Hurricane Winds ≥ 111 mph (96 kts) | 0 | 0.7 (7 in 10 Octobers) | 25th (tied with 16 other Octobers) | 3 (1983, 1992, 2018) |
| Accumulated Cyclone Energy ACE×10⁴ kt² | 10.5 | 18.2 | 24th | 78.0 (2018) |
| Storm Type | Count | 1991-2020 Mean |
1981-2021 Rank* |
1949-2021 Record |
|---|---|---|---|---|
| Tropical Storm Winds ≥ 39 mph (34 kts) | 18 | 16.3 | 16th (tied with 4 other seasons) | 27 (1992) |
| Hurricane Winds ≥ 74 mph (64 kts) | 8 | 8.6 | 23rd (tied with 4 other seasons) | 16 (1990, 1992) |
| Major Hurricane Winds ≥ 111 mph (96 kts) | 2 | 4.6 | 30th (tied with 7 other seasons) | 10 (1992, 2015, 2018) |
| Accumulated Cyclone Energy ACE×10⁴ kt² | 93.2 | 130.1 | 29th | 315.3 (2018) |
West Pacific
| Name |
Maximum CategoryMax Cat |
Dates >39 mph |
Maximum Sustained Winds | Minimum Central Pressure |
|---|---|---|---|---|
| Mindulle | 5 | September 23-October 2Sep 23-Oct 2 | 165 mph† | 908 mb† |
| Lionrock | TS | October 8Oct 8-10 | 40 mph | 993 mb |
| Namtheun | 1 | October 10Oct 10-17 | 75 mph | 982 mb |
| Kompasu | TS | October 10Oct 10-14 | 60 mph | 981 mb |
| Malou | 2 | October 25Oct 25-29 | 95 mph | 967 mb |
| †Value occurred in September | ||||
| Storm Type | Count | 1991-2020 Mean |
1981-2021 Rank* |
1945-2021 Record |
|---|---|---|---|---|
| Tropical Storm Winds ≥ 39 mph (34 kts) | 5 | 4.3 | 14th (tied with 6 other Octobers) | 9 (1984, 2013) |
| Typhoon Winds ≥ 74 mph (64 kts) | 3 | 3.2 | 16th (tied with 14 other Octobers) | 7 (1992, 2013) |
| Major Typhoon Winds ≥ 111 mph (96 kts) | 0 | 2.1 | 38th (tied with 3 other Octobers) | 5 (1962, 2013) |
| Accumulated Cyclone Energy ACE×10⁴ kt² | 18.8 | 58.8 | 36th | 127.4 (1992) |
| Storm Type | Count | 1991-2020 Mean |
1981-2021 Rank* |
1945-2021 Record |
|---|---|---|---|---|
| Tropical Storm Winds ≥ 39 mph (34 kts) | 21 | 22.9 | 27th (tied with 4 other seasons) | 34 (1994) |
| Typhoon Winds ≥ 74 mph (64 kts) | 8 | 14.3 | 40th (tied with 1 other season) | 24 (1971) |
| Major Typhoon Winds ≥ 111 mph (96 kts) | 3 | 8.3 | 40th (tied with 1 other season) | 14 (1965, 2015) |
| Accumulated Cyclone Energy ACE×10⁴ kt² | 176.3 | 257.8 | 33rd | 454.0 (1997) |
North Indian
| Name |
Maximum CategoryMax Cat |
Dates >39 mph |
Maximum Sustained Winds | Minimum Central Pressure |
|---|---|---|---|---|
| Gulab:Shaheen-G | TS | September 24-October 1Sep 24-Oct 1 | 60 mph | 983 mb |
| Storm Type | Count | 1991-2020 Mean |
1981-2021 Rank* |
1972-2021 Record |
|---|---|---|---|---|
| Tropical Storm Winds ≥ 39 mph (34 kts) | 1 | 1.1 | 14th (tied with 17 other Octobers) | 2 (13 Octobers) |
| Cyclone Winds ≥ 74 mph (64 kts) | 0 | 0.4 (4 in 10 Octobers) | 9th (tied with 32 other Octobers) | 2 (1999, 2014, 2018) |
| Major Cyclone Winds ≥ 111 mph (96 kts) | 0 | 0.3 (3 in 10 Octobers) | 8th (tied with 33 other Octobers) | 2 (1999, 2014) |
| Accumulated Cyclone Energy ACE×10⁴ kt² | 1.1 | 5.3 | 20th | 26.2 (2019) |
| Storm Type | Count | 1991-2020 Mean |
1981-2021 Rank* |
1972-2021 Record |
|---|---|---|---|---|
| Tropical Storm Winds ≥ 39 mph (34 kts) | 3 | 3.4 | 16th (tied with 7 other seasons) | 6 (1992, 1996, 2006, 2019) |
| Cyclone Winds ≥ 74 mph (64 kts) | 2 | 1.2 | 5th (tied with 6 other seasons) | 4 (2019) |
| Major Cyclone Winds ≥ 111 mph (96 kts) | 1 | 0.8 (8 in 10 seasons) | 6th (tied with 13 other seasons) | 3 (1999, 2019) |
| Accumulated Cyclone Energy ACE×10⁴ kt² | 16.4 | 15.4 | 12th | 68.9 (2019) |
South Indian
No South Indian Tropical Cyclones occurred during October 2021.
| Storm Type | Count | 1991-2020 Mean |
1981-2021 Rank* |
1956-2021 Record |
|---|---|---|---|---|
| Tropical Storm Winds ≥ 39 mph (34 kts) | 0 | 0.5 (5 in 10 Octobers) | 17th (tied with 25 other Octobers) | 2 (1993, 2002) |
| Cyclone Winds ≥ 74 mph (64 kts) | 0 | 0.1 (1 in 10 Octobers) | 5th (tied with 37 other Octobers) | 1 (1982, 1984, 1997, 2013) |
| Major Cyclone Winds ≥ 111 mph (96 kts) | 0 | 0.0 (0 in 10 Octobers) | 2nd (tied with 40 other Octobers) | 1 (2013) |
| Accumulated Cyclone Energy ACE×10⁴ kt² | 0.0 | 1.0 | 17th (tied with 25 other Octobers) | 12.5 (2013) |
| Storm Type | Count | 1991-2020 Mean |
1981-2021 Rank* |
1956-2021 Record |
|---|---|---|---|---|
| Tropical Storm Winds ≥ 39 mph (34 kts) | 0 | 0.8 (8 in 10 seasons) | 24th (tied with 18 other seasons) | 3 (1997) |
| Cyclone Winds ≥ 74 mph (64 kts) | 0 | 0.1 (1 in 10 seasons) | 6th (tied with 36 other seasons) | 1 (5 seasons) |
| Major Cyclone Winds ≥ 111 mph (96 kts) | 0 | 0.0 (0 in 10 seasons) | 2nd (tied with 40 other seasons) | 1 (2013) |
| Accumulated Cyclone Energy ACE×10⁴ kt² | 0.0 | 1.6 | 24th (tied with 18 other seasons) | 12.5 (2013) |
Australia
No Australia Tropical Cyclones occurred during October 2021.
| Storm Type | Count | 1991-2020 Mean |
1981-2021 Rank* |
1956-2021 Record |
|---|---|---|---|---|
| Tropical Storm Winds ≥ 39 mph (34 kts) | 0 | 0.1 (1 in 10 Octobers) | 6th (tied with 36 other Octobers) | 1 (5 Octobers) |
| Tropical Cyclone Winds ≥ 74 mph (64 kts) | 0 | 0.0 (0 in 10 Octobers) | 2nd (tied with 40 other Octobers) | 1 (1984) |
| Major Tropical Cyclone Winds ≥ 111 mph (96 kts) | 0 | 0.0 (0 in 10 Octobers) | 1st (tied with 41 other Octobers) | 0 |
| Accumulated Cyclone Energy ACE×10⁴ kt² | 0.0 | 0.2 (2 in 10 Octobers) | 6th (tied with 36 other Octobers) | 2.2 (1984) |
| Storm Type | Count | 1991-2020 Mean |
1981-2021 Rank* |
1956-2021 Record |
|---|---|---|---|---|
| Tropical Storm Winds ≥ 39 mph (34 kts) | 0 | 0.3 (3 in 10 seasons) | 11th (tied with 31 other seasons) | 2 (1997) |
| Tropical Cyclone Winds ≥ 74 mph (64 kts) | 0 | 0.0 (0 in 10 seasons) | 2nd (tied with 40 other seasons) | 1 (1984) |
| Major Tropical Cyclone Winds ≥ 111 mph (96 kts) | 0 | 0.0 (0 in 10 seasons) | 1st (tied with 41 other seasons) | 0 |
| Accumulated Cyclone Energy ACE×10⁴ kt² | 0.0 | 0.3 (3 in 10 seasons) | 11th (tied with 31 other seasons) | 2.2 (1984) |
Southwest Pacific
No Southwest Pacific Tropical Cyclones occurred during October 2021.
| Storm Type | Count | 1991-2020 Mean |
1981-2021 Rank* |
1956-2021 Record |
|---|---|---|---|---|
| Tropical Storm Winds ≥ 39 mph (34 kts) | 0 | 0.2 (2 in 10 Octobers) | 5th (tied with 37 other Octobers) | 3 (1998) |
| Tropical Cyclone Winds ≥ 74 mph (64 kts) | 0 | 0.0 (0 in 10 Octobers) | 2nd (tied with 40 other Octobers) | 1 (2007) |
| Major Tropical Cyclone Winds ≥ 111 mph (96 kts) | 0 | 0.0 (0 in 10 Octobers) | 2nd (tied with 40 other Octobers) | 1 (2007) |
| Accumulated Cyclone Energy ACE×10⁴ kt² | 0.0 | 0.5 (5 in 10 Octobers) | 5th (tied with 37 other Octobers) | 9.6 (2007) |
| Storm Type | Count | 1991-2020 Mean |
1981-2021 Rank* |
1956-2021 Record |
|---|---|---|---|---|
| Tropical Storm Winds ≥ 39 mph (34 kts) | 0 | 0.3 (3 in 10 seasons) | 7th (tied with 35 other seasons) | 3 (1998) |
| Tropical Cyclone Winds ≥ 74 mph (64 kts) | 0 | 0.0 (0 in 10 seasons) | 2nd (tied with 40 other seasons) | 1 (2007) |
| Major Tropical Cyclone Winds ≥ 111 mph (96 kts) | 0 | 0.0 (0 in 10 seasons) | 2nd (tied with 40 other seasons) | 1 (2007) |
| Accumulated Cyclone Energy ACE×10⁴ kt² | 0.0 | 0.6 (6 in 10 seasons) | 6th (tied with 36 other seasons) | 9.6 (2007) |
Global
| Name |
Maximum CategoryMax Cat |
Dates >39 mph |
Maximum Sustained Winds | Minimum Central Pressure |
|---|---|---|---|---|
| Sam | 4 | September 23-October 5Sep 23-Oct 5 | 155 mph† | 929 mb† |
| Mindulle | 5 | September 23-October 2Sep 23-Oct 2 | 165 mph† | 908 mb† |
| Gulab:Shaheen-G | TS | September 24-October 1Sep 24-Oct 1 | 60 mph | 983 mb |
| Victor | TS | September 29-October 2Sep 29-Oct 2 | 65 mph | 997 mb |
| Lionrock | TS | October 8Oct 8-10 | 40 mph | 993 mb |
| Pamela | 1 | October 10Oct 10-13 | 80 mph | 985 mb |
| Namtheun | 1 | October 10Oct 10-17 | 75 mph | 982 mb |
| Kompasu | TS | October 10Oct 10-14 | 60 mph | 981 mb |
| Rick | 2 | October 22Oct 22-25 | 105 mph | 977 mb |
| Malou | 2 | October 25Oct 25-29 | 95 mph | 967 mb |
| Wanda | TS | October 31-November 2Oct 31-Nov 2 | 50 mph | 987 mb |
| †Value occurred in September | ||||
| Storm Type | Count | 1991-2020 Mean |
1981-2021 Rank* |
1972-2021 Record |
|---|---|---|---|---|
| Tropical Storm Winds ≥ 39 mph (34 kts) | 11 | 12.1 | 22nd (tied with 3 other Octobers) | 20 (1992) |
| Tropical Cyclone Winds ≥ 74 mph (64 kts) | 6 | 6.7 | 22nd (tied with 6 other Octobers) | 11 (1992) |
| Major Tropical Cyclone Winds ≥ 111 mph (96 kts) | 1 | 4.0 | 40th (tied with 1 other October) | 7 (2013, 2015, 2016, 2018) |
| Accumulated Cyclone Energy ACE×10⁴ kt² | 54.0 | 105.4 | 34th | 206.8 (2018) |
| Storm Type | Count | 1991-2020 Mean |
1981-2021 Rank* |
1972-2021 Record |
|---|---|---|---|---|
| Tropical Storm Winds ≥ 39 mph (34 kts) | 82 | 76.3 | 13th | 92 (2018) |
| Tropical Cyclone Winds ≥ 74 mph (64 kts) | 33 | 41.6 | 38th (tied with 2 other seasons) | 53 (1990) |
| Major Tropical Cyclone Winds ≥ 111 mph (96 kts) | 14 | 22.5 | 39th (tied with 1 other season) | 35 (2015) |
| Accumulated Cyclone Energy ACE×10⁴ kt² | 564.9 | 687.2 | 31st | 1,016.8 (2018) |
Data Description
The data in this report are derived from NCEI's IBTrACS dataset (Knapp et al. 2010; Schreck et al. 2014). IBTrACS tropical cyclone track and intensity data from agencies and sources around the globe. In this report, data from NOAA's National Hurricane Center (NHC) are used for the North Atlantic and East Pacific. The other basins use data from the U.S. Military's Joint Typhoon Warning Center (JTWC).
Historical values use the "best track" data that have been analyzed by forecasters after the season using all available data. Operational procedures and observing systems have changed with time and between regions, which makes these data heterogeneous. Intensity data are generally the most reliable since the early 1970s in the Atlantic (Landsea and Franklin 2013) and since the mid-1980s in other regions (Chu et al. 2002). The number of short-lived storms (≤2 days) has also increased since around 2000 due to improvements in observations and analysis techniques (Landsea et al. 2010).
Values for the current year are provisional values from the operational forecast advisories. IBTrACS obtains these from NCEP's TC Vitals, the NCAR Tropical Cyclone Guidance Project, and NHC provisional data. These values are subject to change during the post-season best track analysis. They also only include 6-hourly storm fixes, which means they may miss special advisories at landfall, peak intensity, etc.
The tropical cyclone seasons in the Southern Hemisphere begin in July and end in June, while the Northern Hemisphere seasons are counted from January to December. Storms are counted in all basins, months, and years in which they occur, which means some storms may appear more than once. However, the global totals only include each storm one time.
References
- Chu, J.-H., C. R. Sampson, A. S. Levine, and E. Fukada, 2002: The joint typhoon warning center tropical cyclone best-tracks, 1945–2000. Naval Research Laboratory, Reference Number NRL/MR/7540-02-16, 22 pp., https://www.metoc.navy.mil/jtwc/products/best-tracks/tc-bt-report.html.
- Knapp, K. R., M. C. Kruk, D. H. Levinson, H. J. Diamond, and C. J. Neumann, 2010: The International Best Track Archive for Climate Stewardship (IBTrACS). Bull. Amer. Meteor. Soc., 91, 363–376, https://doi.org/10.1175/2009BAMS2755.1.
- Landsea, C. W., and J. L. Franklin, 2013: Atlantic Hurricane database uncertainty and presentation of a new database format. Mon. Wea. Rev., 141, 3576–3592, https://doi.org/10.1175/MWR-D-12-00254.1.
- ——, G. A. Vecchi, L. Bengtsson, and T. R. Knutson, 2010: Impact of duration thresholds on Atlantic tropical cyclone counts. J. Climate, 23, 2508–2519, https://doi.org/10.1175/2009JCLI3034.1.
- Schreck, C. J., K. R. Knapp, and J. P. Kossin, 2014: The Impact of Best Track Discrepancies on Global Tropical Cyclone Climatologies using IBTrACS. Mon. Wea. Rev., 142, 3881–3899, https://doi.org/10.1175/MWR-D-14-00021.1.