Issued 12 November 2021
Please note that the values presented in this report are based on preliminary data. They will change when the final data are processed, but will not be replaced on these pages.
National Drought Highlights
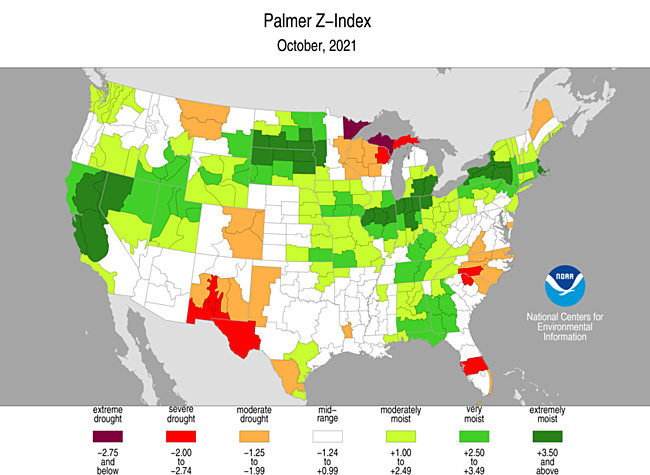
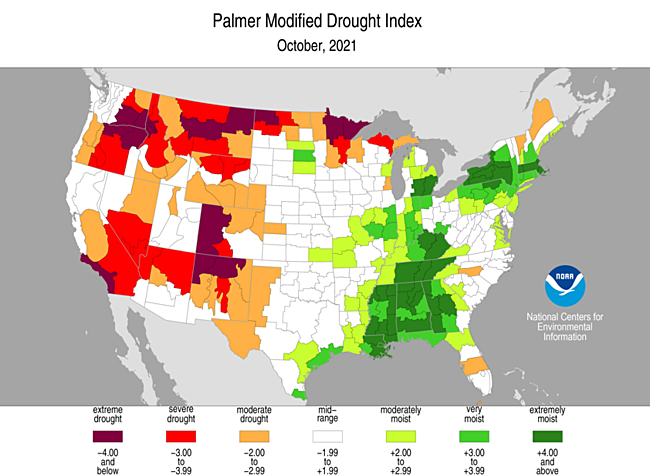
- Based on the Palmer Drought Index, severe to extreme drought affected about 19% of the contiguous United States as of the end of October 2021, a decrease of about 16% from last month. About 14% of the contiguous U.S. fell in the severely to extremely wet categories.
- About 36% of the contiguous U.S. fell in the moderate to extreme drought categories (based on the Palmer Drought Index) at the end of October.
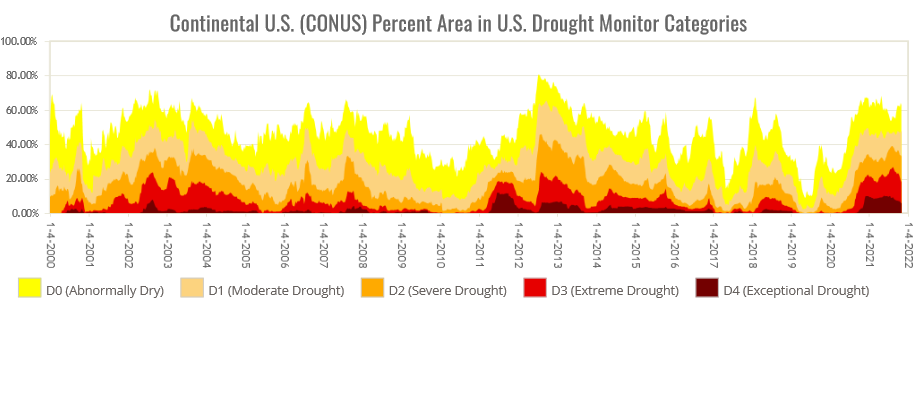
- On a broad scale, the 1980s and 1990s were characterized by unusual wetness with short periods of extensive droughts, the 1930s and 1950s were characterized by prolonged periods of extensive droughts with little wetness, and the first two decades of the 2000s saw extensive drought and extensive wetness (moderate to extreme drought graphic, severe to extreme drought graphic).
- A file containing the national monthly percent area severely dry and wet from 1900 to present is available for the severe to extreme and moderate to extreme categories.
- Historical temperature, precipitation, and Palmer drought data from 1895 to present for climate divisions, states, and regions in the contiguous U.S. are available at the Climate Division: Temperature-Precipitation-Drought Data page. These filenames begin with "climdiv".
U.S. Drought Monitor information is currently unavailable.
Detailed Drought Overview
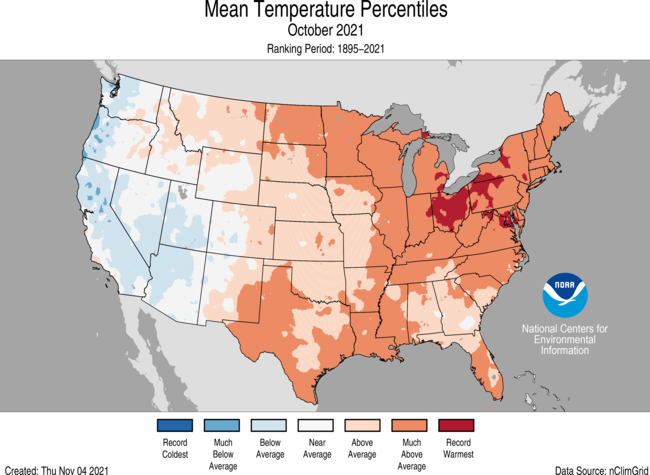
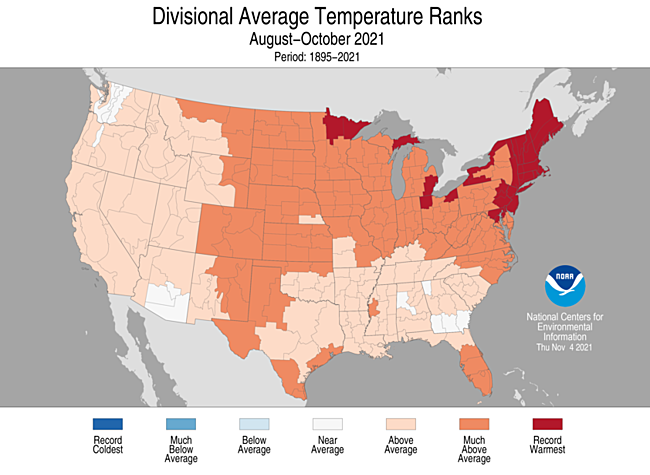
The upper-level circulation during October 2021 was very active with several shortwave troughs and closed lows moving through the jet stream flow. During the first two-thirds of the month they mostly kept to the western CONUS while a ridge dominated the East, but after mid-month they migrated across the entire country. The frontal systems that accompanied the troughs were mostly of Pacific origin. The troughs, fronts, and lows spread above-normal precipitation across much of California and the Great Basin into the Pacific Northwest and central Rockies. Once they crossed the Rockies, they tapped Gulf of Mexico moisture to produce above-normal precipitation across much of the northern Plains and parts of the central Plains, Midwest, Southeast, and Northeast. Some areas missed out on the precipitation. These included parts of the Southwest and central to southern Plains, much of Montana and the Lower Mississippi Valley, the western Great Lakes, northern New England, and Mid-Atlantic coast to Florida. When averaged across the month, the migratory troughs and closed lows flattened the upper-level flow over the CONUS, with the greatest trough/ridge anomalies occurring over Alaska and Canada. The monthly temperature anomaly pattern reflected the dominant flow of the first three weeks, with cooler-than-normal temperatures in the West associated with the troughs and closed lows, and warmer-than-normal temperatures east of the Rockies beneath the dominance of upper-level ridging. Record-warm monthly temperatures occurred from the Ohio Valley to Northeast.
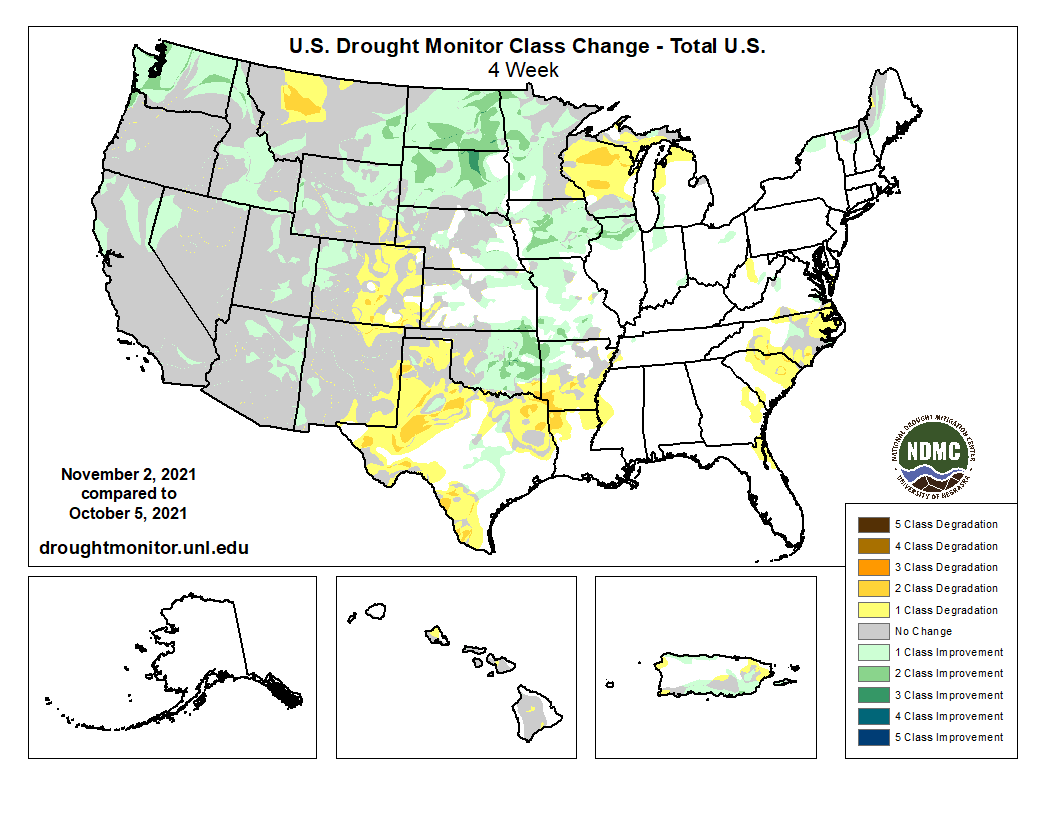
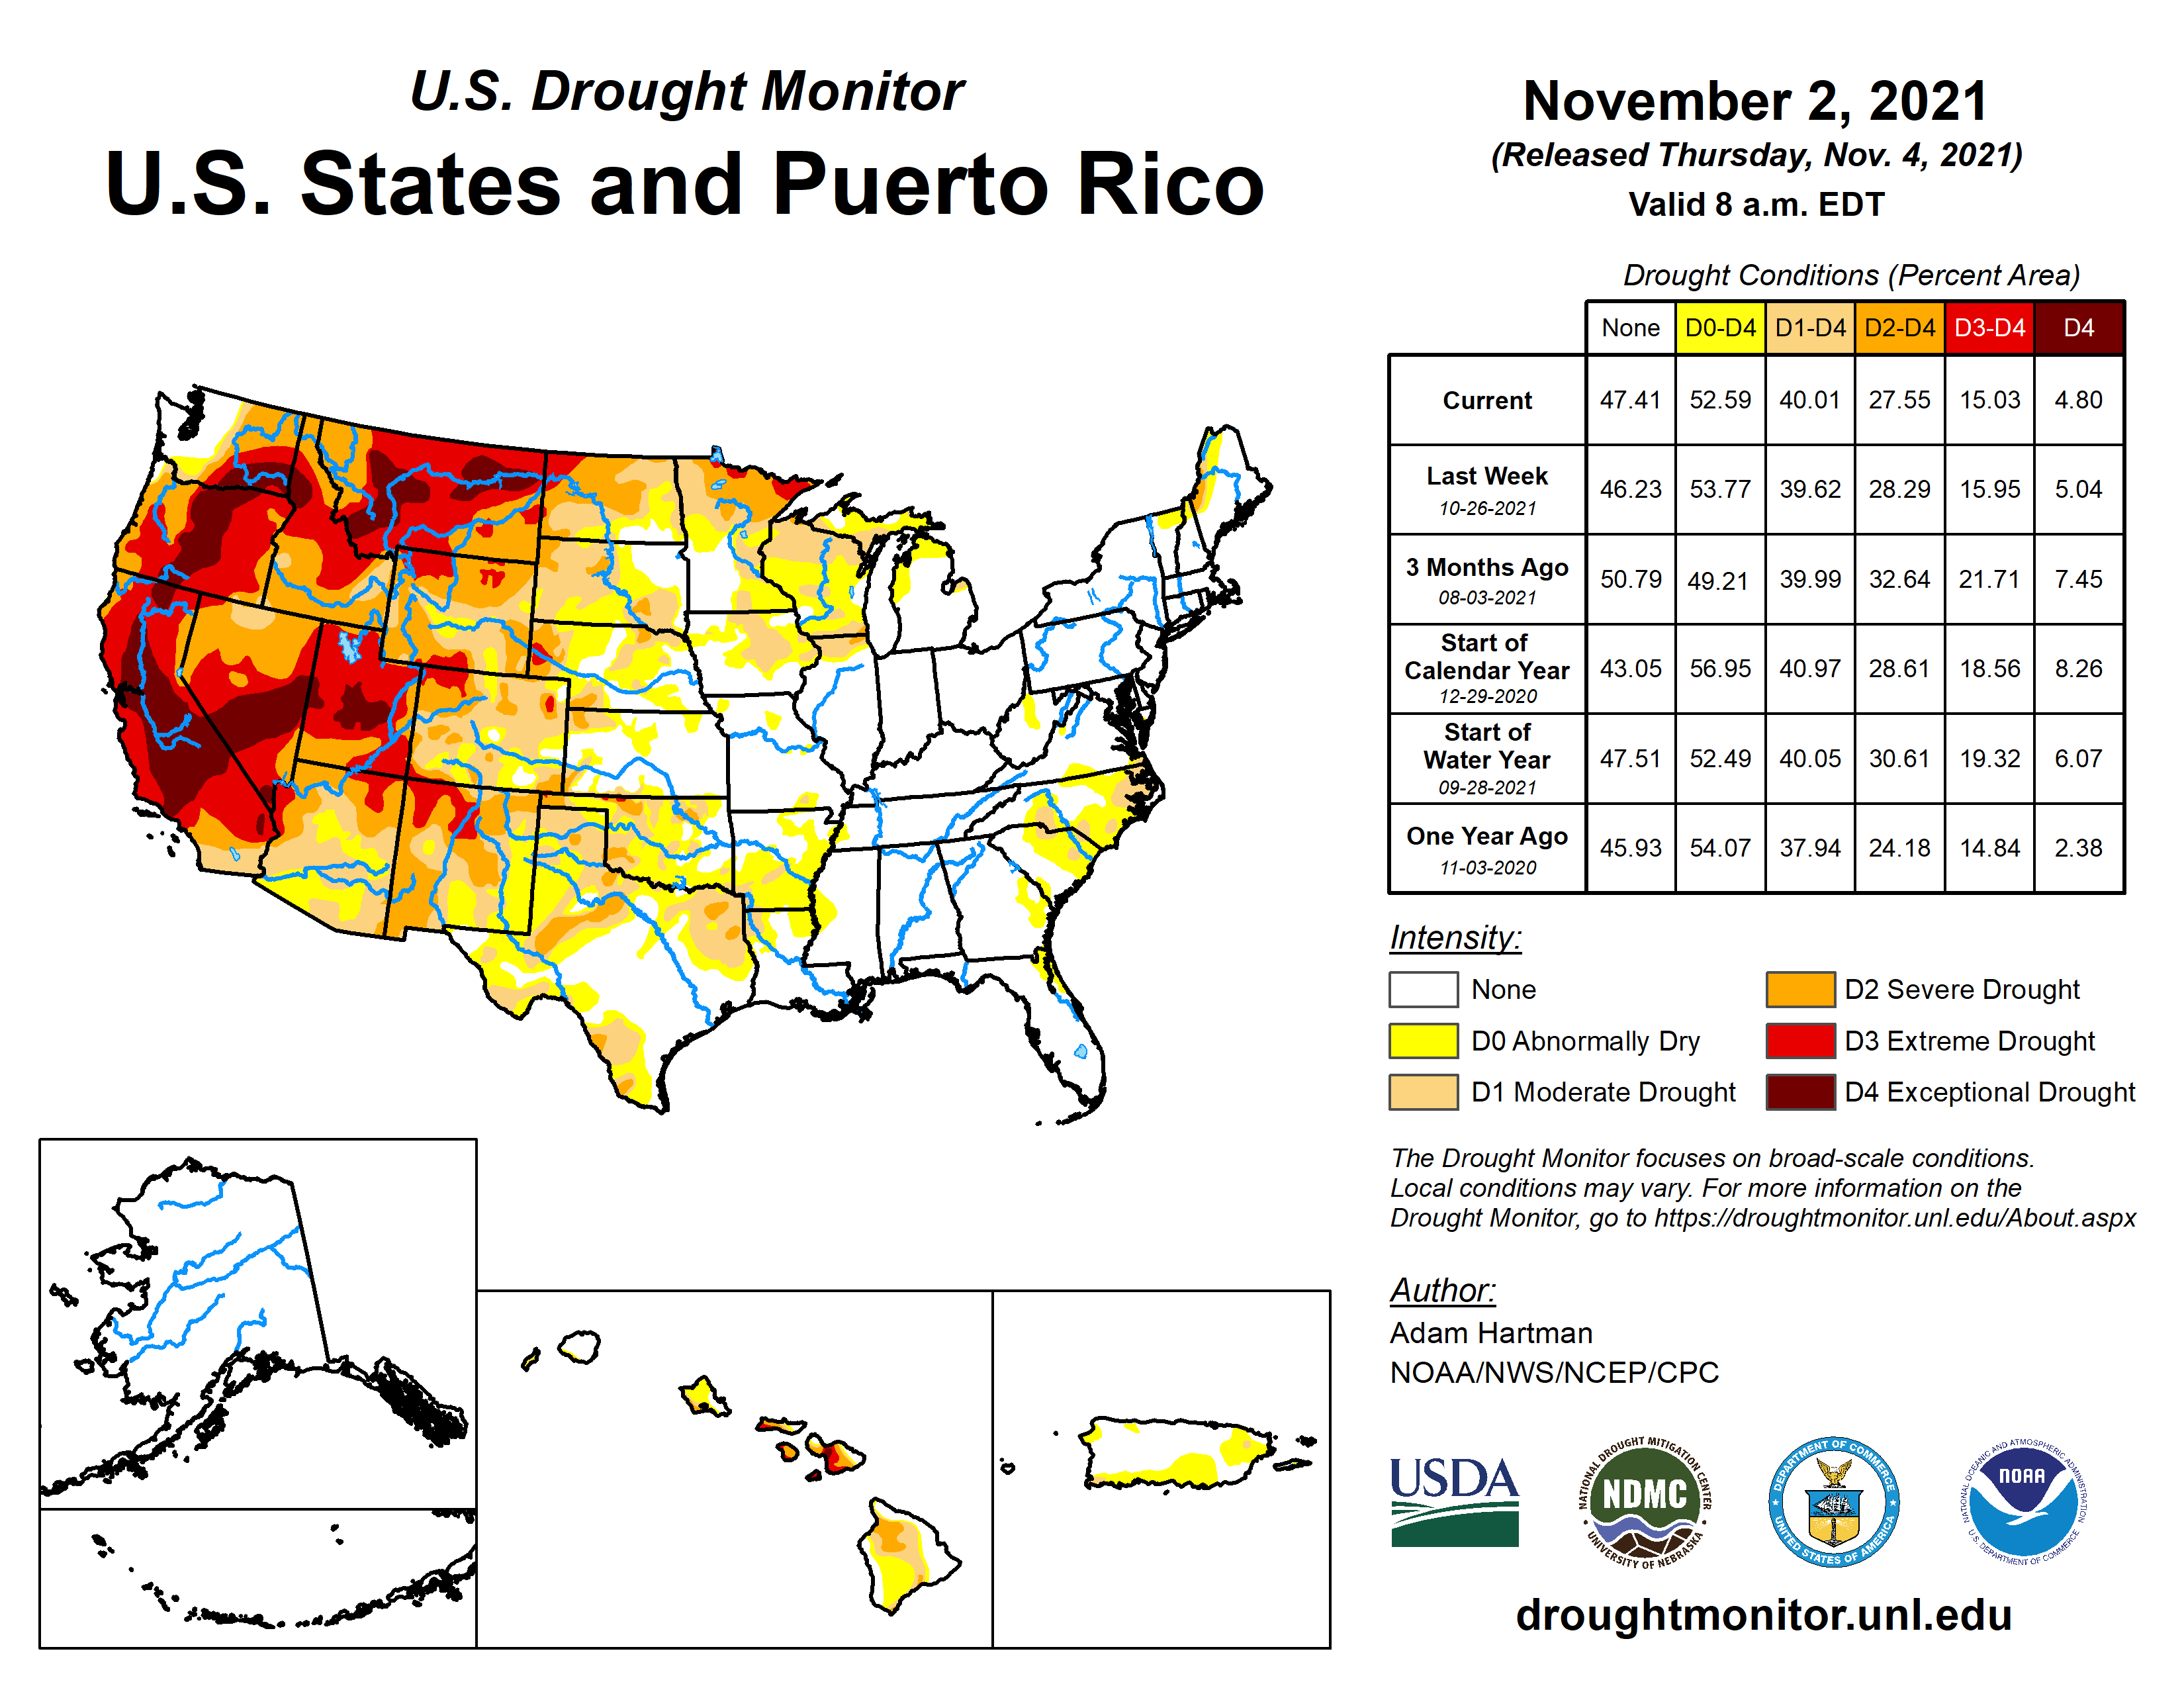
As a result of these conditions, drought or abnormal dryness expanded or intensified in the southern Plains to central High Plains, western Great Lakes, and parts of Montana and the coastal Carolinas. Beneficial precipitation caused drought or abnormal dryness to contract or decrease in intensity in parts of the West, Plains, and Mid- to Upper Mississippi Valley. Drought expansion generally equalled contraction, with the USDM-based national moderate-to-exceptional drought footprint (total area) the same as last month for the CONUS (47.8 percent at the end of September and 47.8 percent at the end of October) and slightly smaller for the 50 States and Puerto Rico (40.1 percent for September and 40.0 percent for October). According to the Palmer Drought Index, which goes back to the beginning of the 20th century, about 35.8 percent of the CONUS was in moderate to extreme drought at the end of October, a decrease when compared to the end of September. The percent area of the CONUS in moderate to extreme drought has hovered between 35 and 49 percent for the last 14 months (since September 2020).
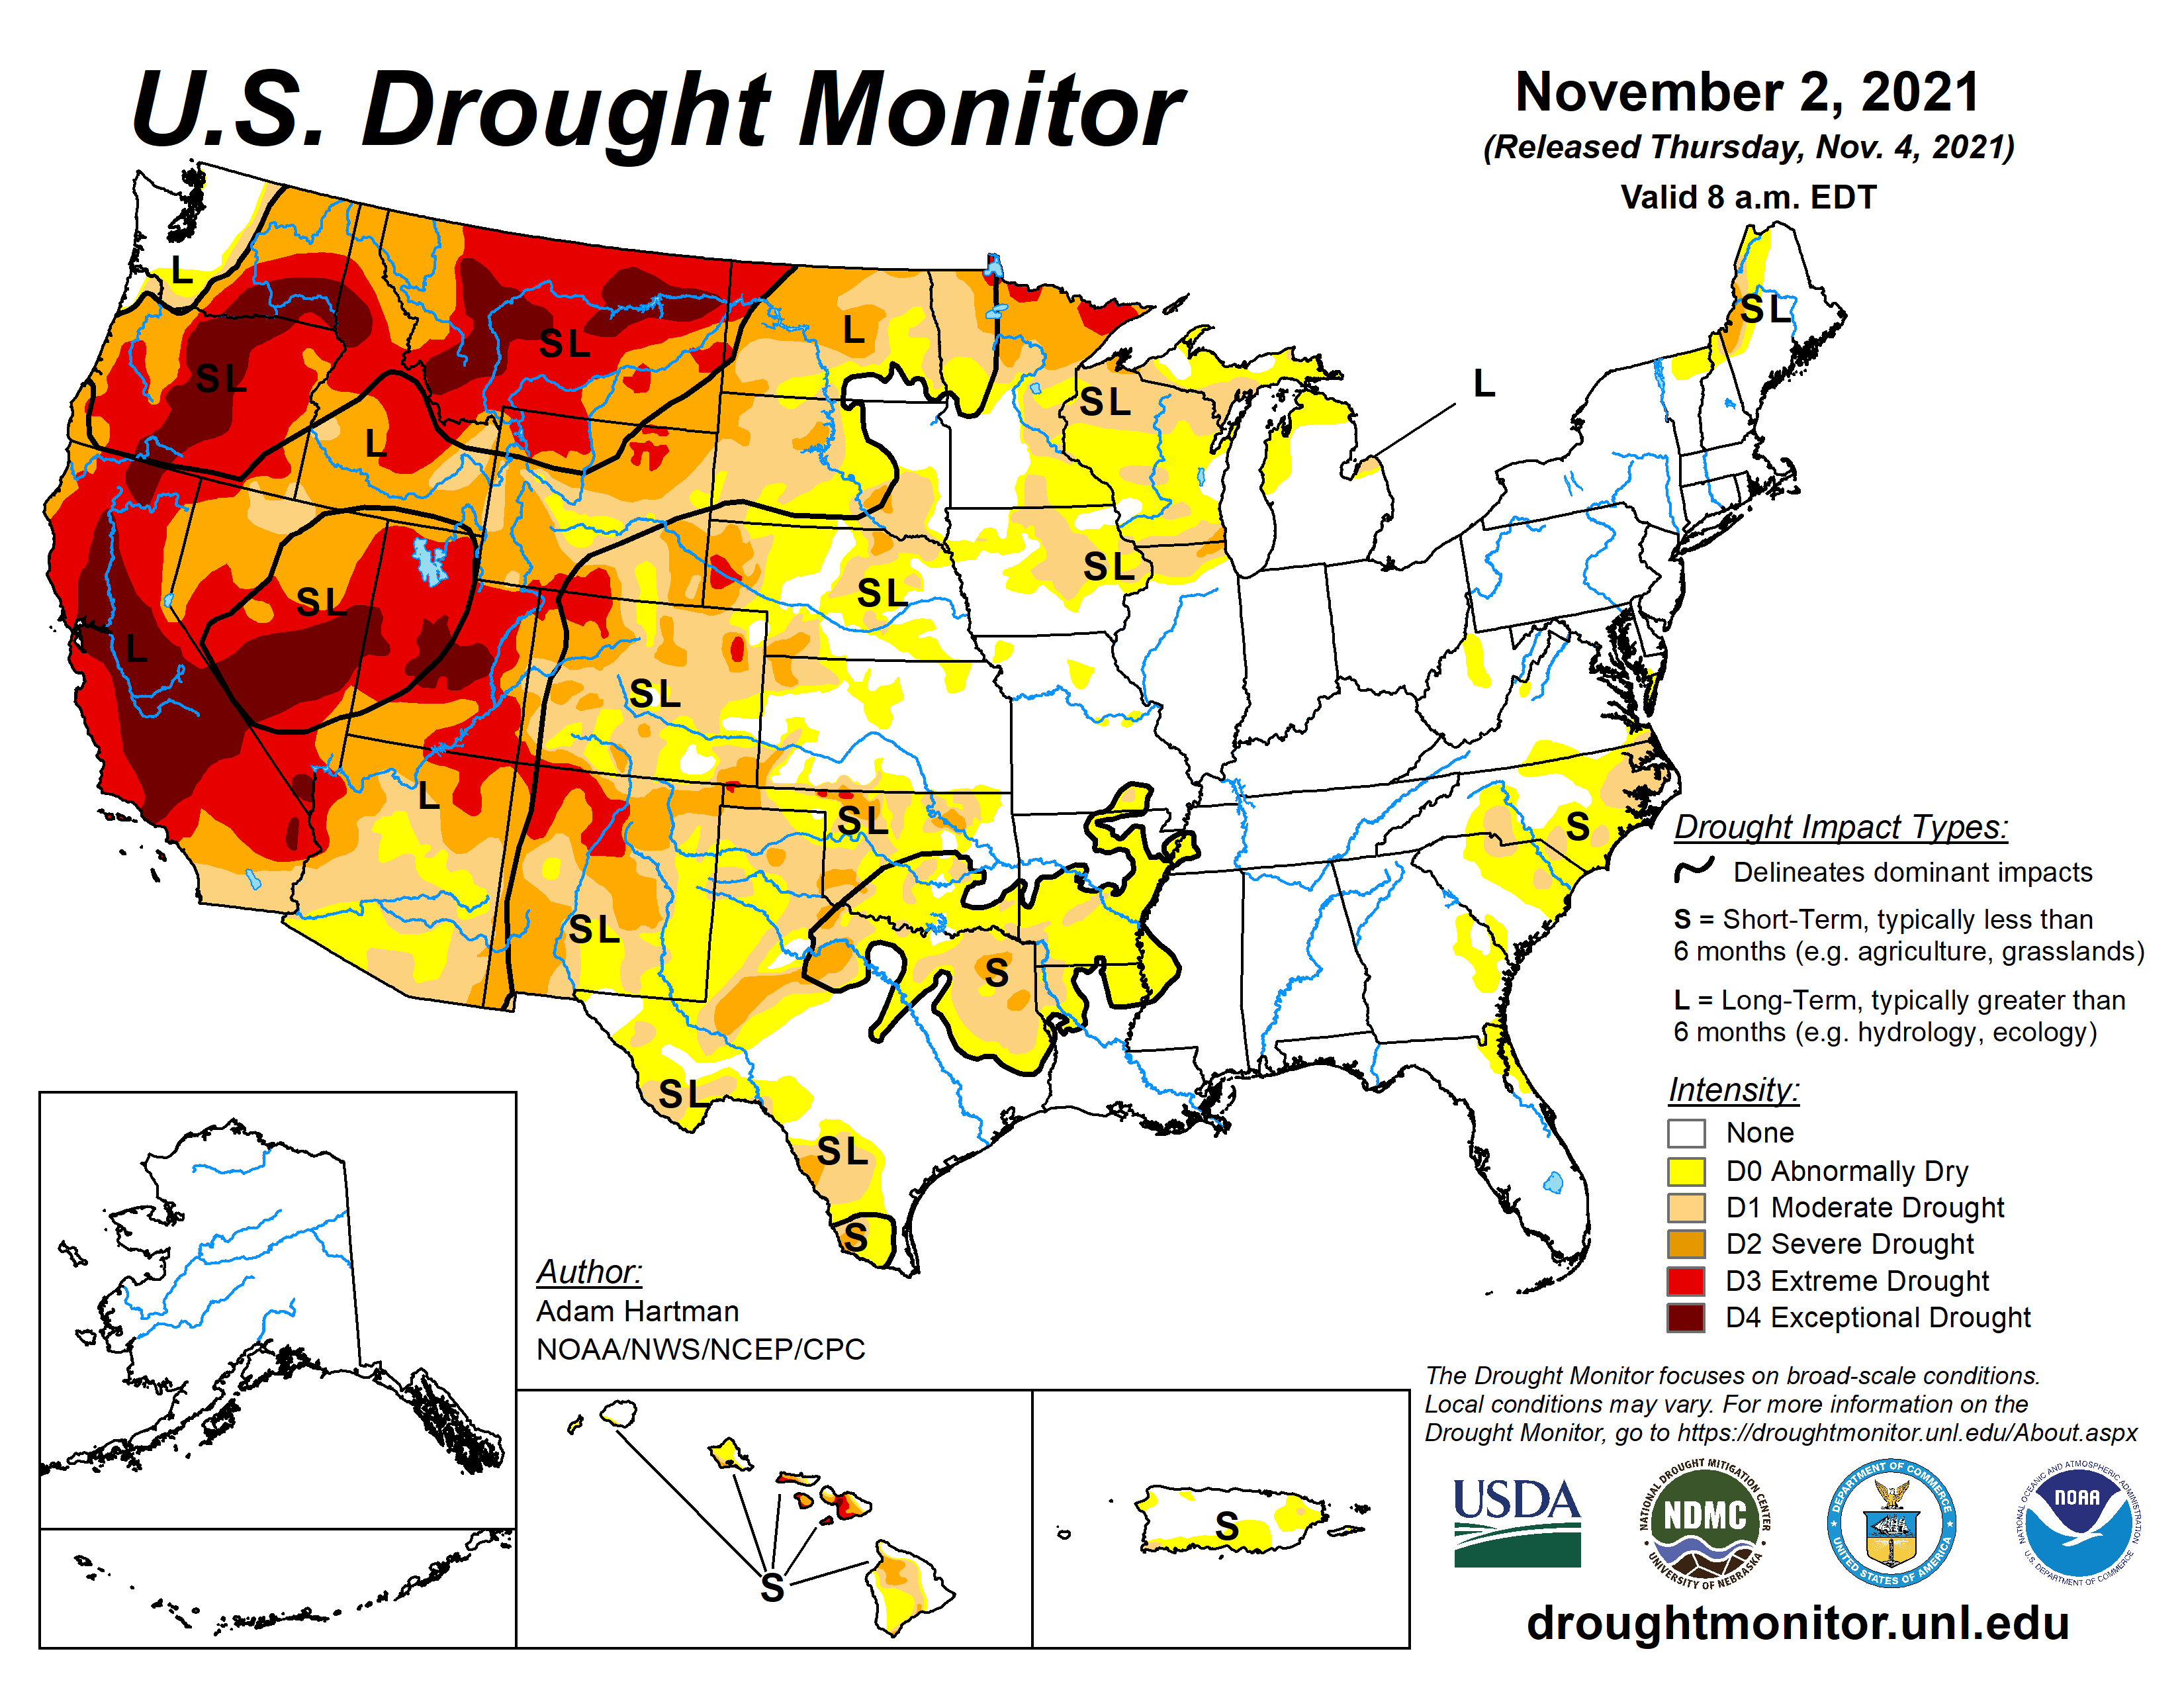
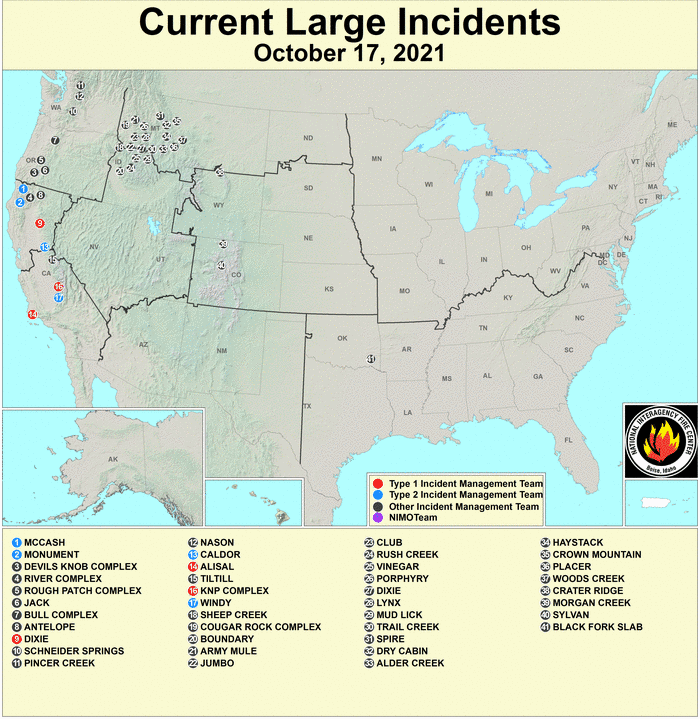
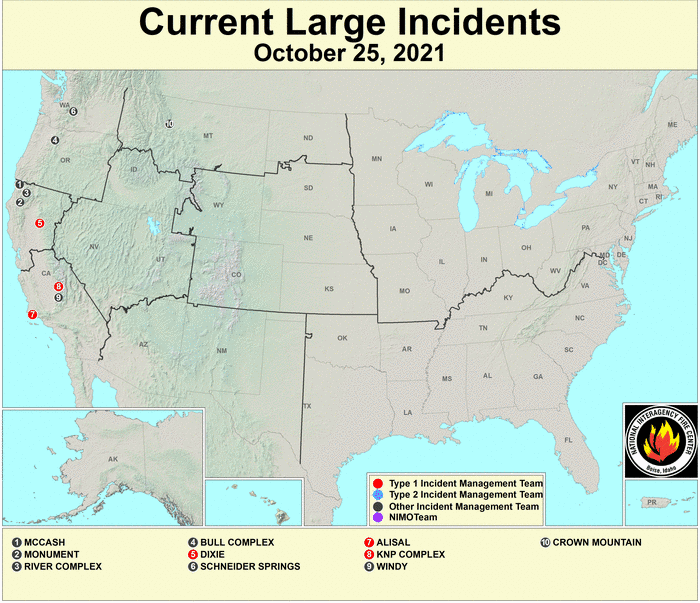
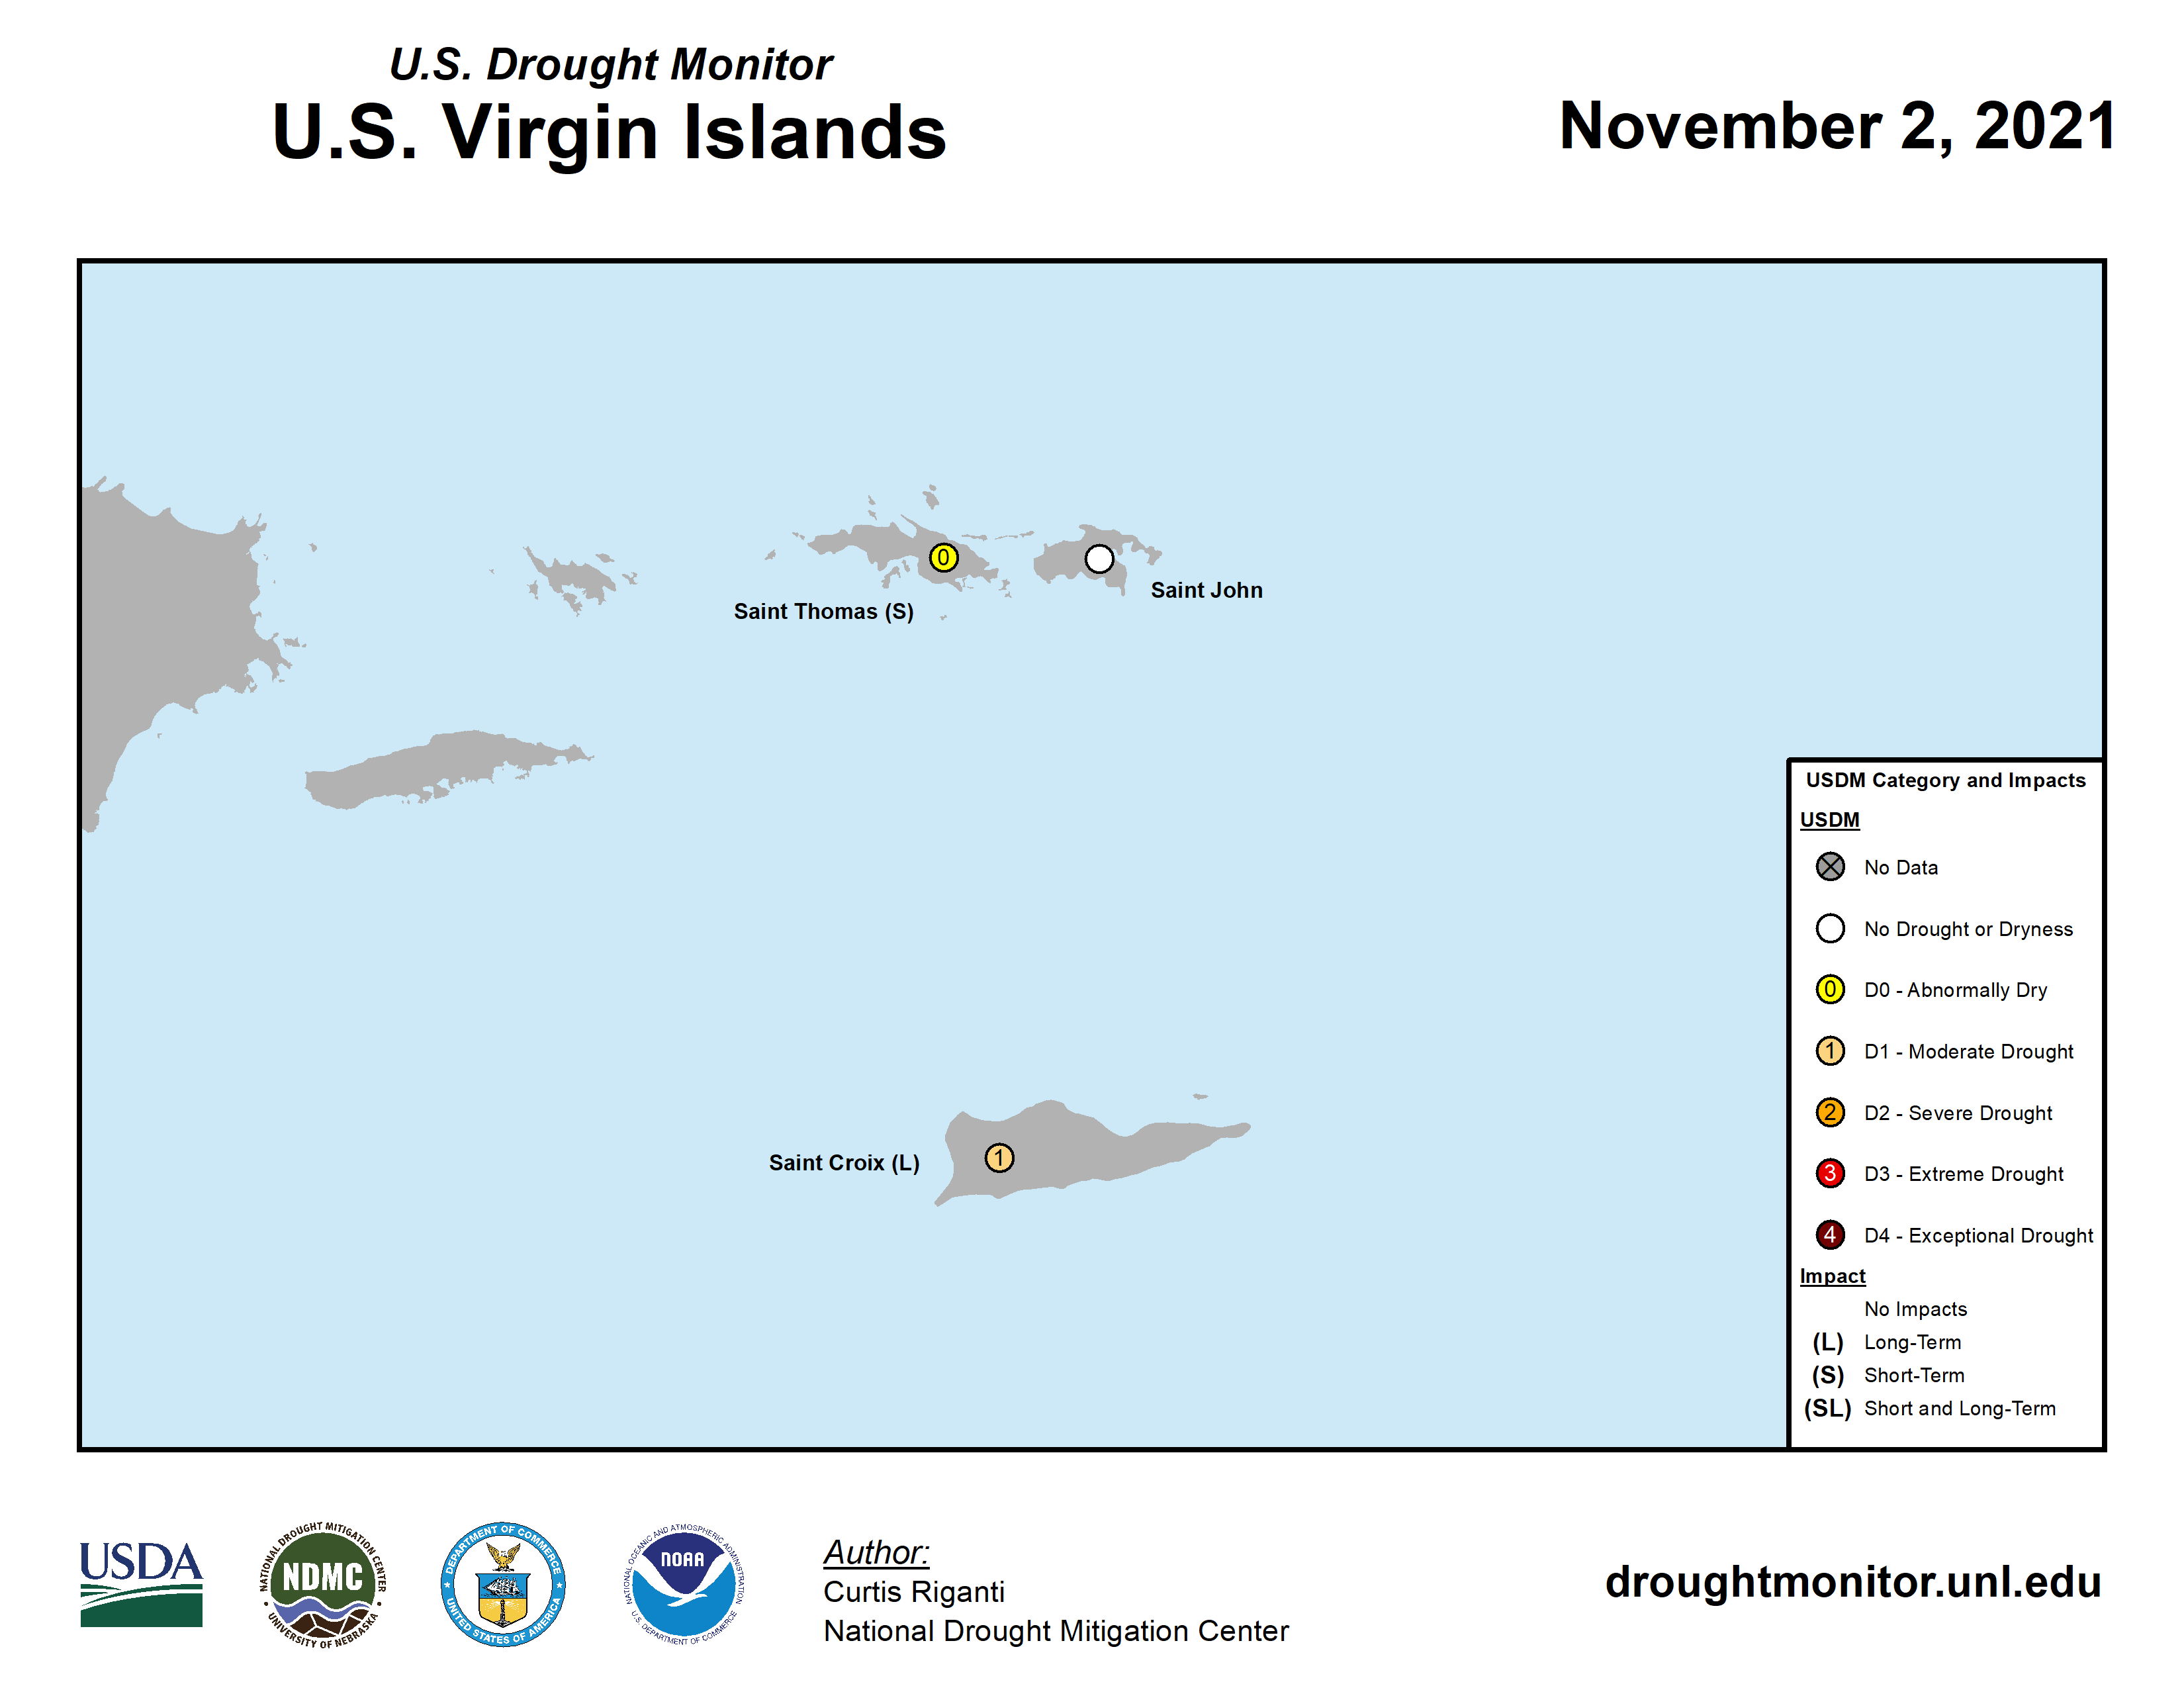
Drought conditions at the end of October, as depicted on the November 2, 2021 USDM map, included the following core drought and abnormally dry areas:
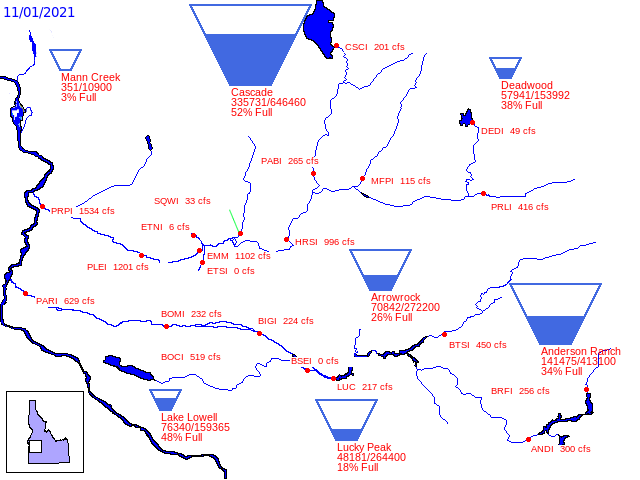
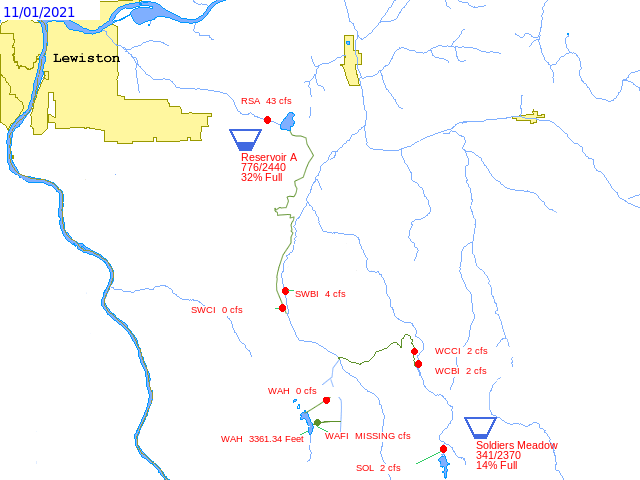
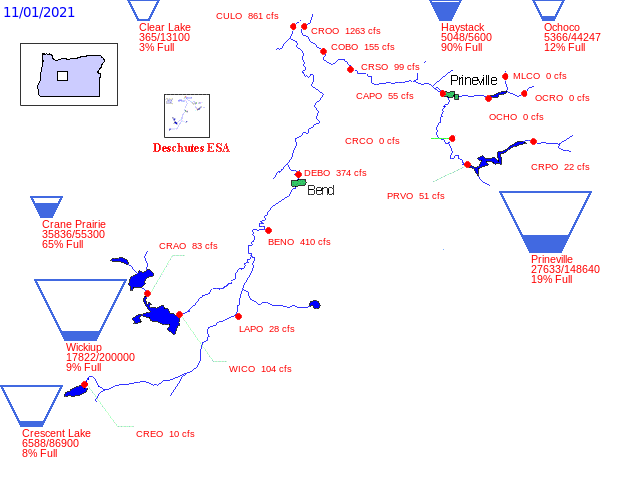
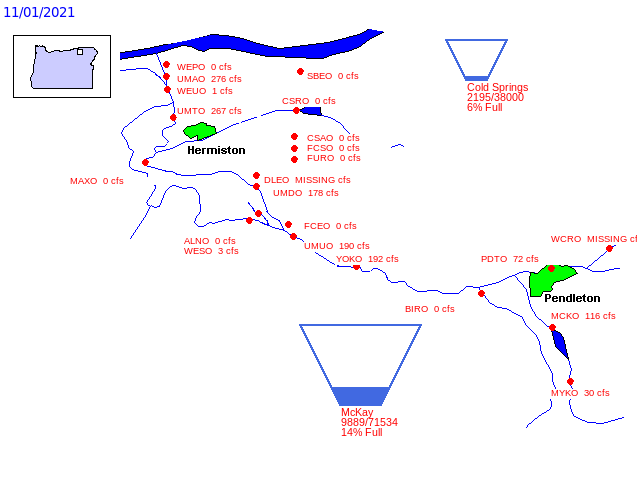
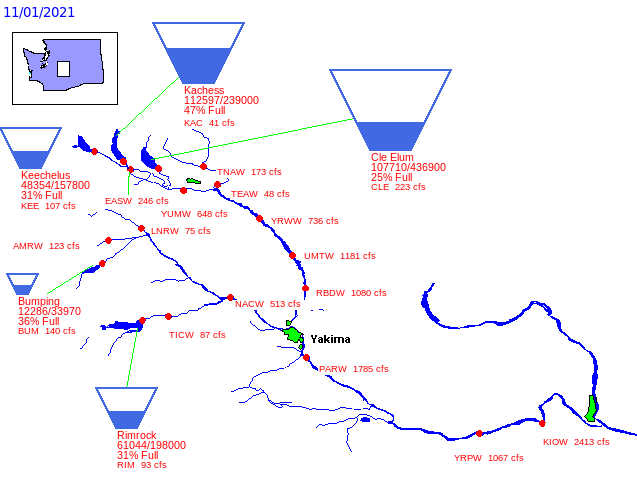
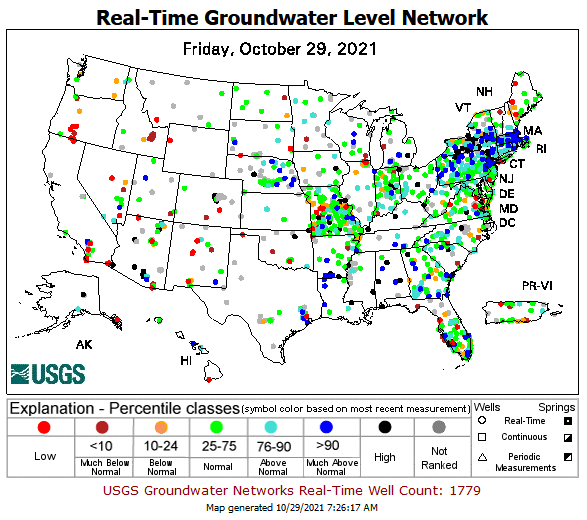
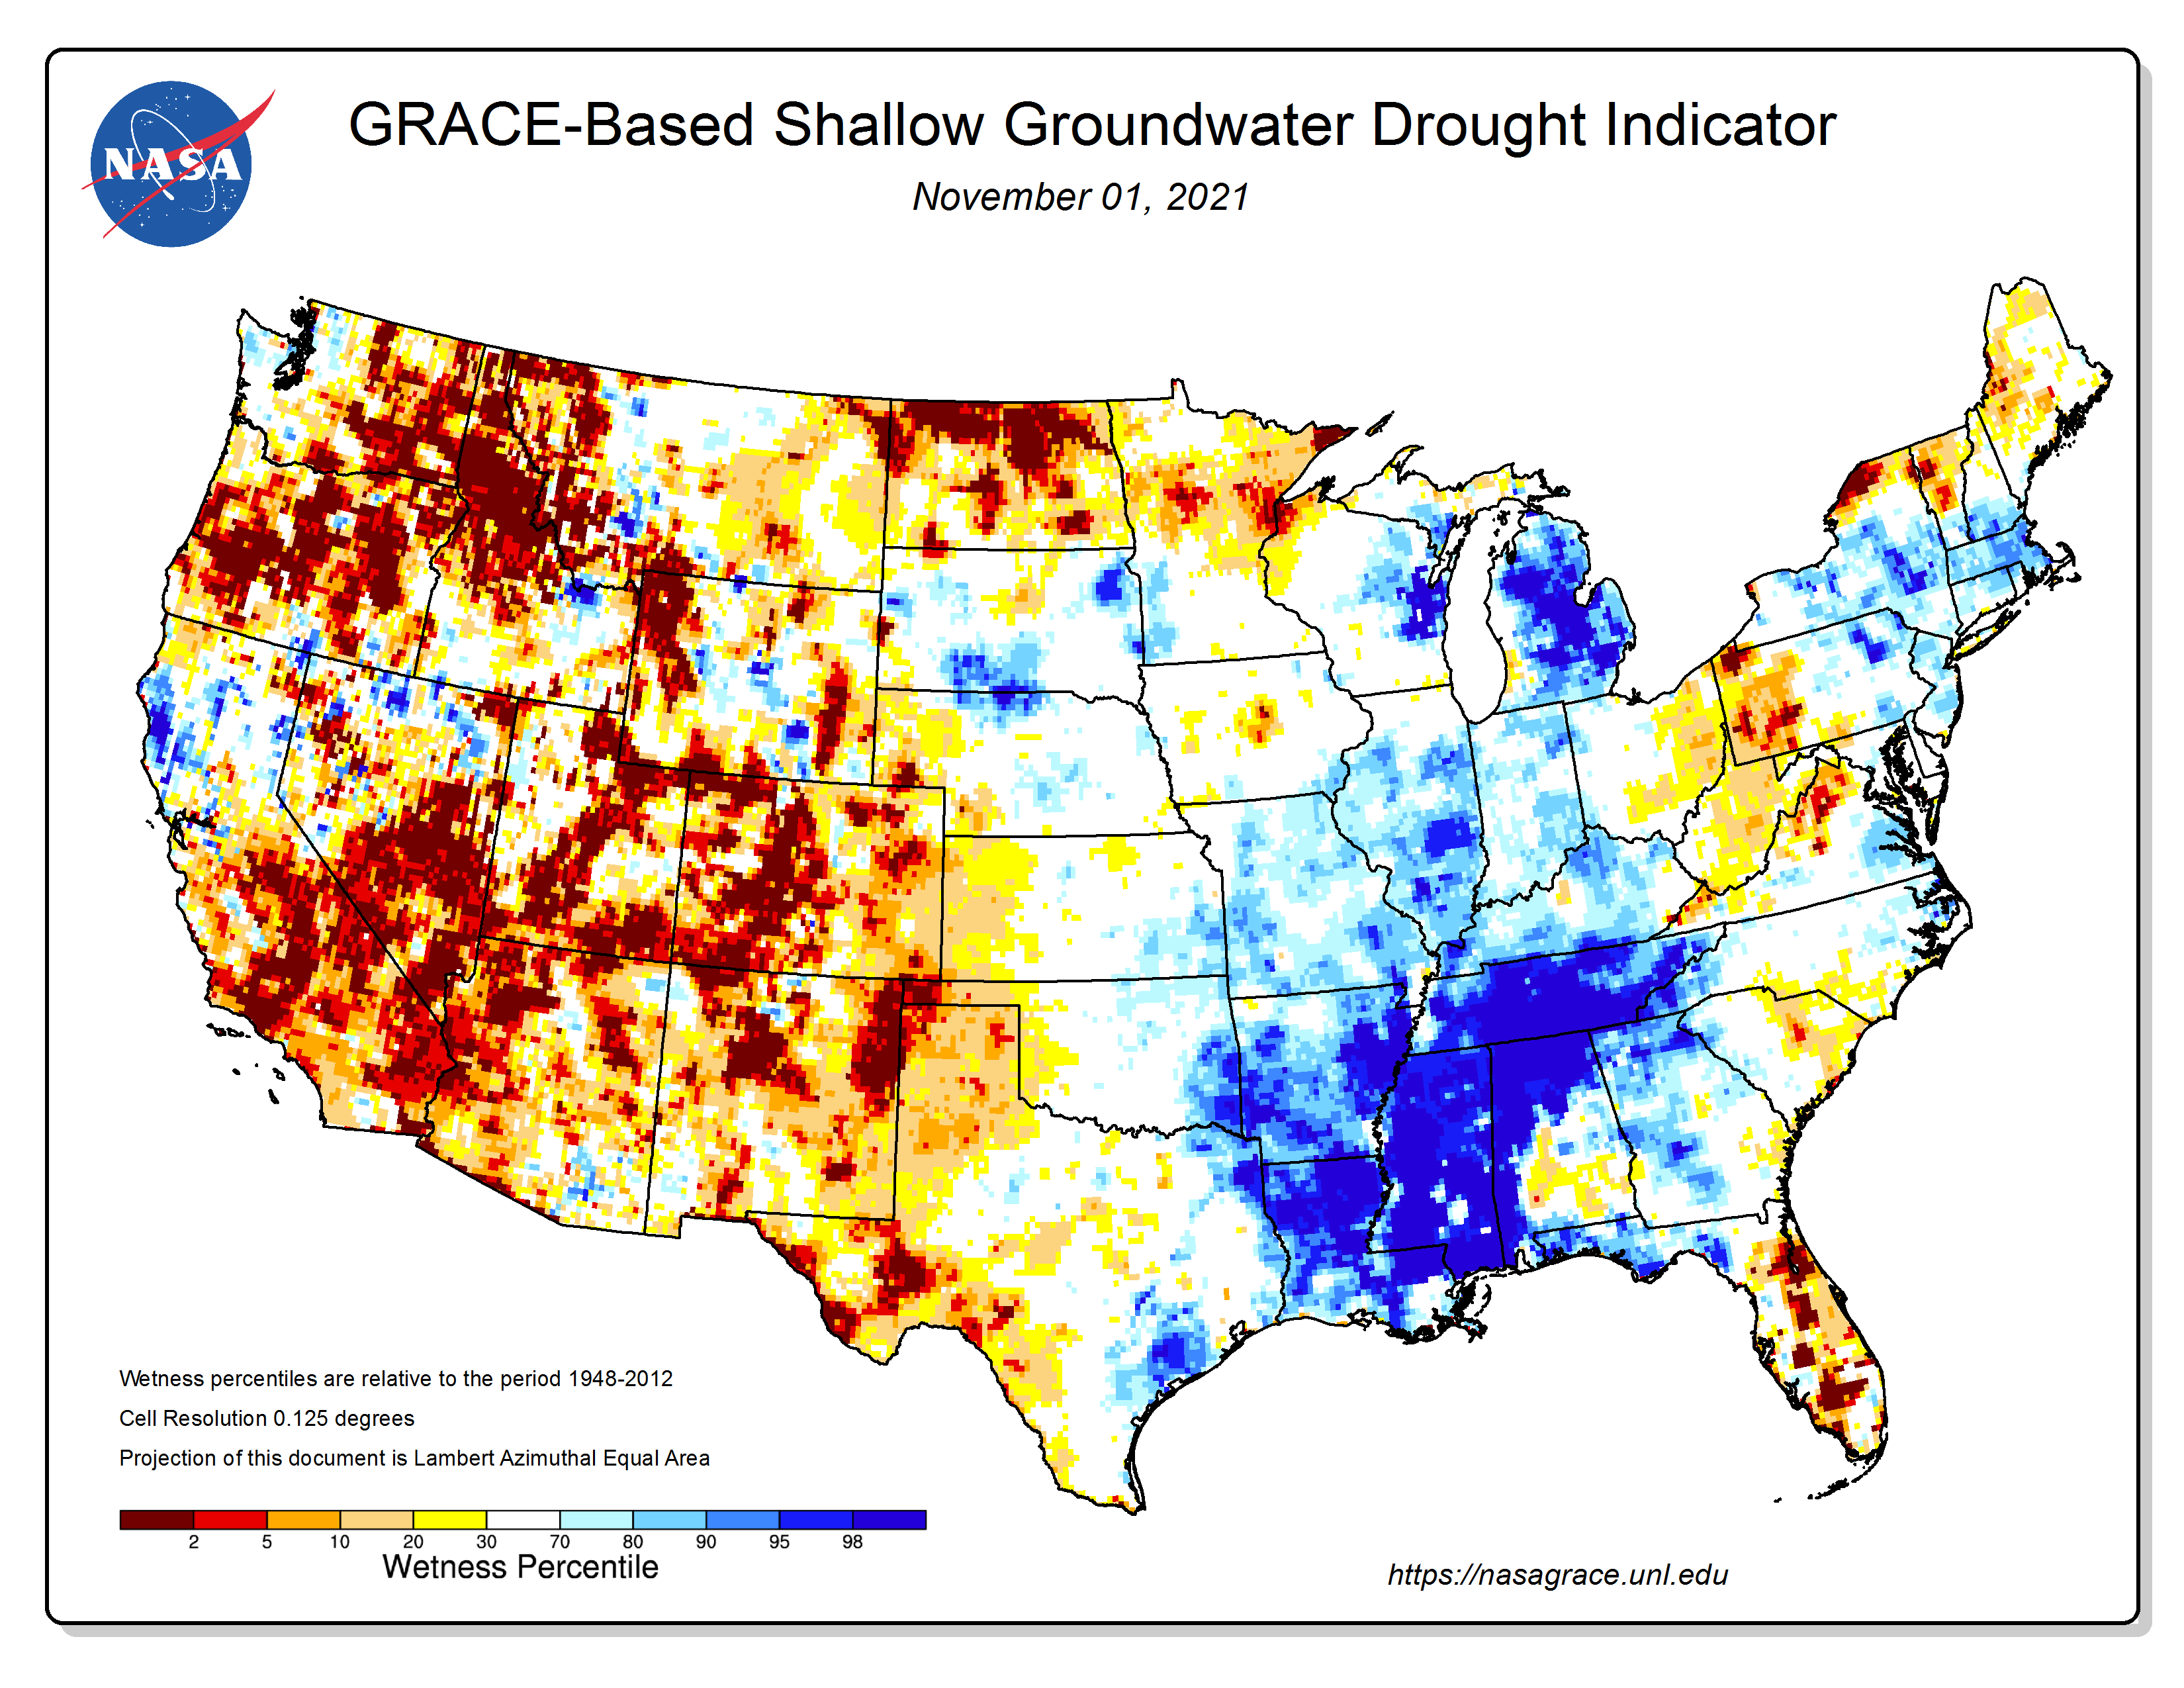
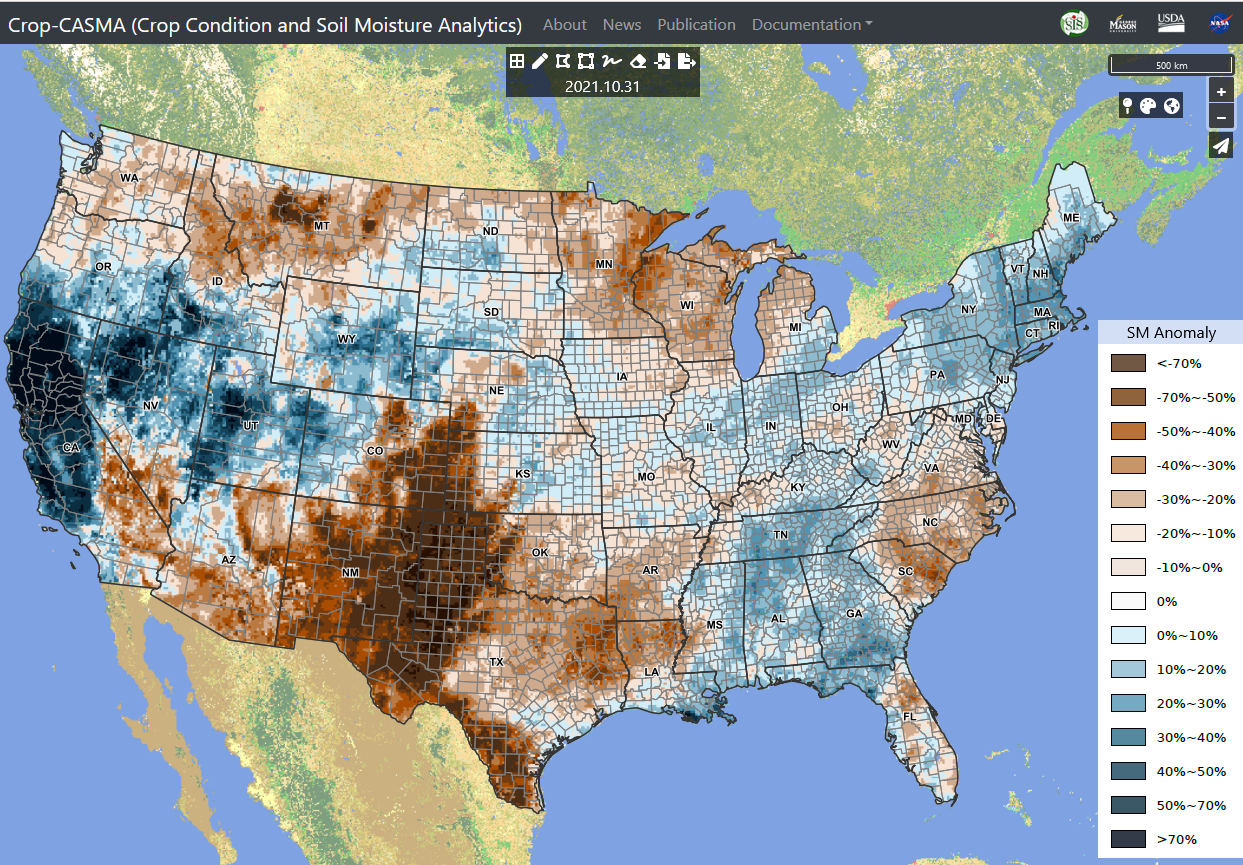
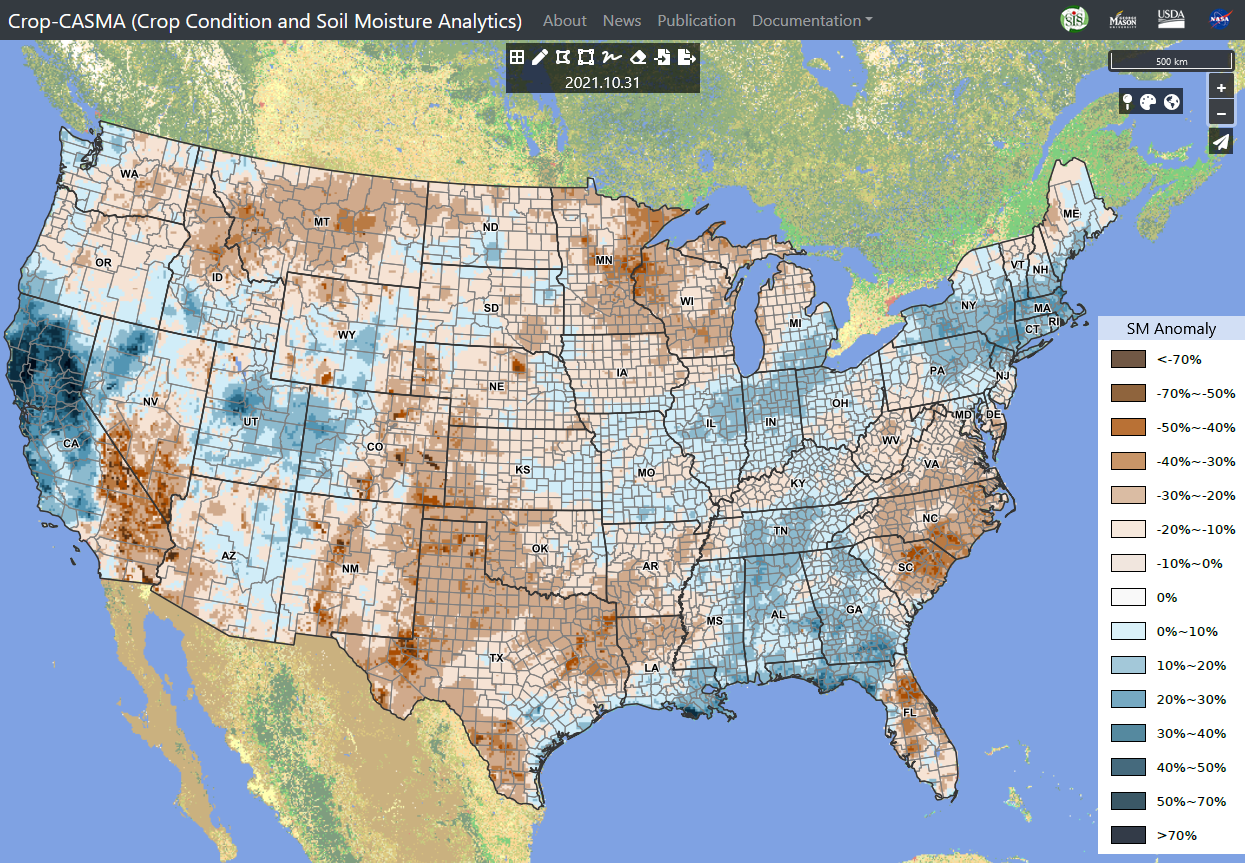
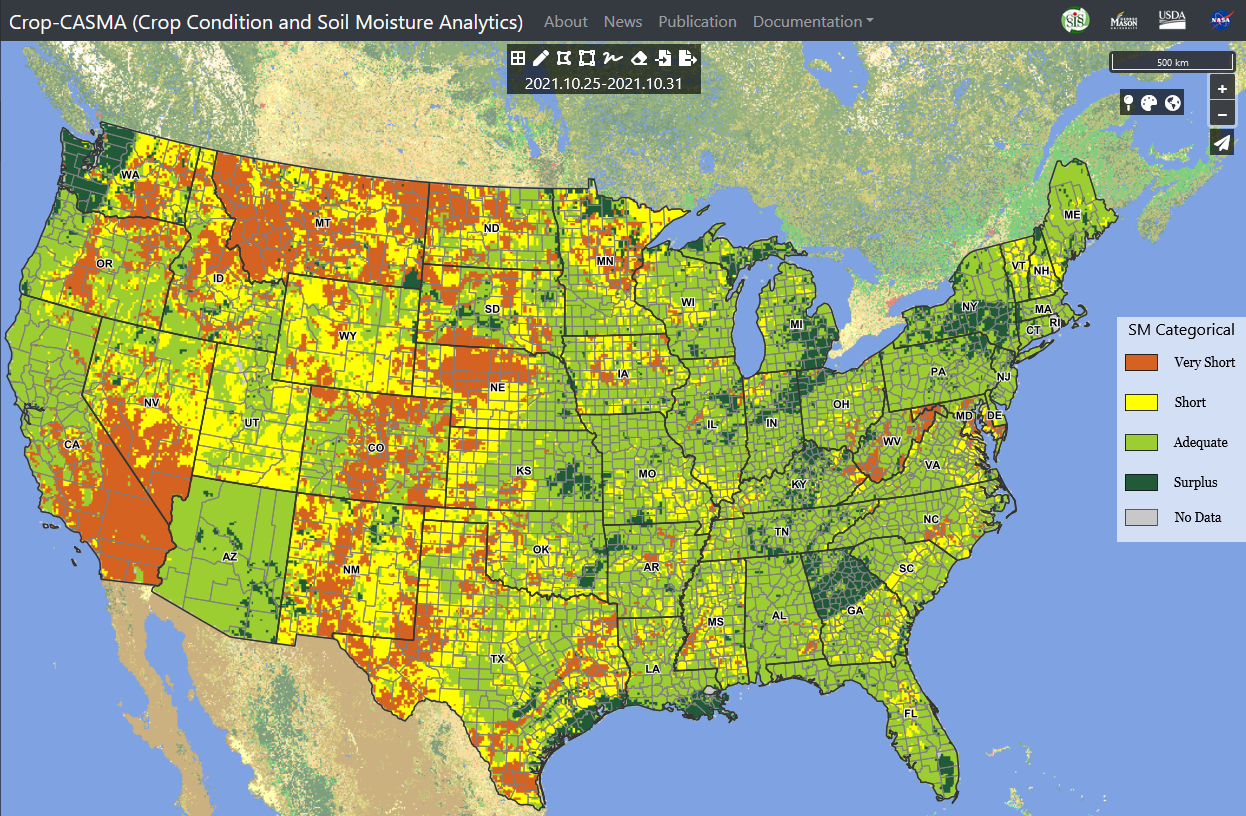
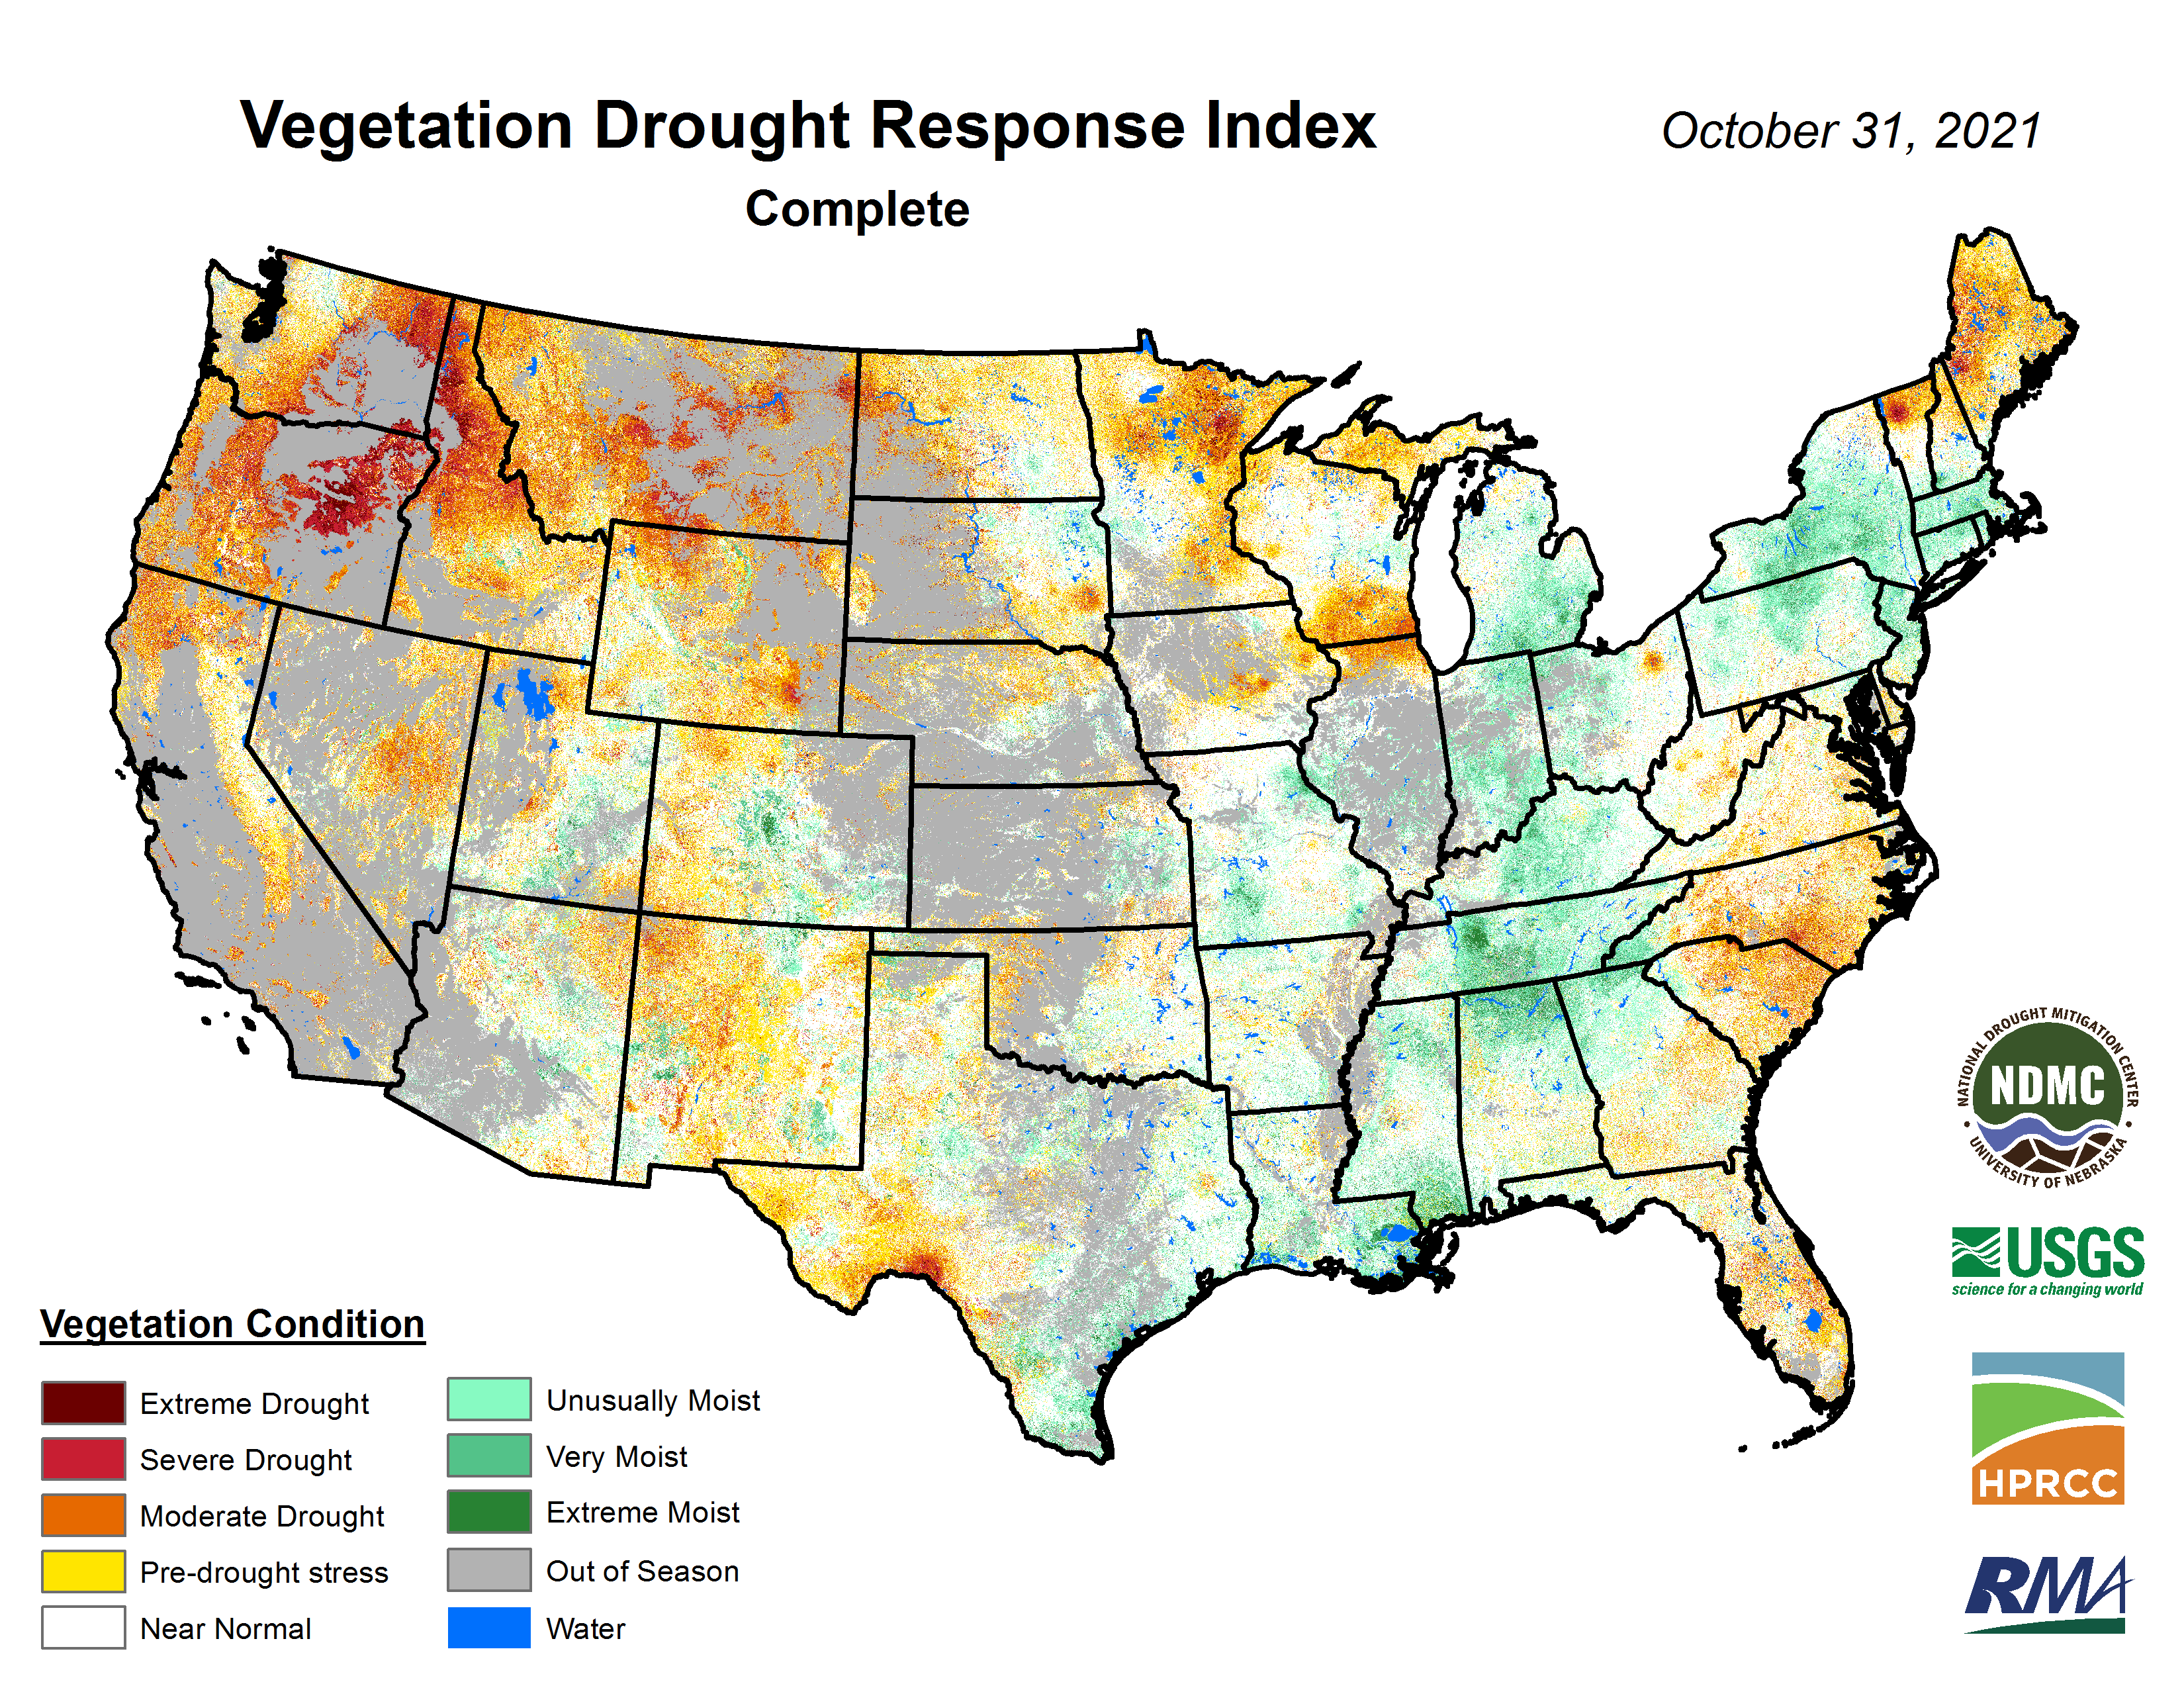
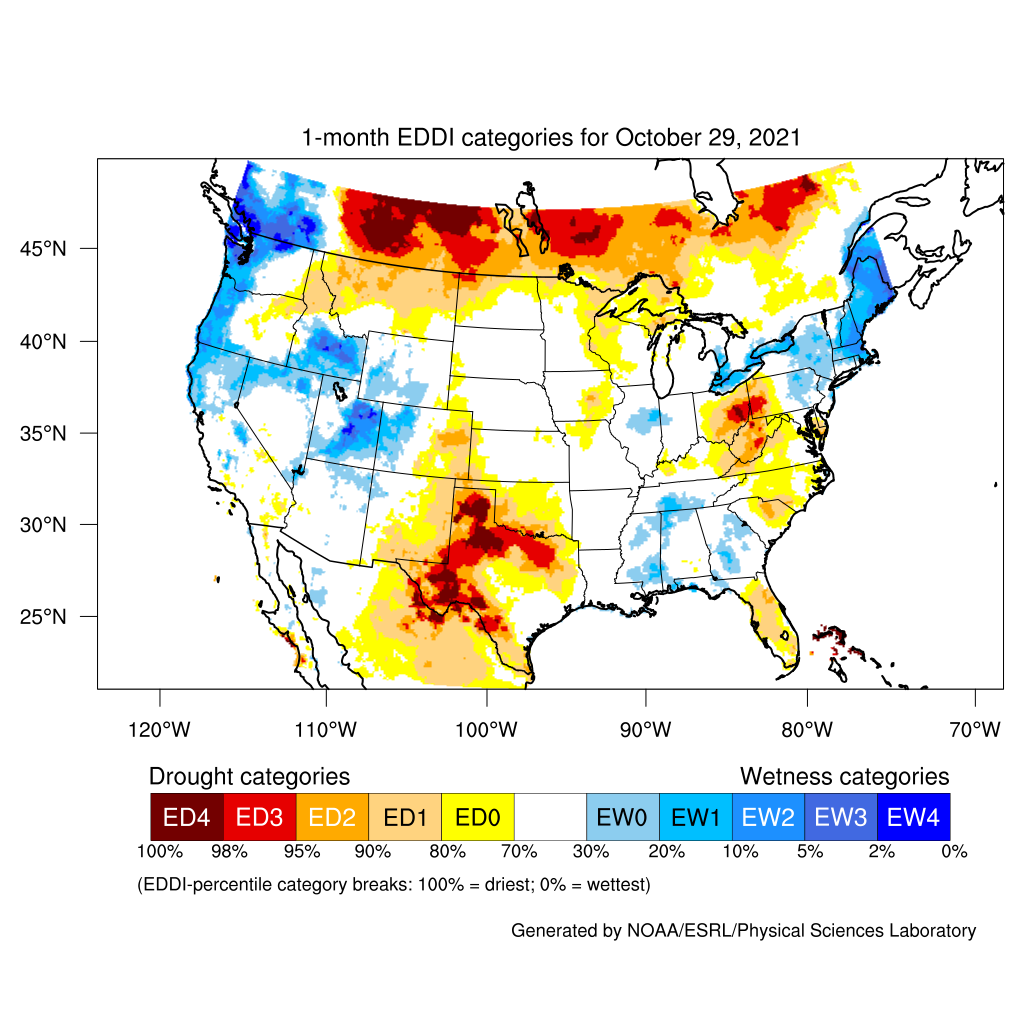
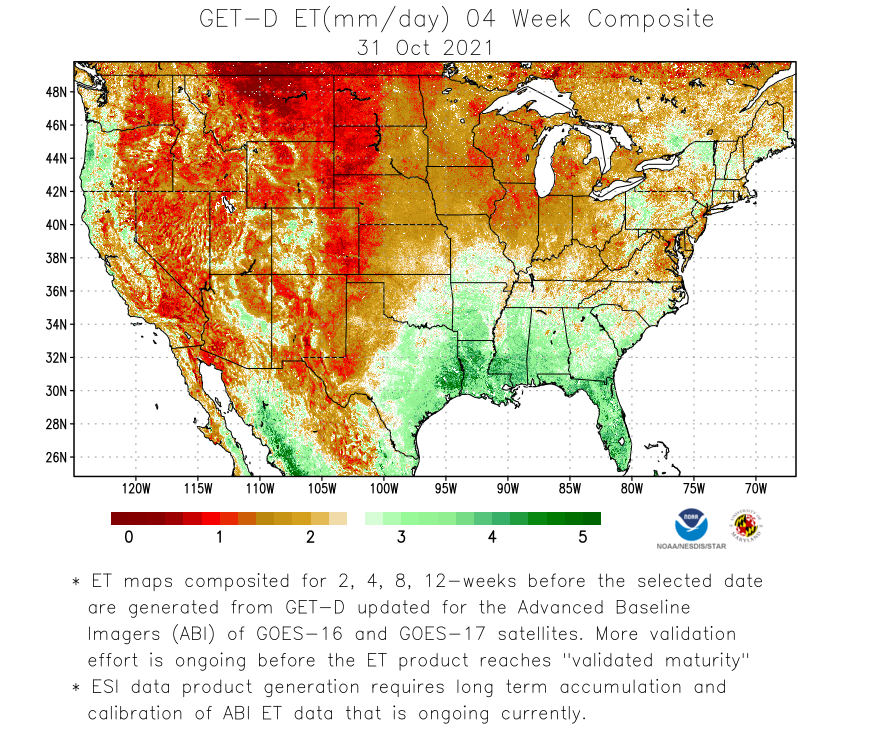
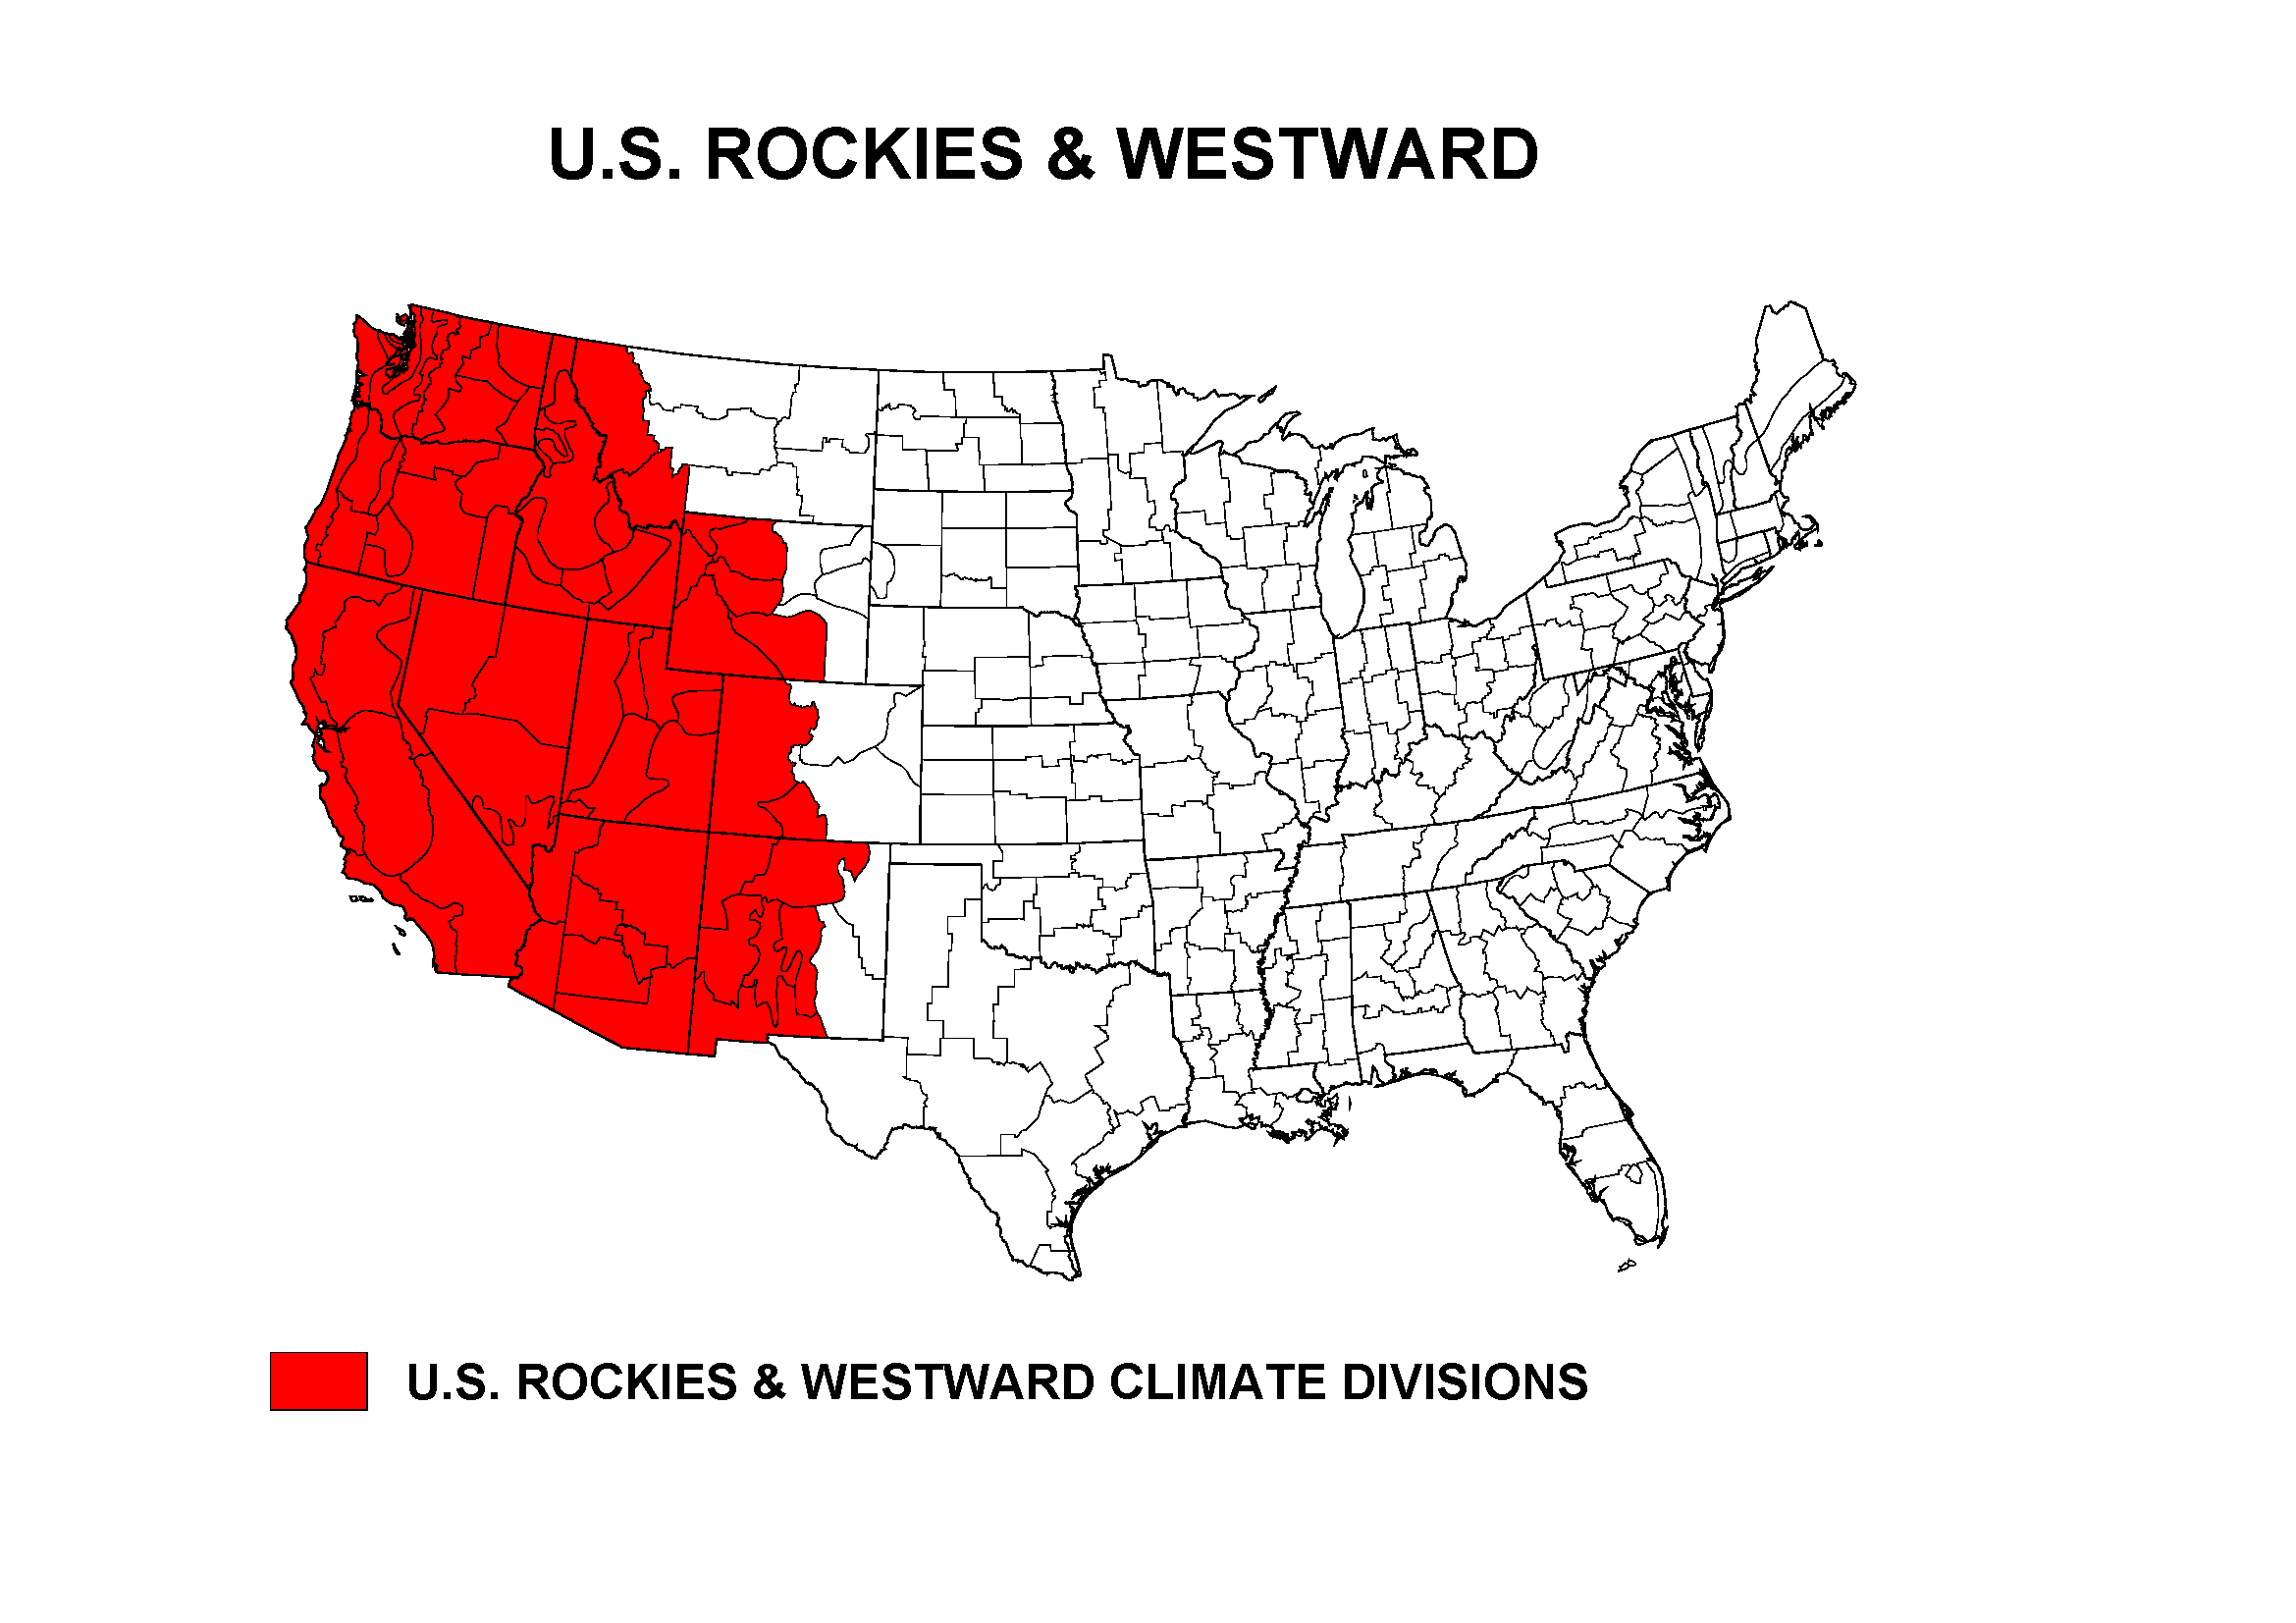
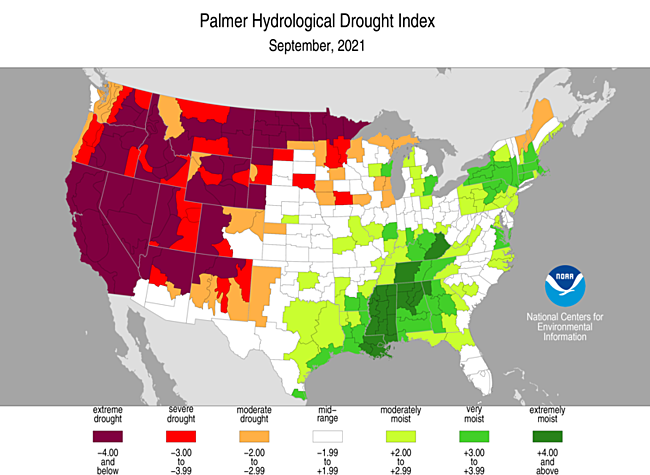
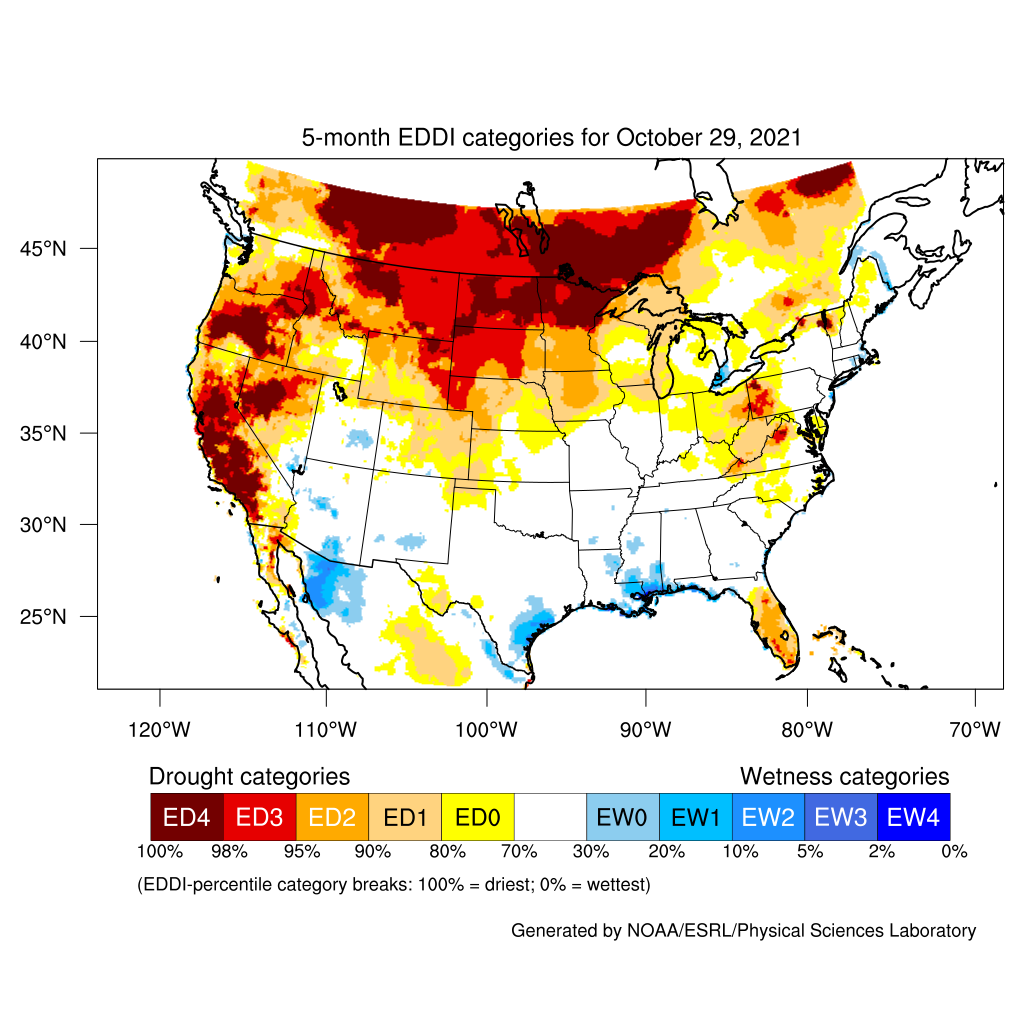
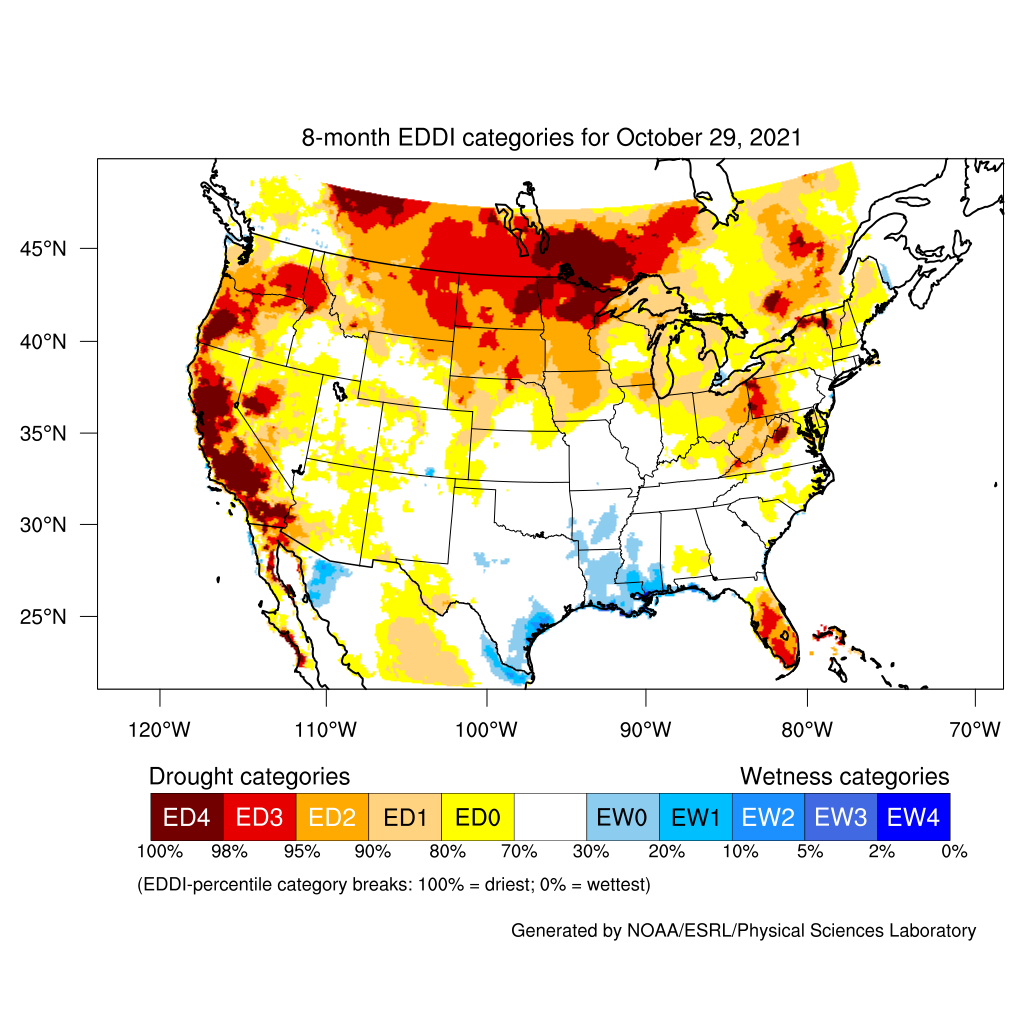
- Moderate (D1) to extreme (D3) drought extended from the West Coast to Rocky Mountains and into the adjacent northern Plains, with a large areas of exceptional (D4) drought. An "atmospheric river" event near the end of the month brought several inches of heavy precipitation across northern California and adjacent parts of the Great Basin and Pacific Northwest, which improved monthly streamflow and end-of-month soil moisture and vegetation indicators in these areas. But long-term drought indicators such as reservoir levels continued low (end-of-October reservoir levels in California, Idaho [maps 1, 2, 3], Oregon [maps 1, 2, 3, 4, 5], Washington). Elsewhere in the West, the severity and expanse of the drought was reflected in low streamflow (USGS), groundwater (USGS, GRACE), spring water (USGS), and reservoir (westwide map, statewide averages) levels; dry soils (CPC, NLDAS, USDA/NASS, SMOS, GRACE root zone and surface, SPoRT [0-10 cm (0-4 inches) depth, 0-40 cm (0-16 inches) depth, 0-100 cm (0-39 inches) depth, 0-200 cm (0-79 inches) depth], CropCASMA [topsoil and subsoil anomalies, topsoil and subsoil categorical]); parched vegetation (QuickDRI, VegDRI, VHI, stressed vegetation, drought-risk vegetation, USDA pasture and range condition); and high evapotranspiration (EDDI, ESI). Rain from the Pacific fronts and atmospheric river helped reduce the number of large wildfires, especially near the end of the month (wildfire maps for October 1, 11, 17, 21, 25, 31). The percent area of the West experiencing moderate to exceptional drought, according to USDM statistics, hovered around 90 percent, increasing slightly from 89.6 percent at the end of September to 90.4 percent at the end of October. The percent area of the West (from the Rockies to the West Coast) in moderate to extreme drought (based on the Palmer Drought Index) fell sharply in response to the atmospheric river precipitation, with a value of 64.9 percent at the end of October 2021. The Palmer Hydrological Drought Index (PHDI), based on data integrated across the West, reached near-record dry levels in July 2021, exceeded only by the drought of 1976-77. The Western U.S. PHDI improved in 2021 as summer monsoon rains and October precipitation entered into the equation.
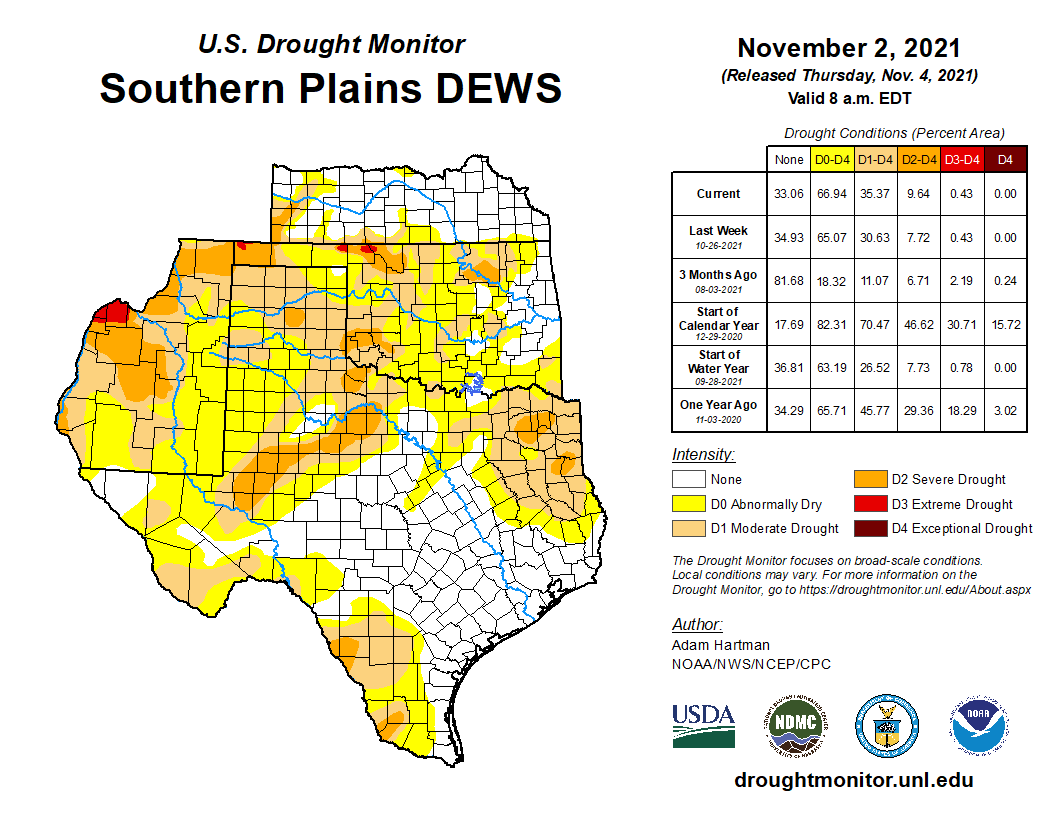
- Drought contracted or reduced in intensity in northern and eastern parts of the central to northern Plains as well as the southern Plains, but expanded or increased in intensity in western and southern parts. The moderate to exceptional drought area contracted from 63.6 percent of the central and northern Plains at the end of September to 59.0 percent at the end of October, with exceptional drought ending; most of the expansion occurred in the high plains of Colorado. In the southern Plains, moderate to extreme drought grew from 26.5 percent at the end of September to 35.4 percent at the end of October. Most of the expansion occurred in Texas while most of the contraction occurred in eastern Oklahoma. Some of the expansion and contraction spread into the Lower Mississippi Valley states (Arkansas and Louisiana). The drought conditions were reflected in low streamflow and groundwater levels, dry soils, high evapotranspiration, and stressed vegetation.
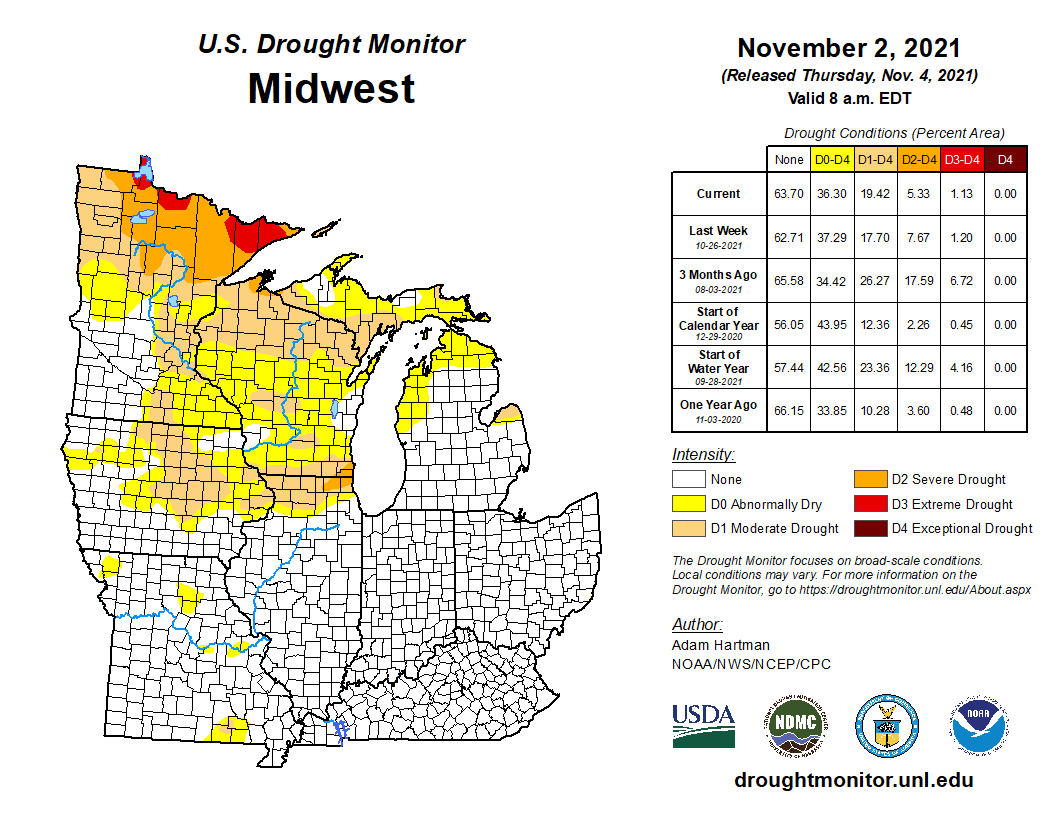
- Drought expanded in some parts of the Midwest and contracted in others. Overall, the moderate to extreme drought area contracted from 23.4 percent at the end of September to 19.4 percent at the end of October. The worst drought areas were in the western Great Lakes and Upper Mississippi Valley.
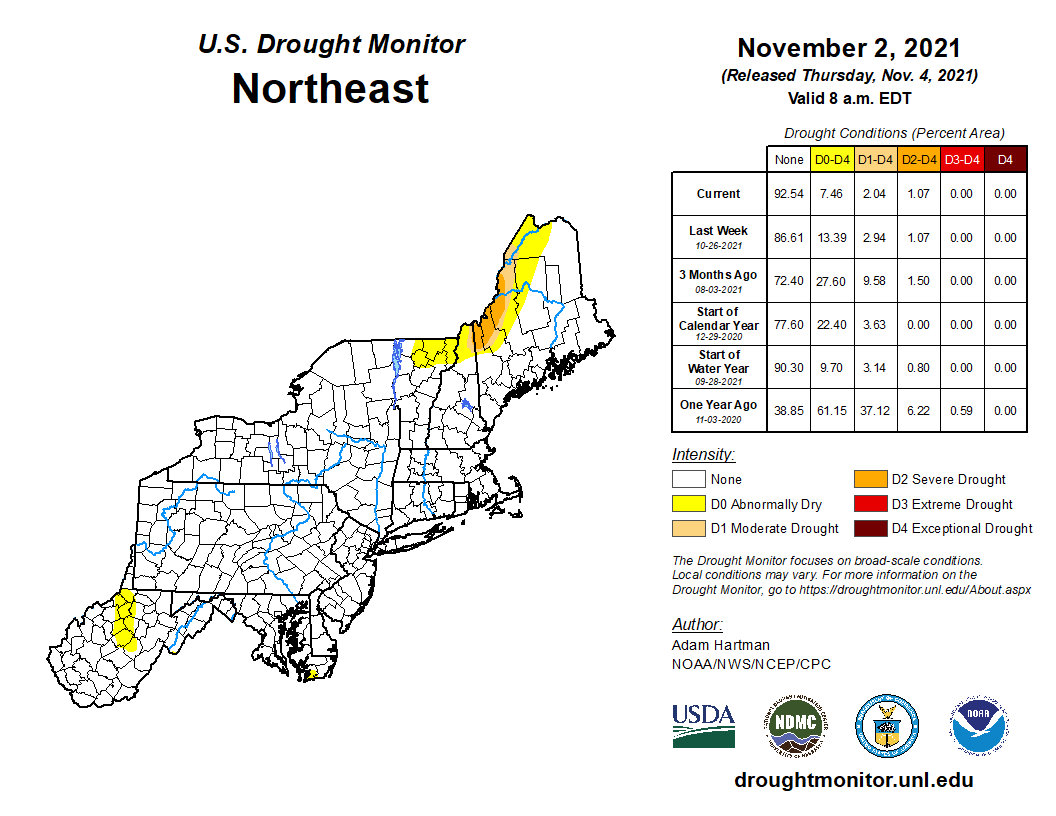
- Moderate to severe drought contracted in the Northeast, shrinking from 3.1 percent at the end of September to 2.0 percent at the end of October. What little drought remained was in northern Maine and New Hampshire.
- In the Southeast, moderate drought redeveloped in the Carolinas and adjacent Virginia, and abnormal dryness expanded. The drought and abnormal dryness area increased from 2.5 percent (abnormally dry) at the end of September to 20.9 percent (moderate drought and abnormally dry) at the end of October.
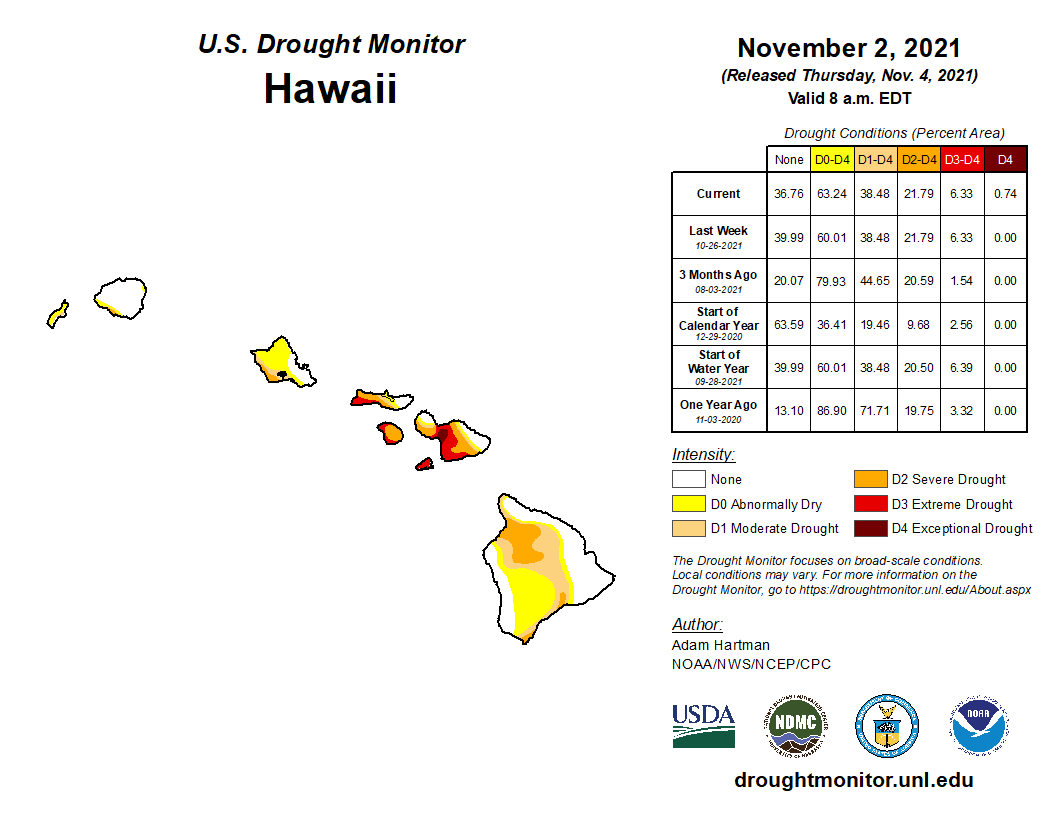
- In Hawaii, exceptional drought developed on Maui but the overall drought footprint continued at 38.5 percent at the end of October.
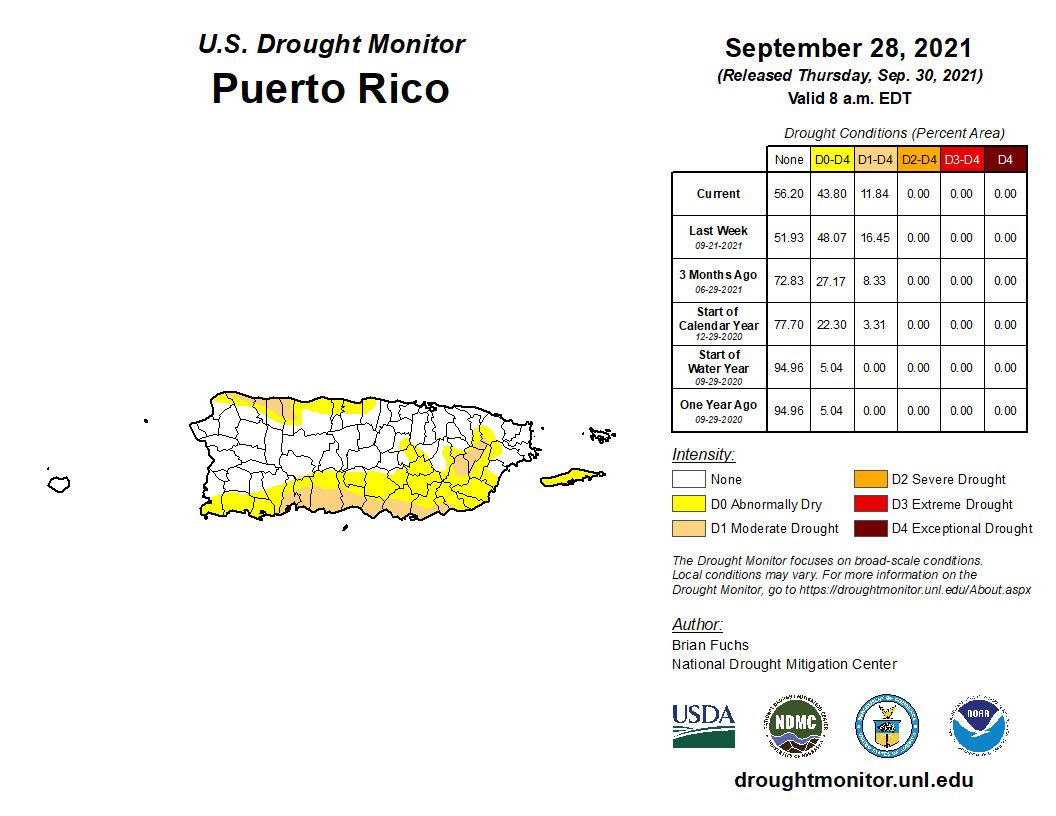
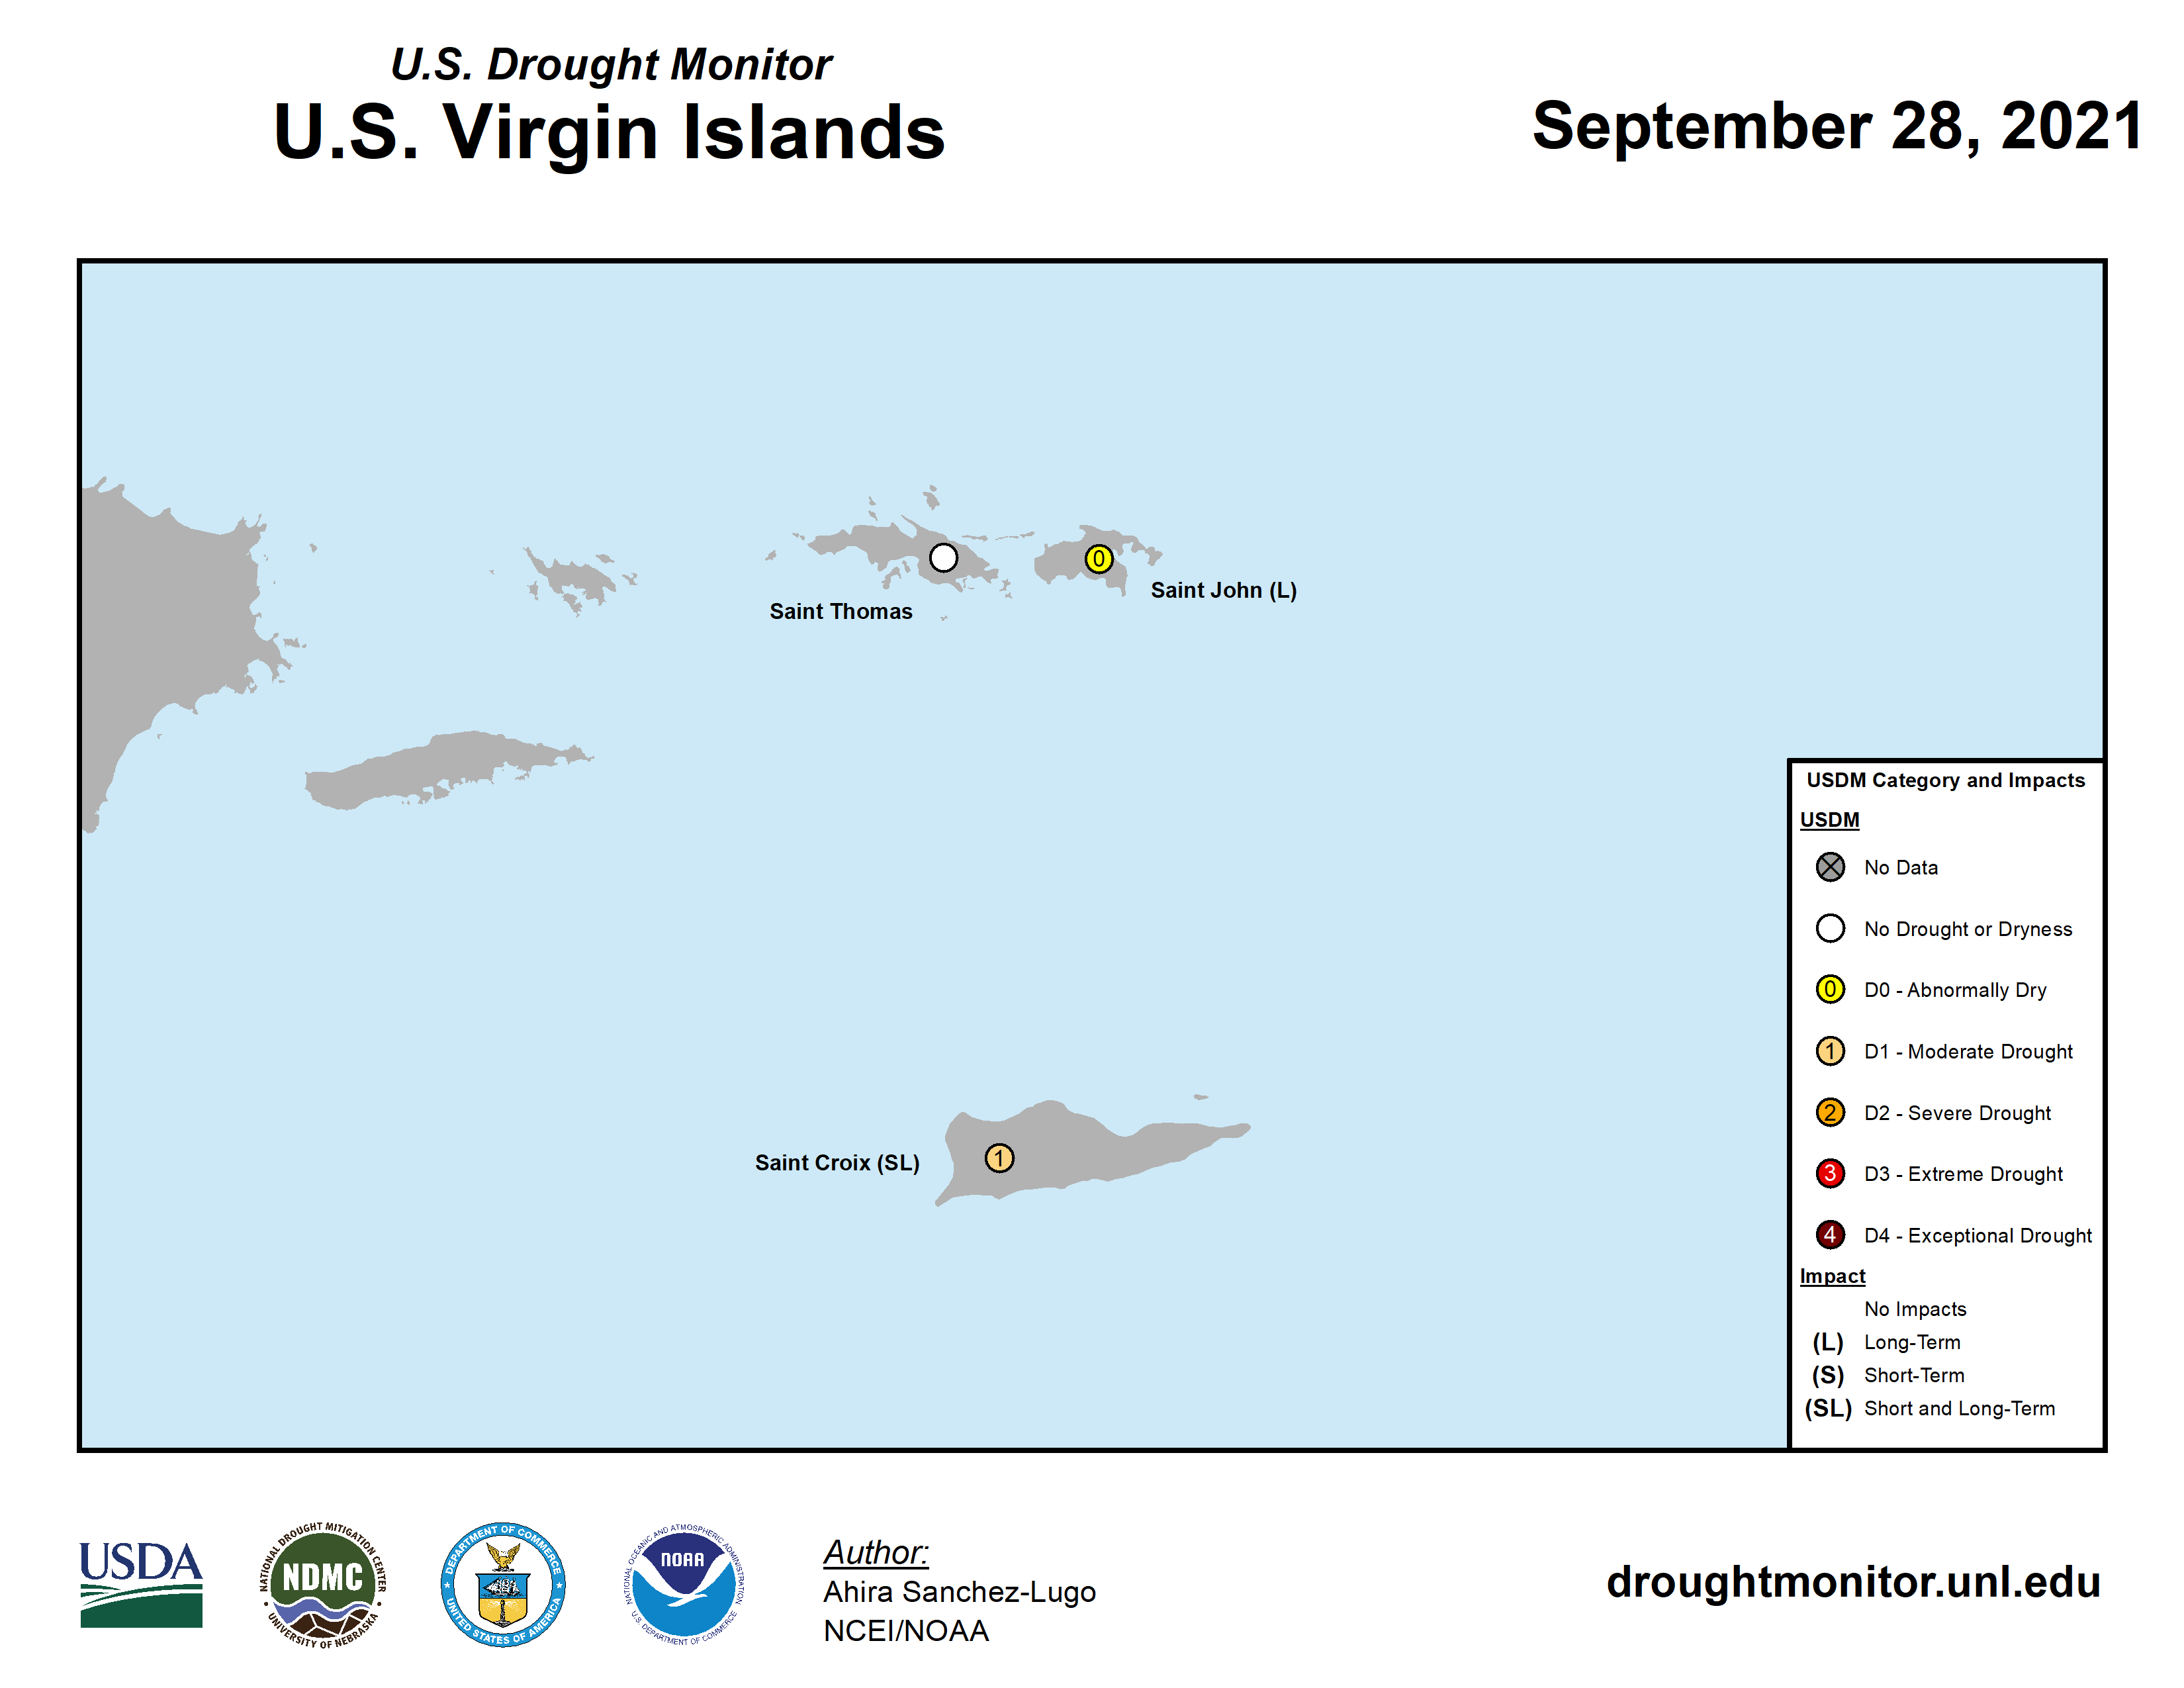
- In the Caribbean, moderate drought shrank from 11.8 percent of Puerto Rico at the end of September to 1.8 percent at the end of October. In the U.S. Virgin Islands (USVI), moderate drought continued in the south on St. Croix, while St. John improved compared to last month, becoming free of drought and abnormal dryness, and abnormal dryness developed on St. Thomas.
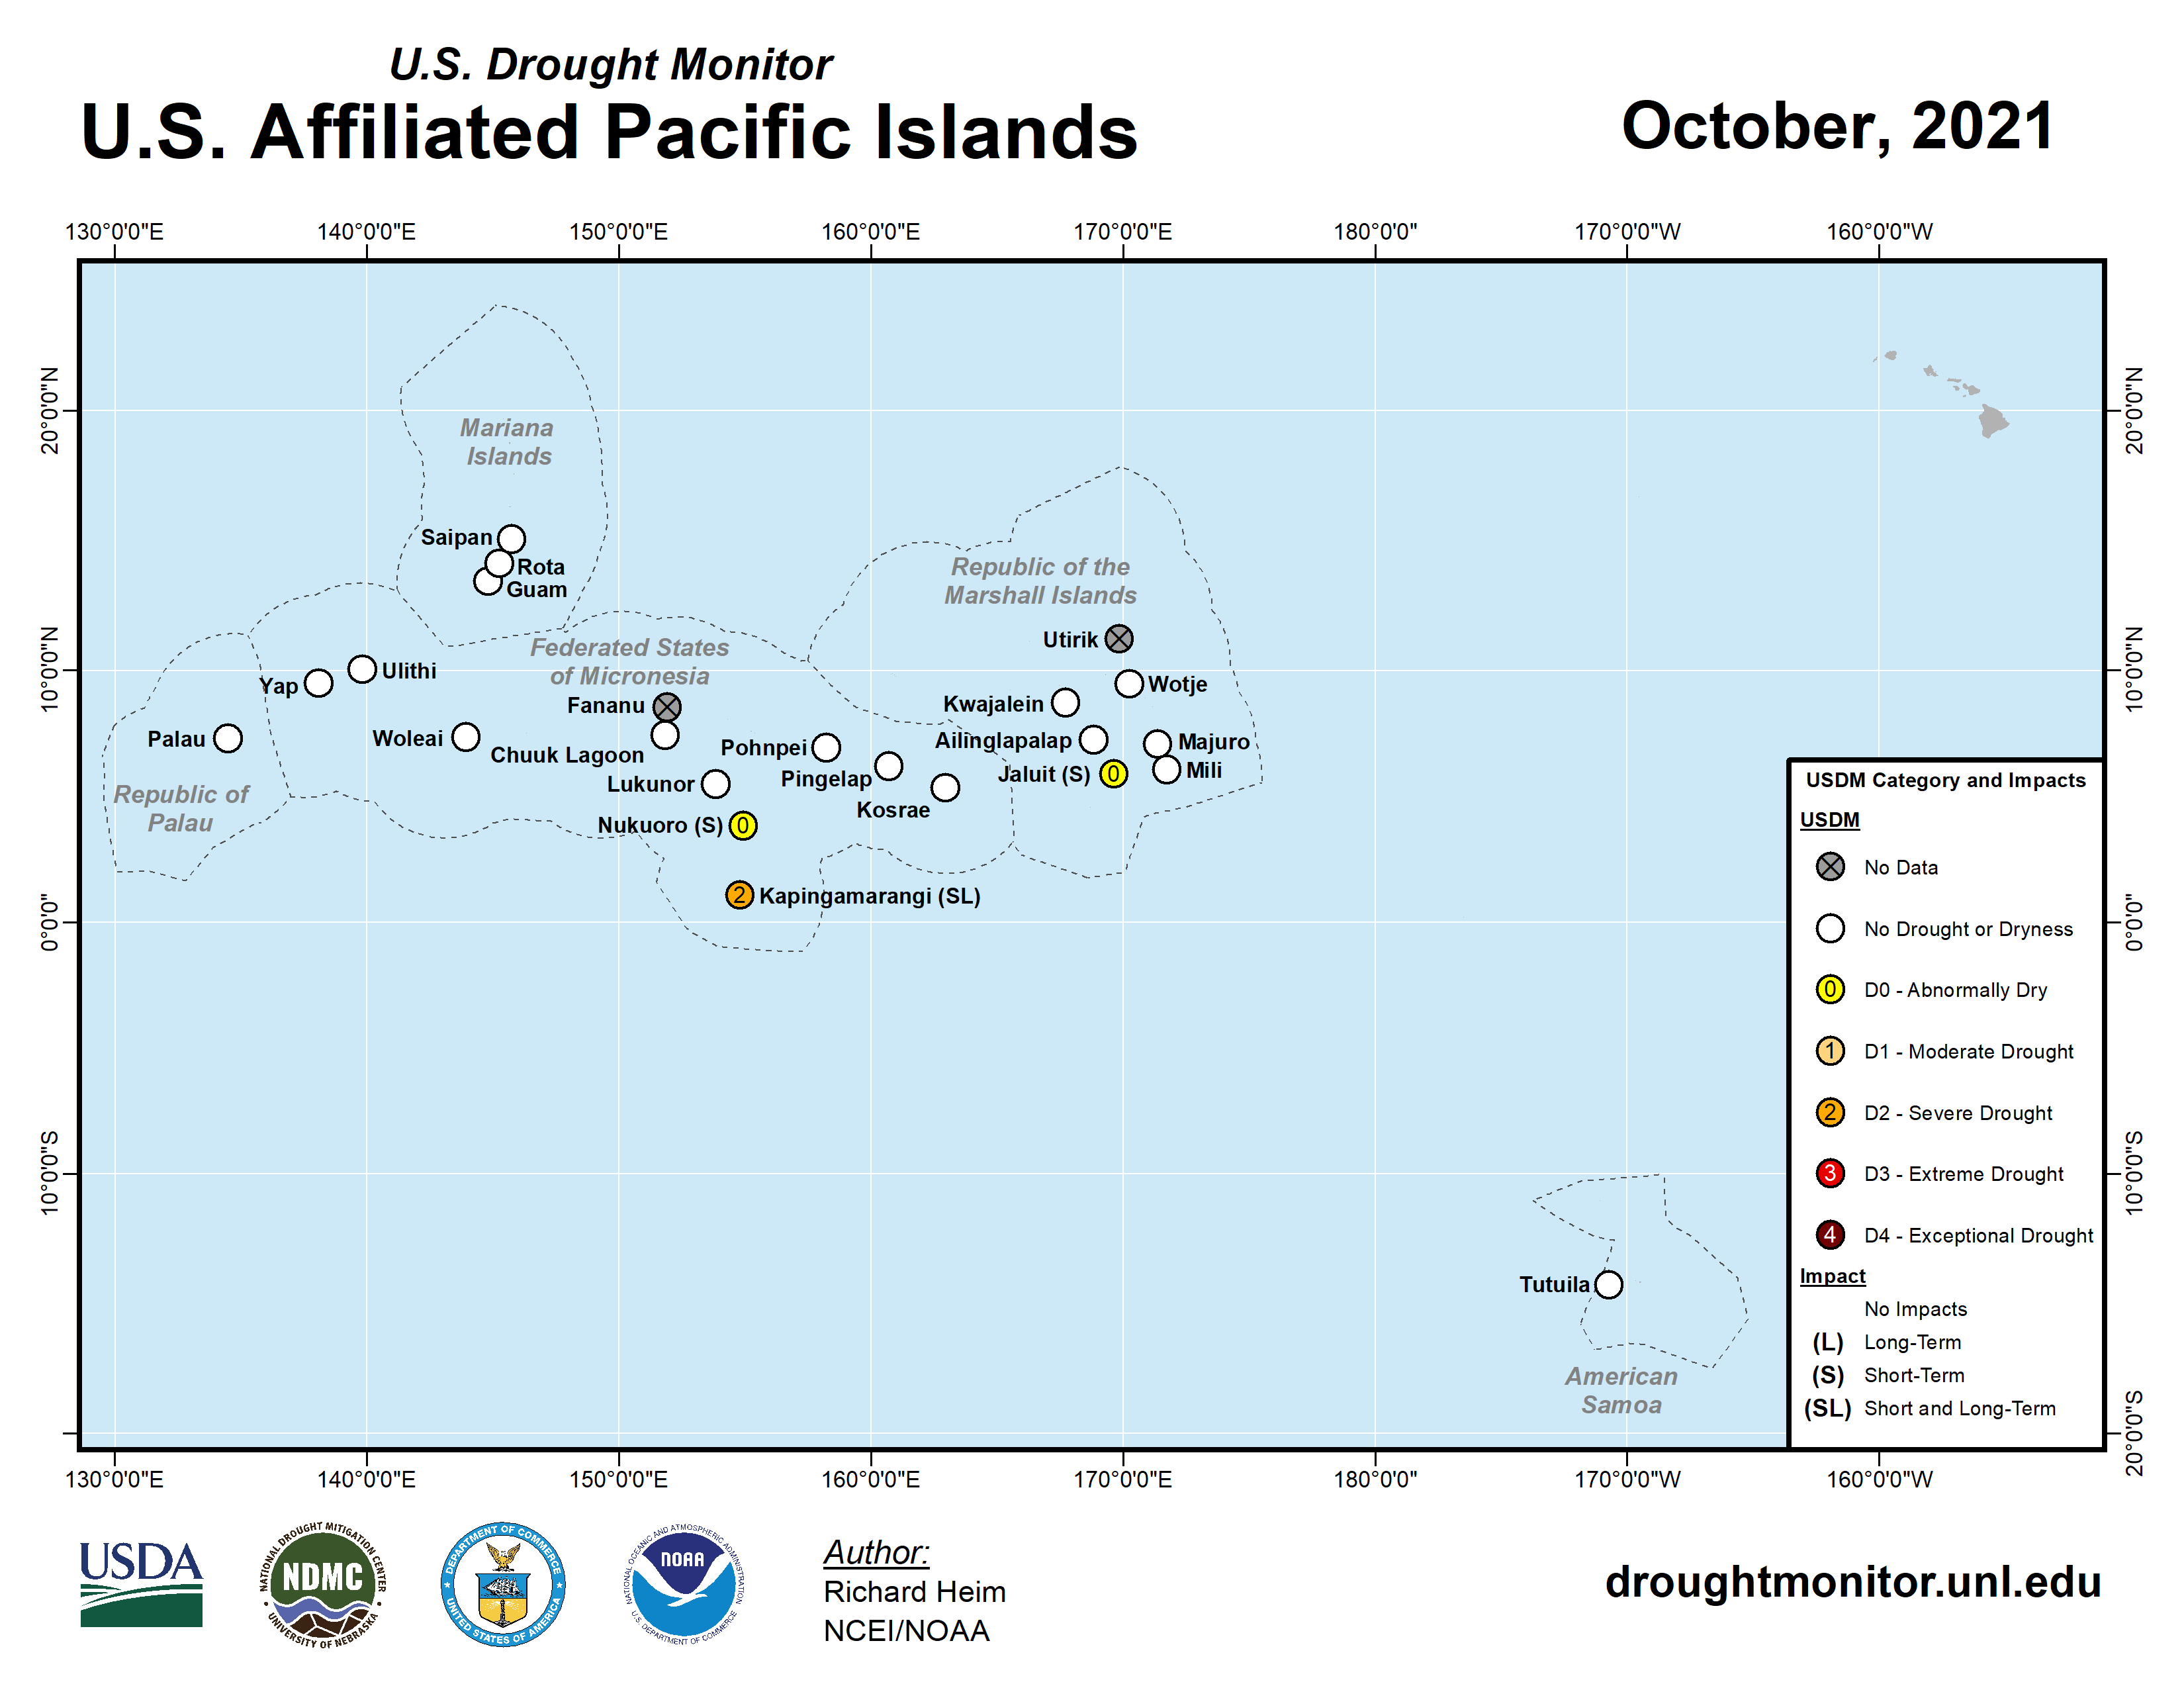
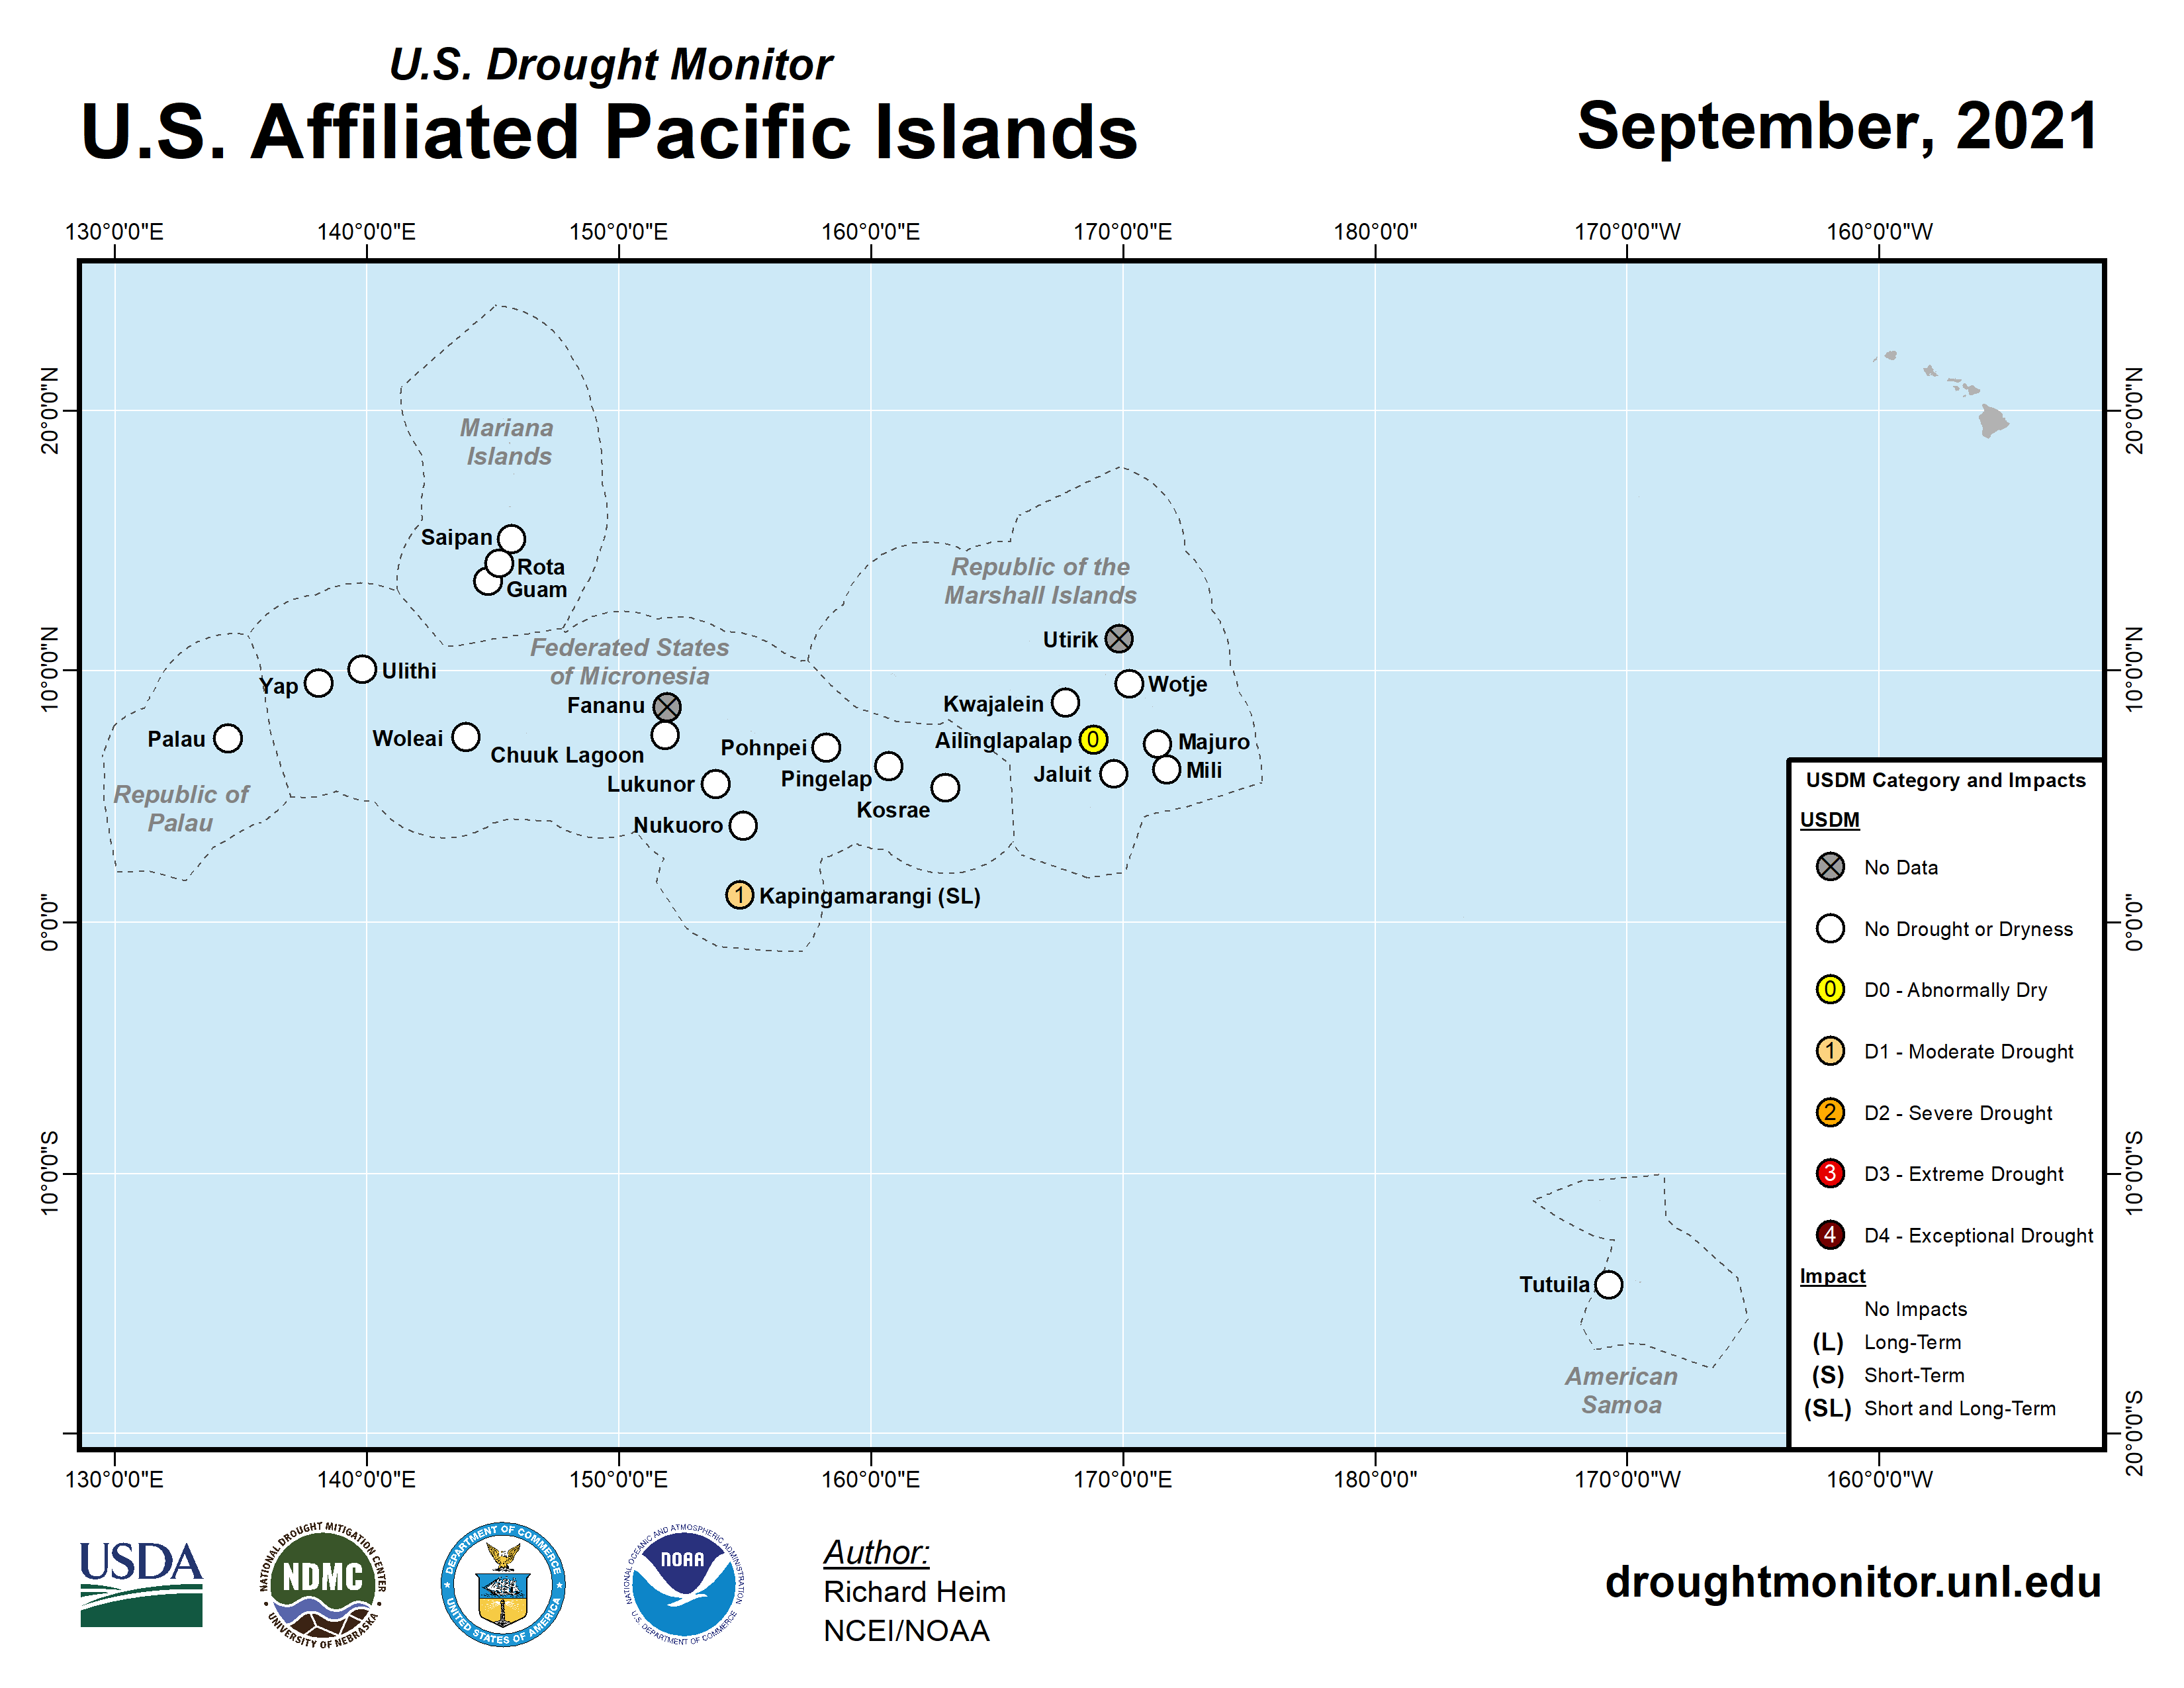
- In the U.S.-Affiliated Pacific Islands (USAPI), compared to last month, abnormal dryness disappeared from Ailinglaplap (in the Marshall Islands) but developed at Jaluit (Marshall Islands) and Nukuoro (in the Federated States of Micronesia), and moderate drought worsened to severe drought at Kapingamarangi (Federated States of Micronesia).
Palmer Drought Index
The Palmer drought indices measure the balance between moisture demand (evapotranspiration driven by temperature) and moisture supply (precipitation). The Palmer Z Index depicts moisture conditions for the current month, while the Palmer Hydrological Drought Index (PHDI) and Palmer Drought Severity Index (PDSI) depict the current month's cumulative moisture conditions integrated over the last several months.
While both the PDSI and PHDI indices show long-term moisture conditions, the PDSI depicts meteorological drought while the PHDI depicts hydrological drought. The PDSI map may show less severe and extensive drought (as well as wet spell conditions) in some parts of the country than the PHDI map because the meteorological conditions that produce drought and wet spell conditions are not as long-lasting as the hydrological impacts.
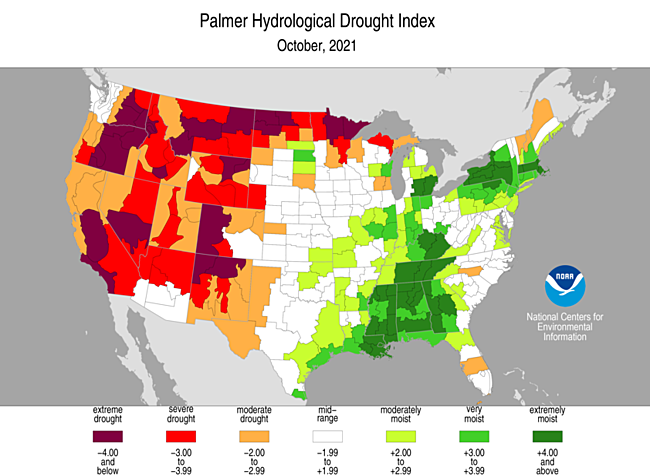
Used together, the Palmer Z Index and PHDI maps show that short-term drought occurred in parts of the Southwest to adjacent southern Plains, Montana, Maine, the Carolinas, Upper Michigan, and Florida. In these areas, long-term drought continued, intensified, or expanded (PHDI maps for October compared to September). Short-term wet conditions across much of the West, northern Plains, and Midwest contracted or decreased the intensity of long-term drought, while short-term wet conditions in the Southeast, Ohio Valley, and Northeast led to expansion or intensification of long-term wet conditions.
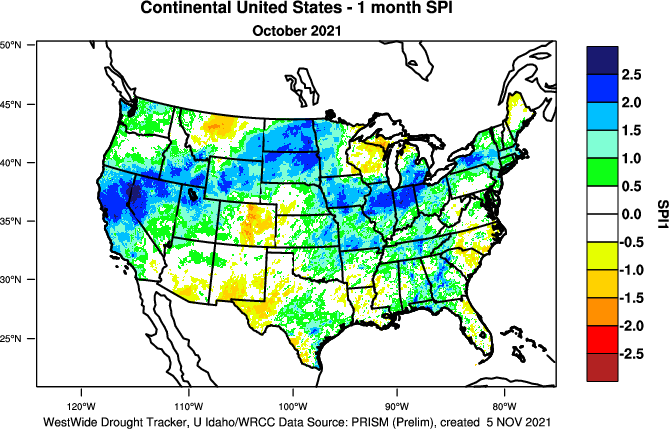
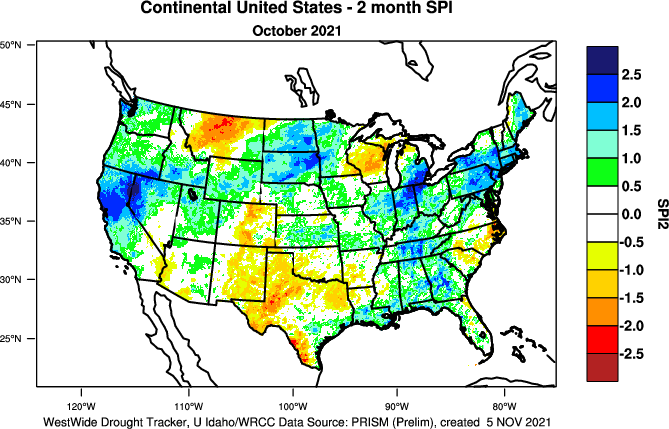
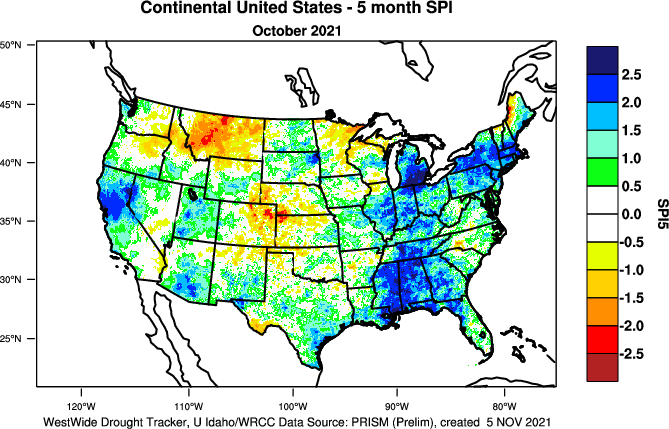
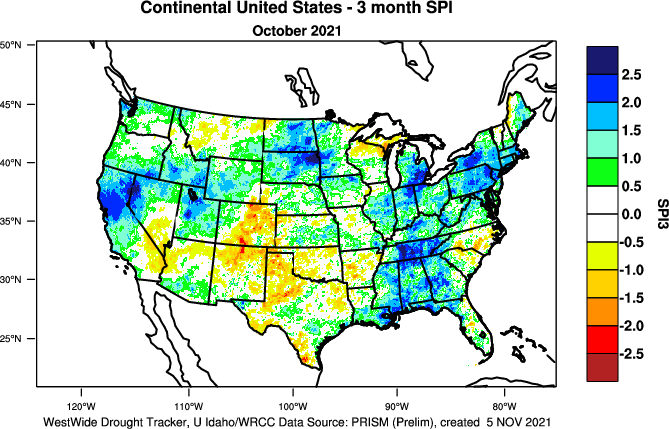
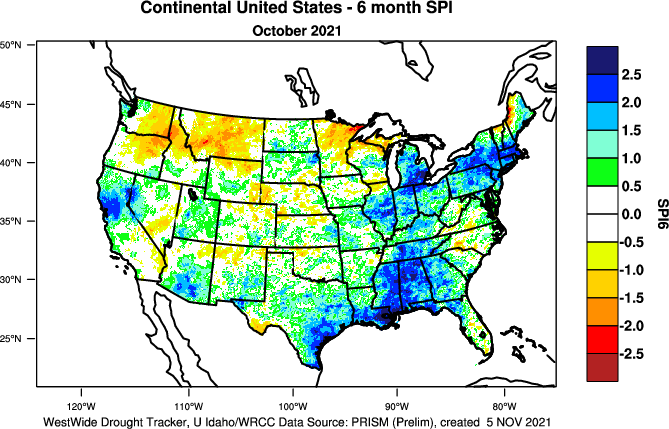
Standardized Precipitation Index
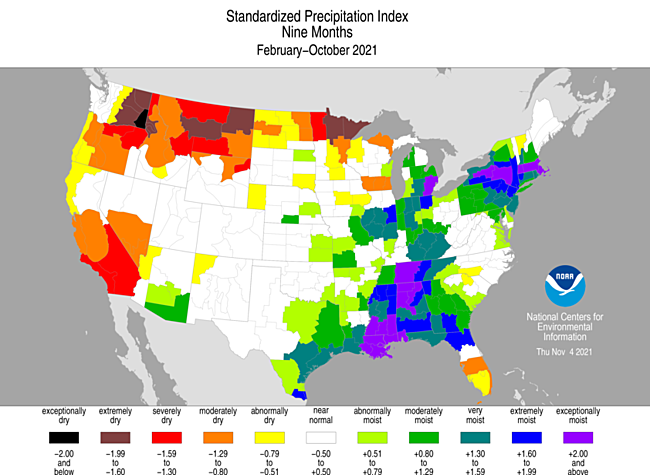
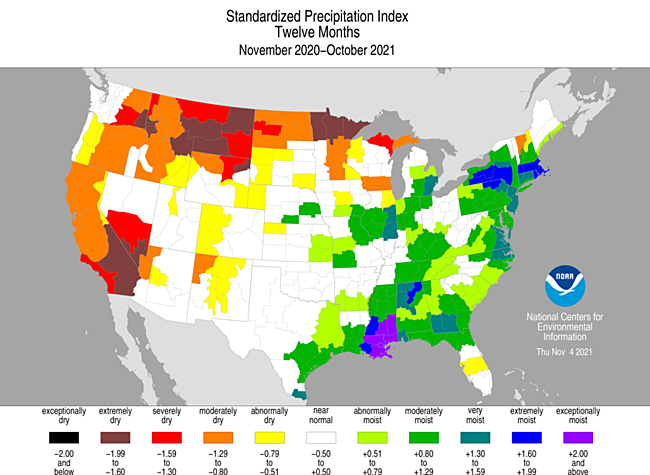
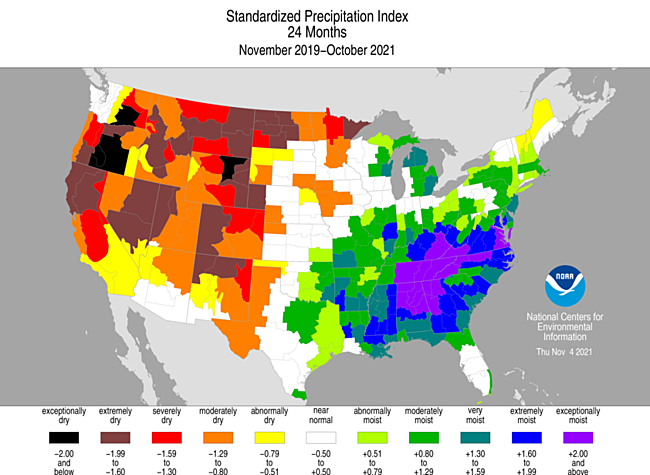
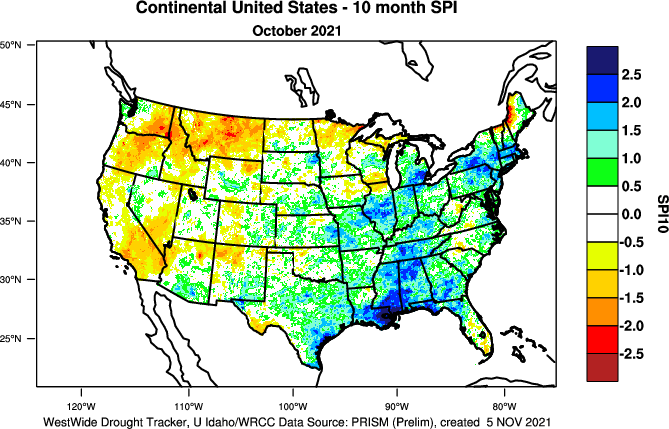
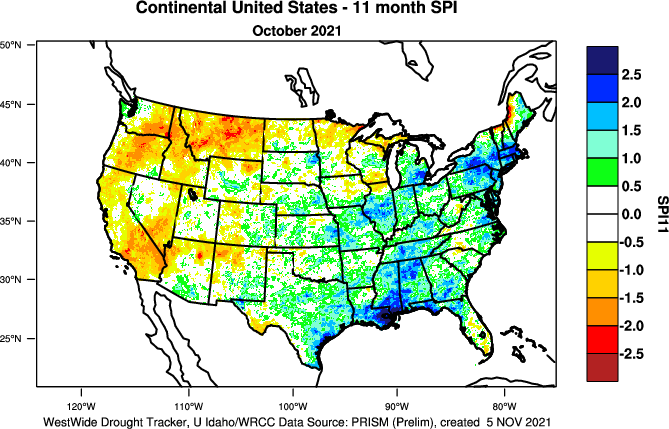
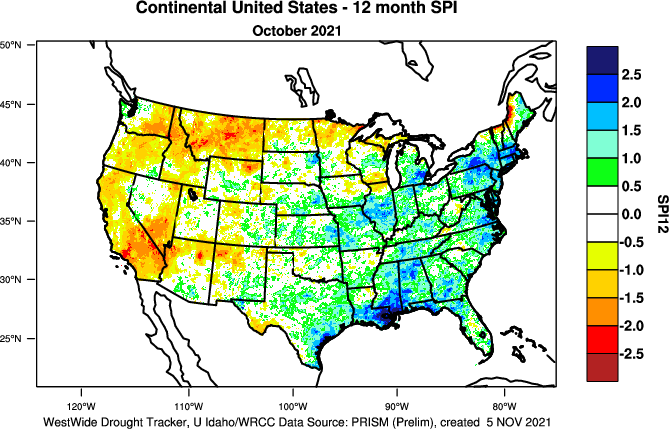
The Standardized Precipitation Index (SPI) measures moisture supply. The SPI maps here show the spatial extent of anomalously wet and dry areas at time scales ranging from 1 month to 24 months.
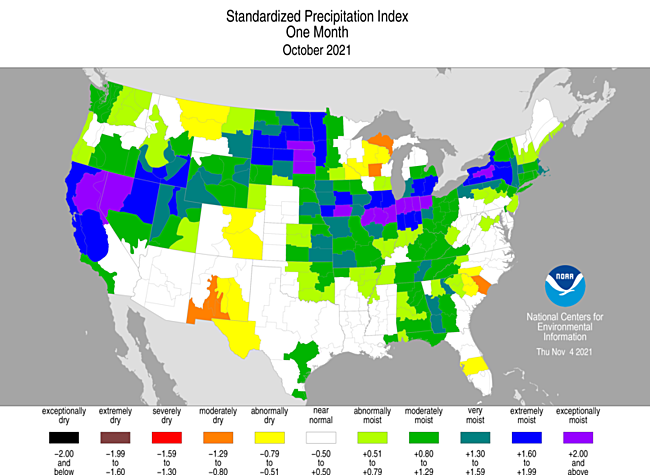
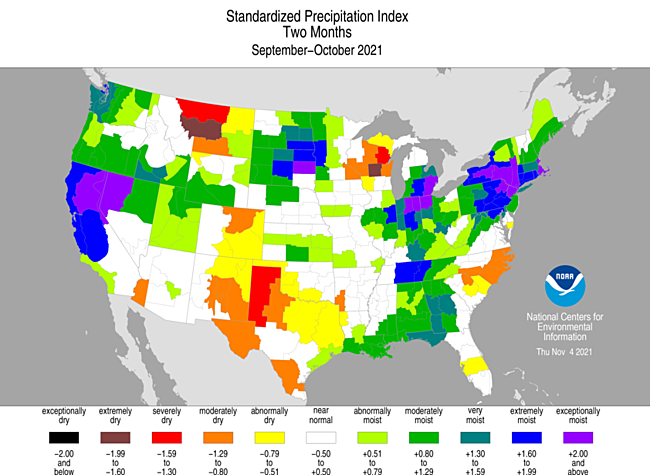
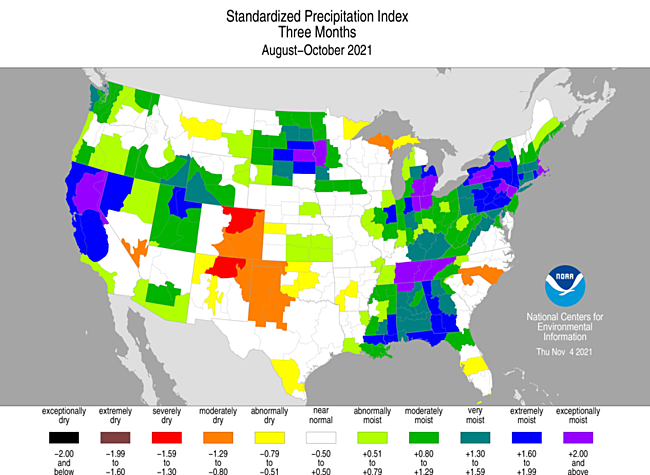
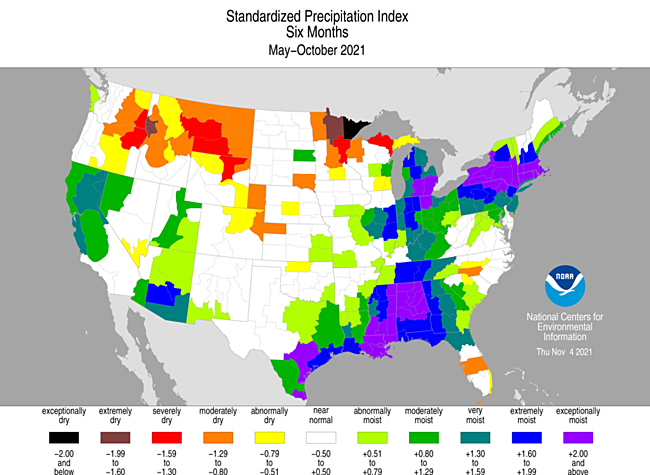
The SPI maps illustrate how moisture conditions have varied considerably through time and space over the last two years. In the West, this month's Pacific moisture and the earlier summer monsoon resulted in near-normal to wet conditions across much of the region for the last 1 to 3 months, and in California to Utah and Arizona at 6 months. There were patches of dryness in Montana and the Southwest at the 1- to 3-month time scales, and across Montana to the Pacific Northwest at the 6-month time scale. At 9 months, wet conditions were mostly gone with a greater area of dry conditions, and dry conditions dominated at the 12- and 24-month time scales. Dryness covered much of the southern Plains at 2 months and western parts at 3 and 24 months. The northern Plains were wet at 1 to 3 months and near normal to dry at 6 months, with dry conditions becoming widespread from 9 to 24 months. Parts of the western Great Lakes were dry at all time scales. Parts of northern New England were dry at 12-24 months. Parts of Florida were dry at 1 to 12 months. Parts of the Carolinas were dry at 1 to 9 months. Wet conditions dominate much of the Gulf of Mexico coast to southern Great Lakes and Northeast at all time scales, and the northern Plains at 1 to 3 months. An interesting pattern is evident at the 12- and 24-month time scales — very dry conditions dominate across the West to northern Plains, while very wet conditions dominate the Deep South to Atlantic Coast.
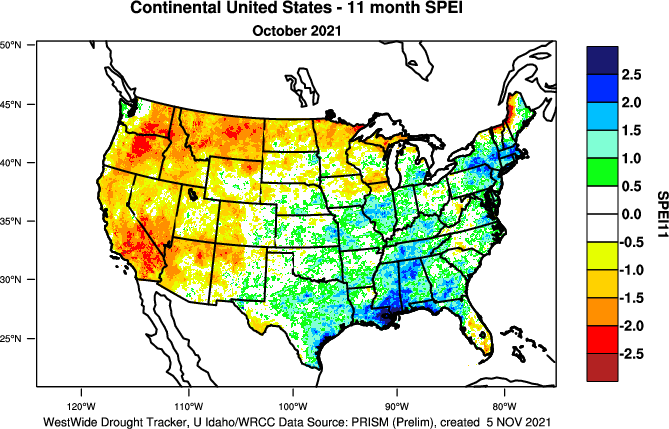
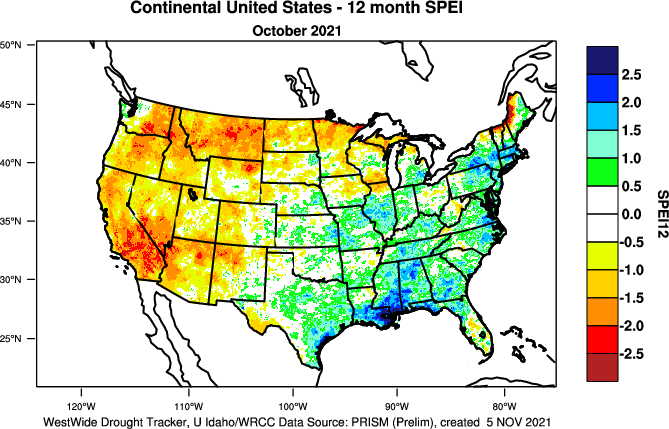
Standardized Precipitation Evapotranspiration Index
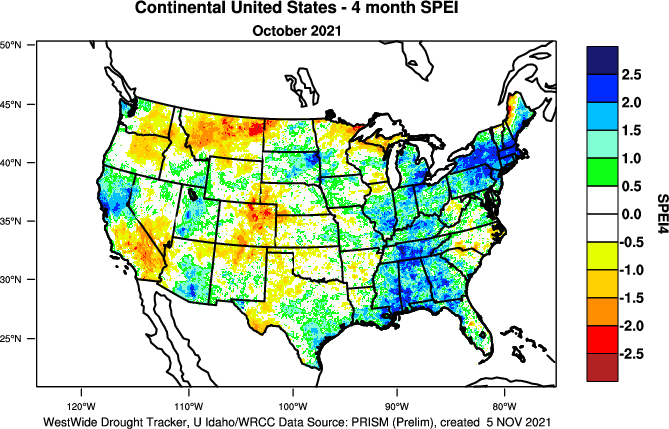
The SPI measures water supply (precipitation), while the SPEI (Standardized Precipitation Evapotranspiration Index) measures the combination of water supply (precipitation) and water demand (evapotranspiration as computed from temperature). Warmer temperatures tend to increase evapotranspiration, which generally makes droughts more intense.
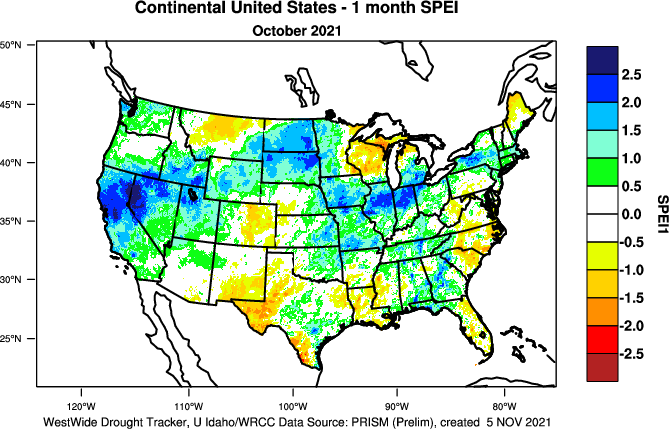
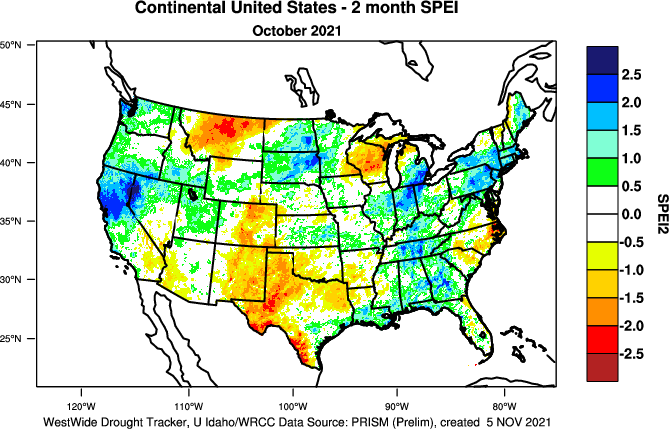

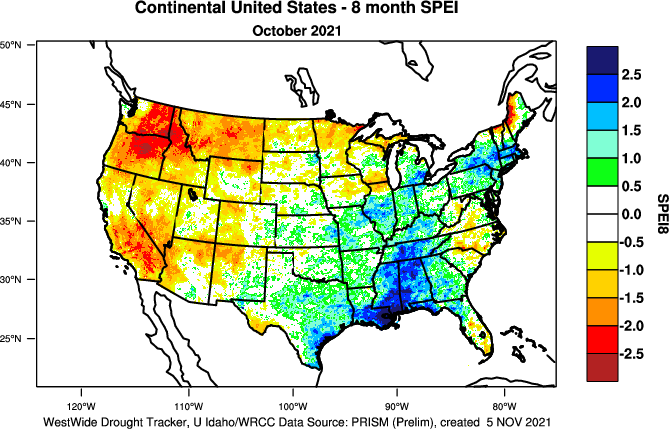

For the Northern Hemisphere, October is in the middle of climatological autumn, which is the transition season from the warmest season of the year (summer, when evapotranspiration reaches its annual maximum) to the coldest season (winter, when evapotranspiration is minimal). During October 2021, temperatures were above normal across most of the CONUS east of the Rockies, with some local areas of record warmth towards the Northeast. This resulted in increased evapotranspiration in the southern Plains and central Appalachians. This led to a more severe SPEI than SPI in parts of Texas and the western Great Lakes where it was dry, but wetter-than-normal conditions elsewhere neutralized the impact of the warmer-than-normal temperatures in October. Much of the year was warmer than normal, especially beginning in June, for the Northeast, West, and northern Plains. Evapotranspiration was enhanced, especially in the northern Plains and West. The resulted in a more extreme SPEI than the SPI in these hot dry areas for most of the year (SPEI maps for last 1, 2, 3, 4, 5, 6, 7, 8, 9, 10, 11, 12 months) (SPI maps for last 1, 2, 3, 4, 5, 6, 7, 8, 9, 10, 11, 12 months), especially over the West and Plains.
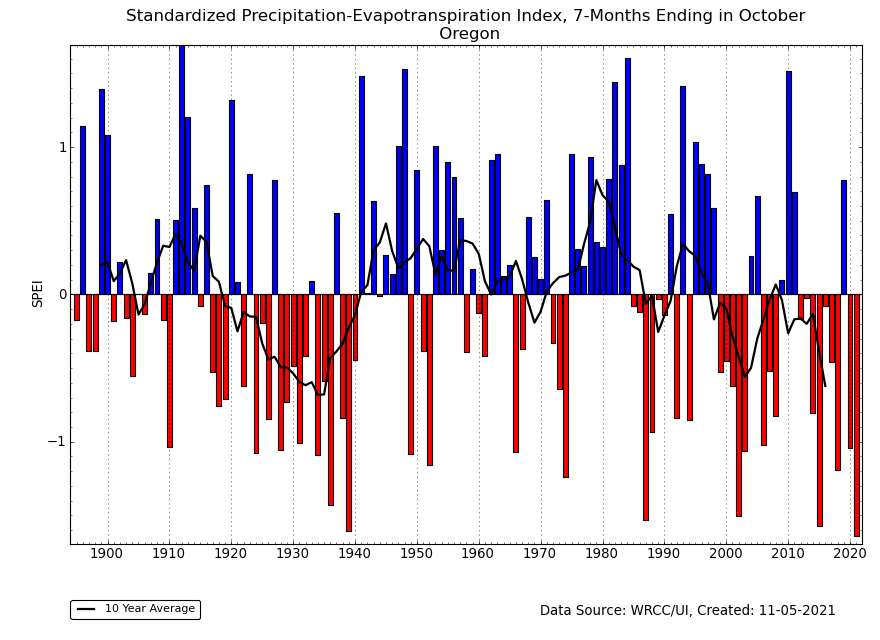
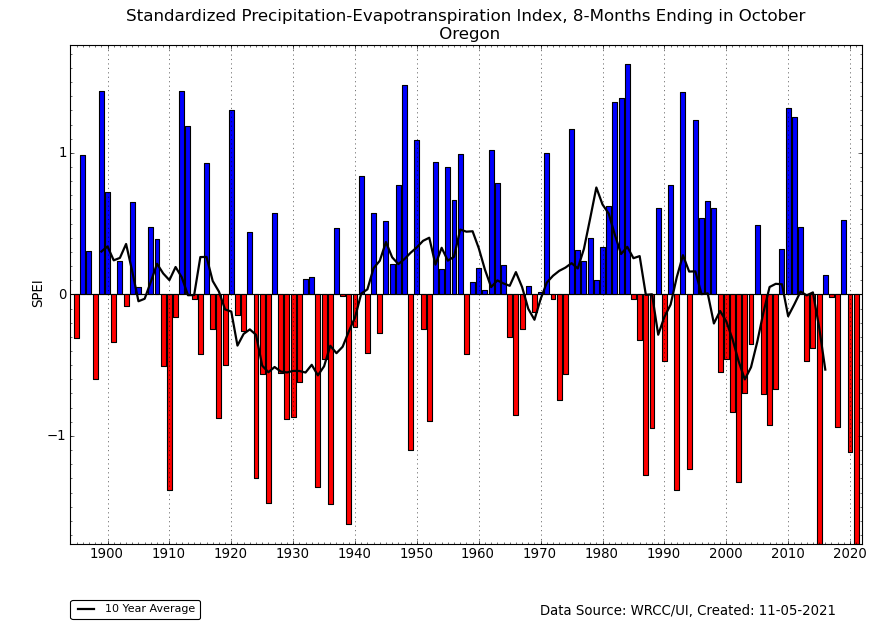
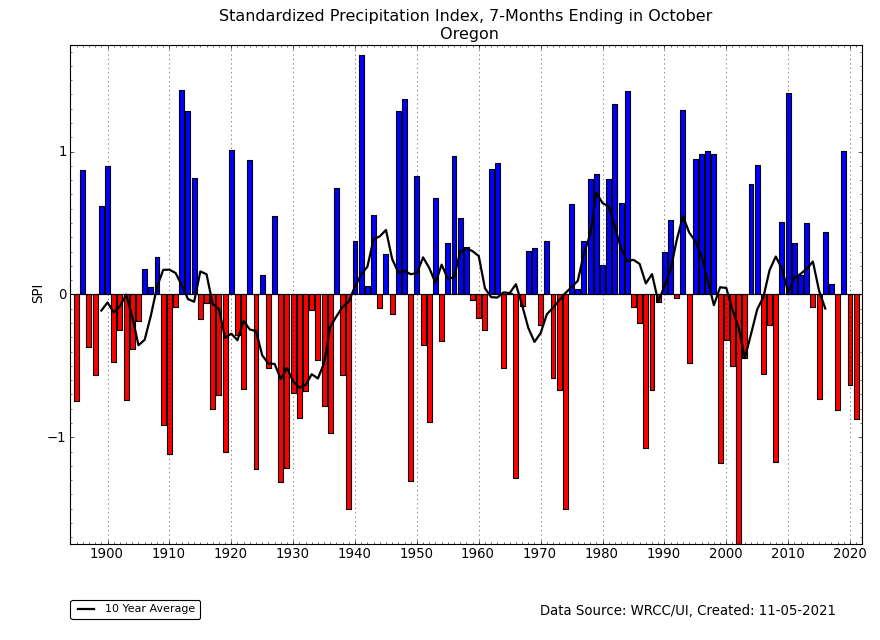
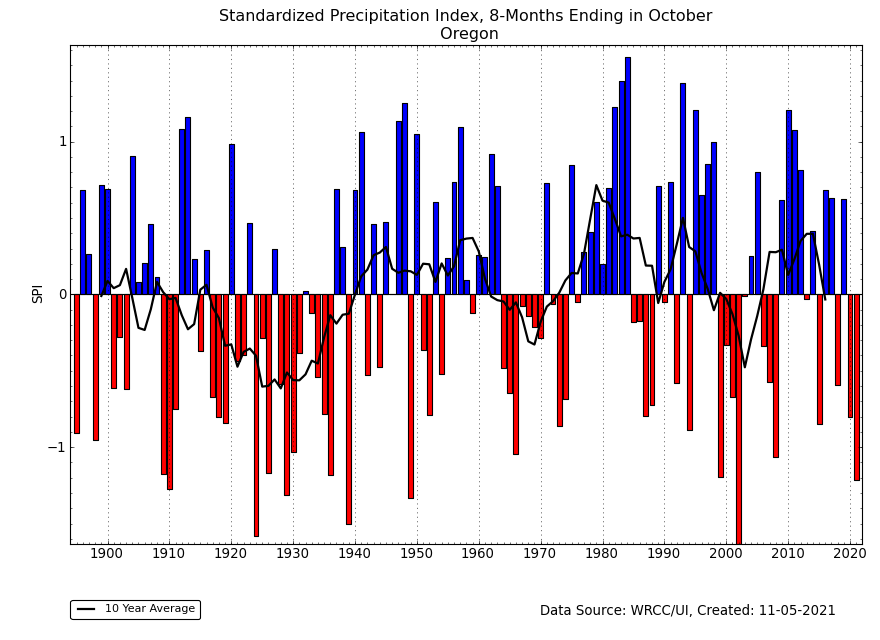
Oregon had the driest SPEI on record for October at the 7- and 8-month time scales. The SPI was not record dry for those time periods.
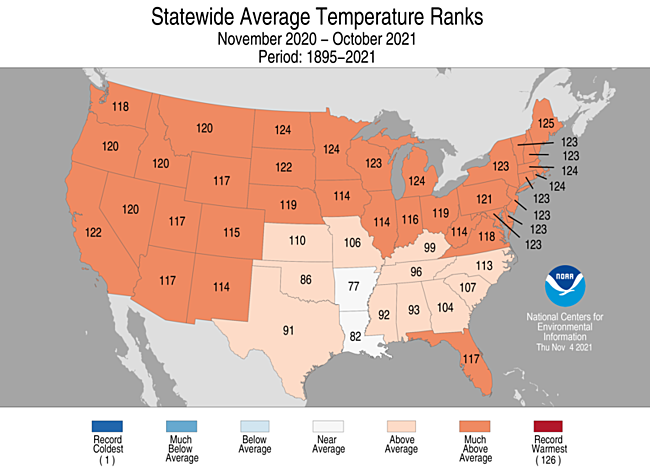
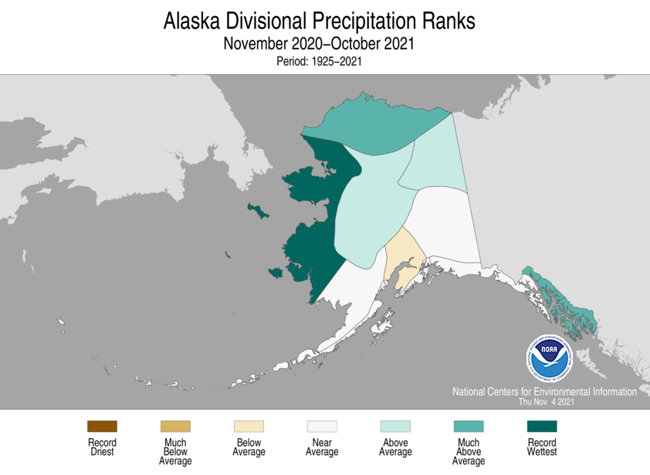
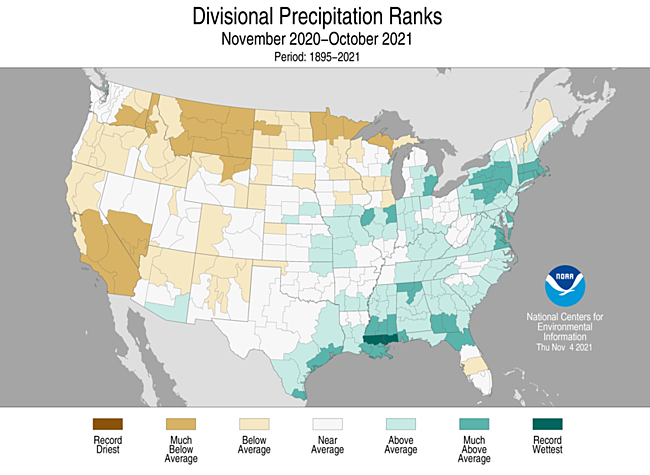
Rainfall from the summer monsoon and Pacific precipitation in October improved the November-October 12-month precipitation ranks for the Western U.S., with November 2020-October 2021 ranking as the 13th driest such 12-month period in the 1895-2021 record. The 24-month period was no longer the driest such period on record. The recent precipitation improved the rank for November 2019-October 2021 to third driest such 24-month period on record. Temperatures were still in the top ten warmest category, with November 2020-October 2021 ranking as the seventh warmest such 12-month period and November 2019-October 2021 ranking as the fourth warmest such 24-month period. Temperatures have been much warmer than normal in the Western U.S. for much of the last one to eight years, and have undergone a pronounced warming trend for the last 40 years.
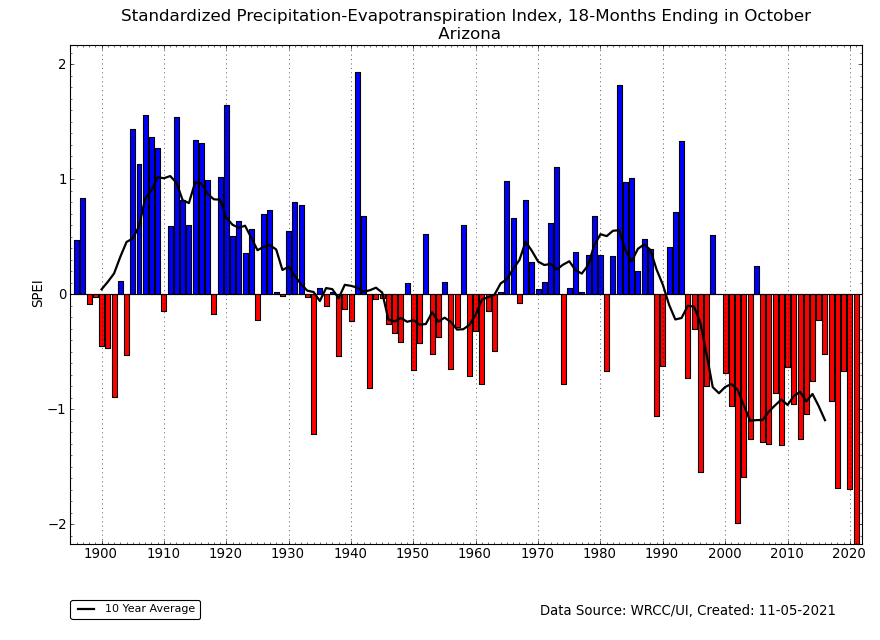
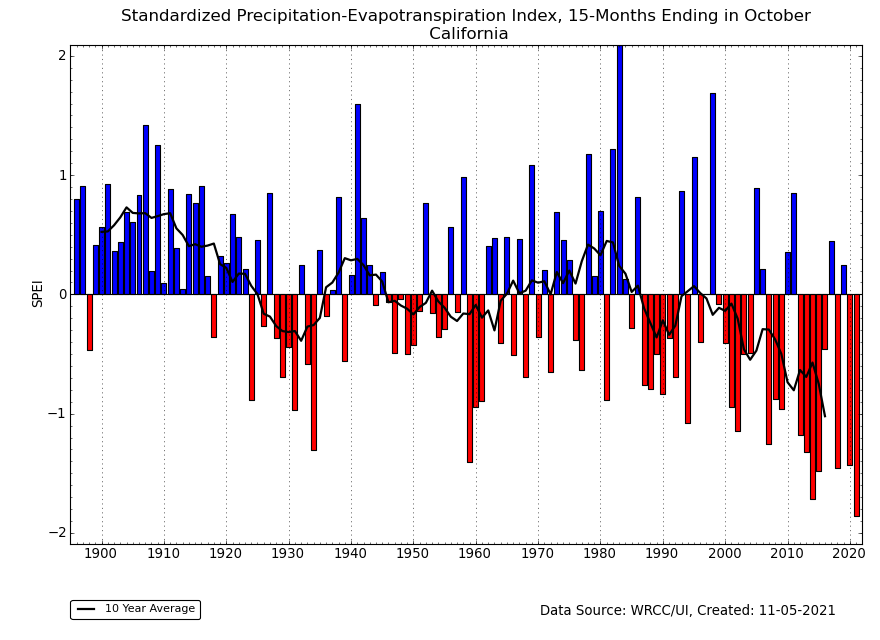
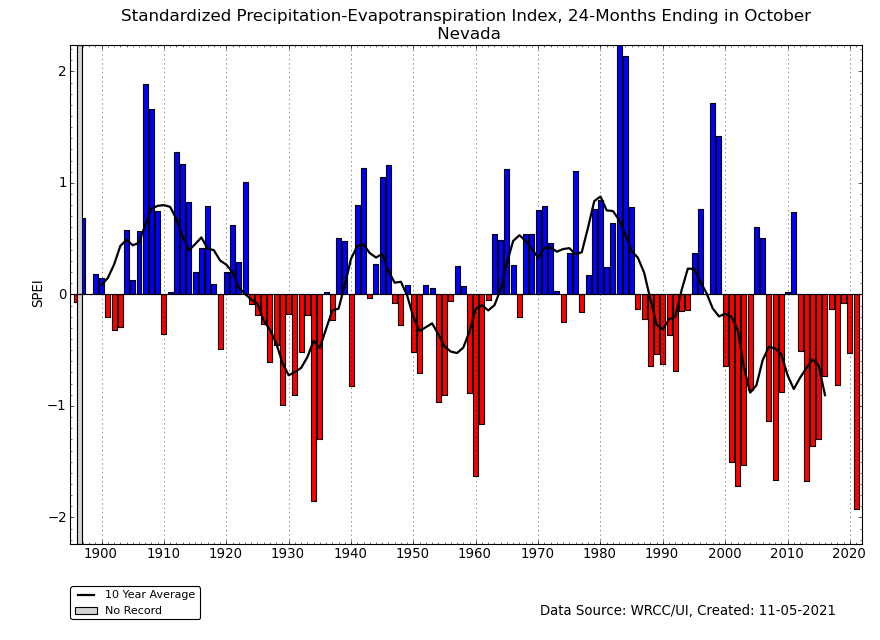
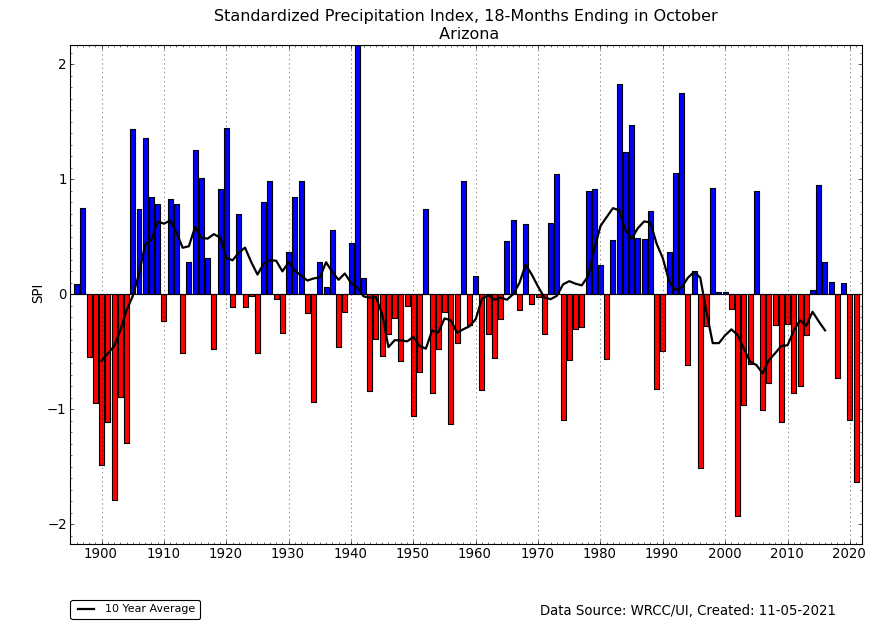

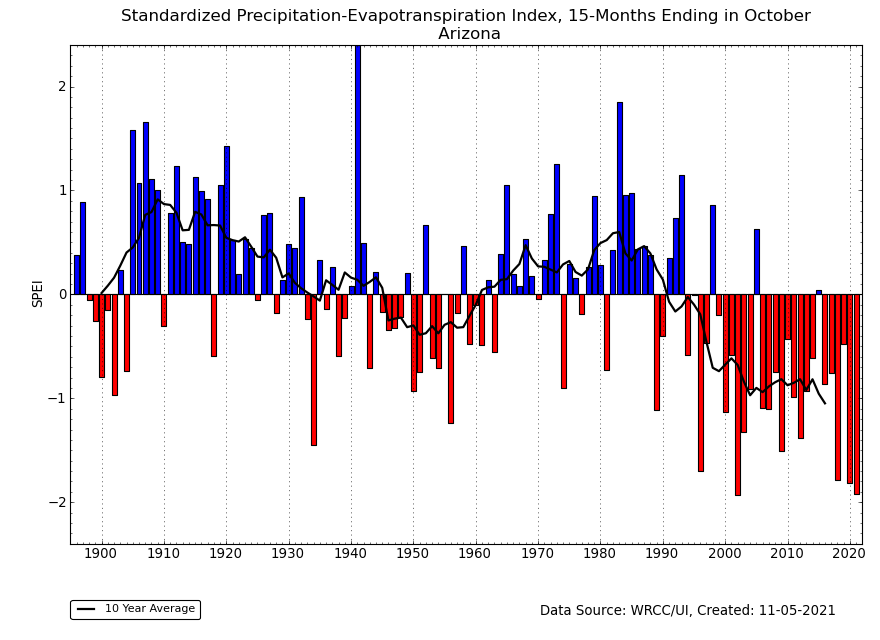
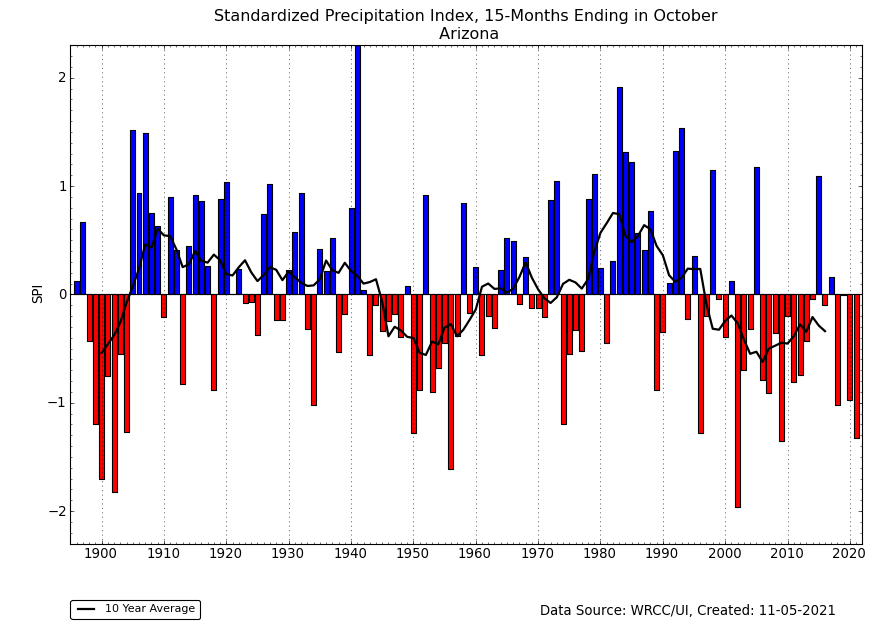
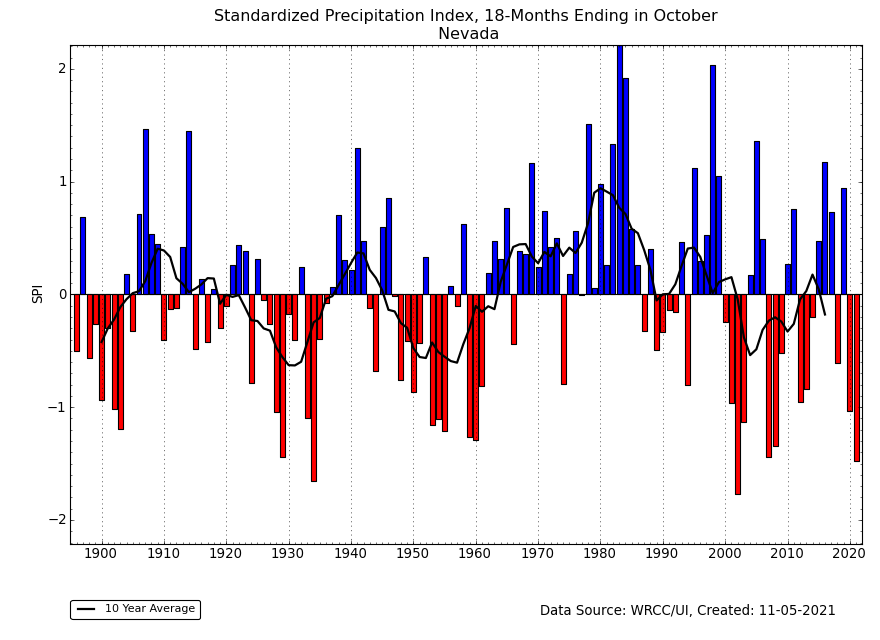
In spite of the recent beneficial precipitation, the SPEI is still record or near-record dry for longer time scales for some states:
- Arizona (SPEI for last 15 and 18 months) (SPI for last 15 and 18 months)
- California (SPEI for last 15 and 18 months) (SPI for last 15 and 18 months)
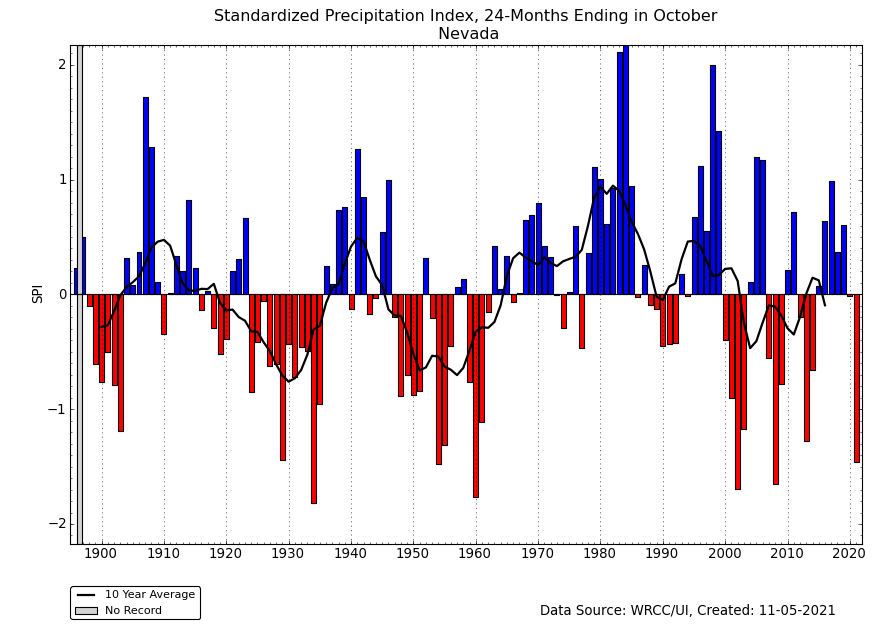
- Nevada (SPEI for last 18 and 24 months) (SPI for last 18 and 24 months)
Regional Discussion
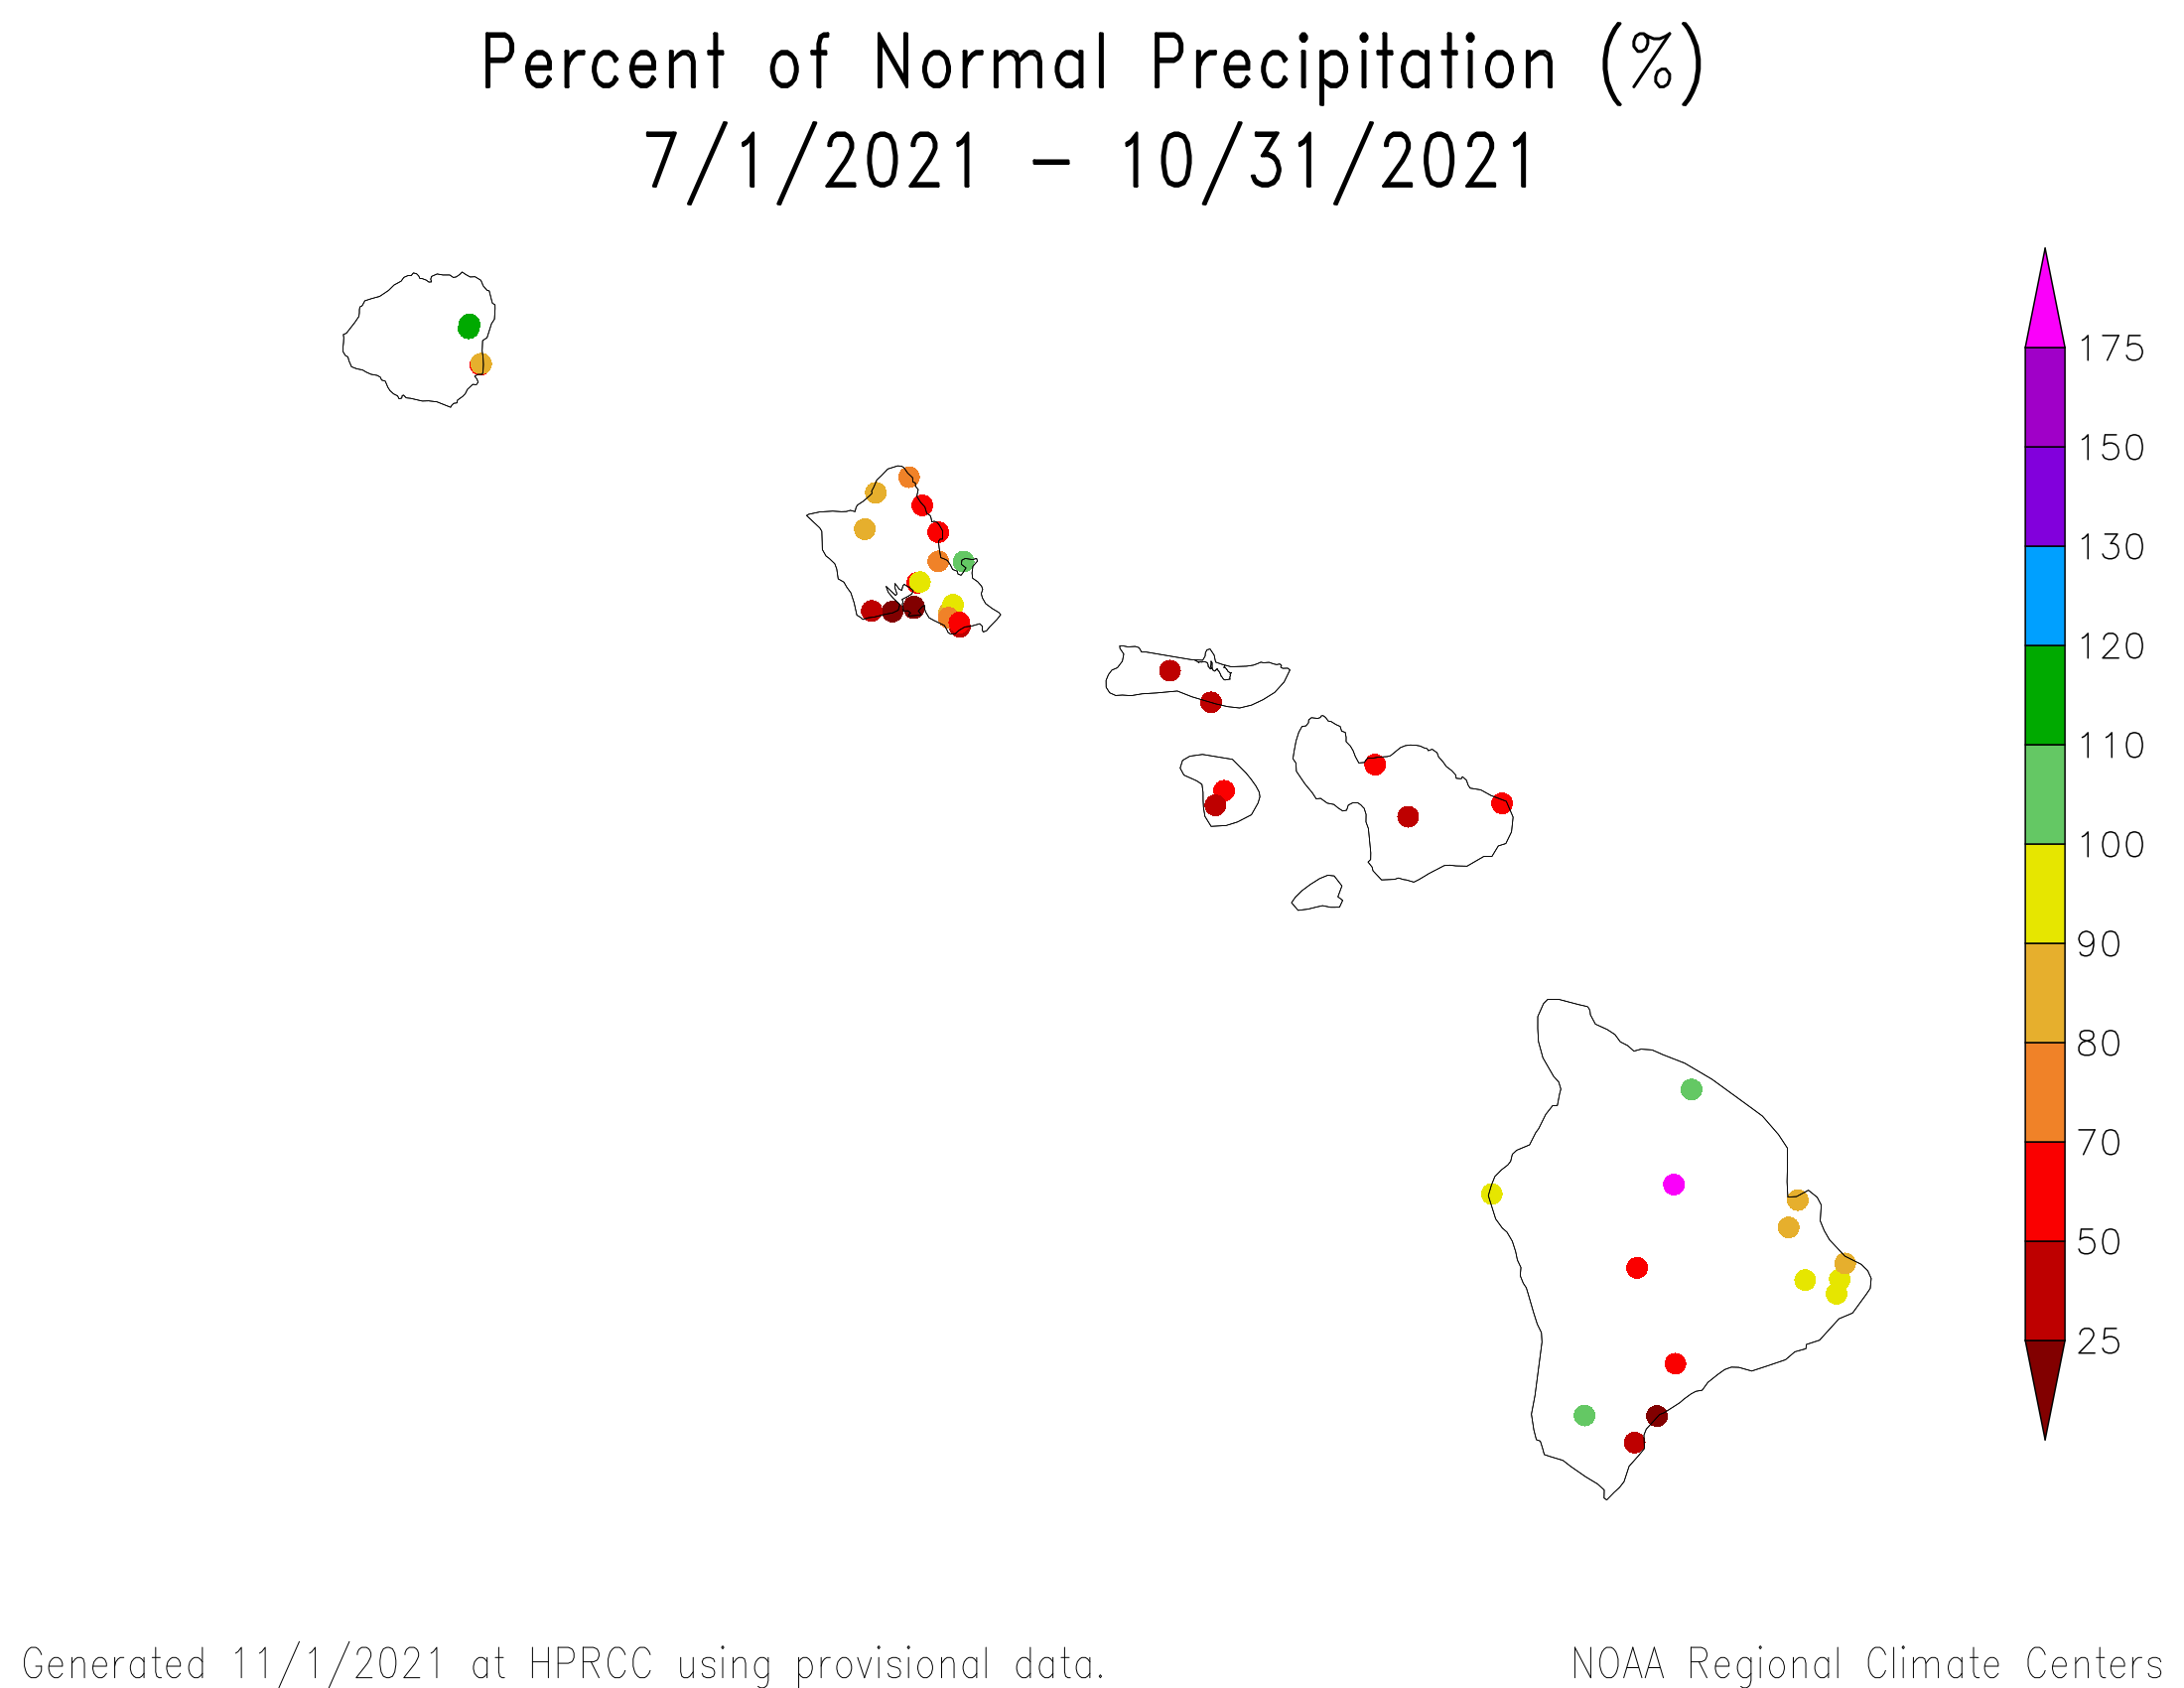
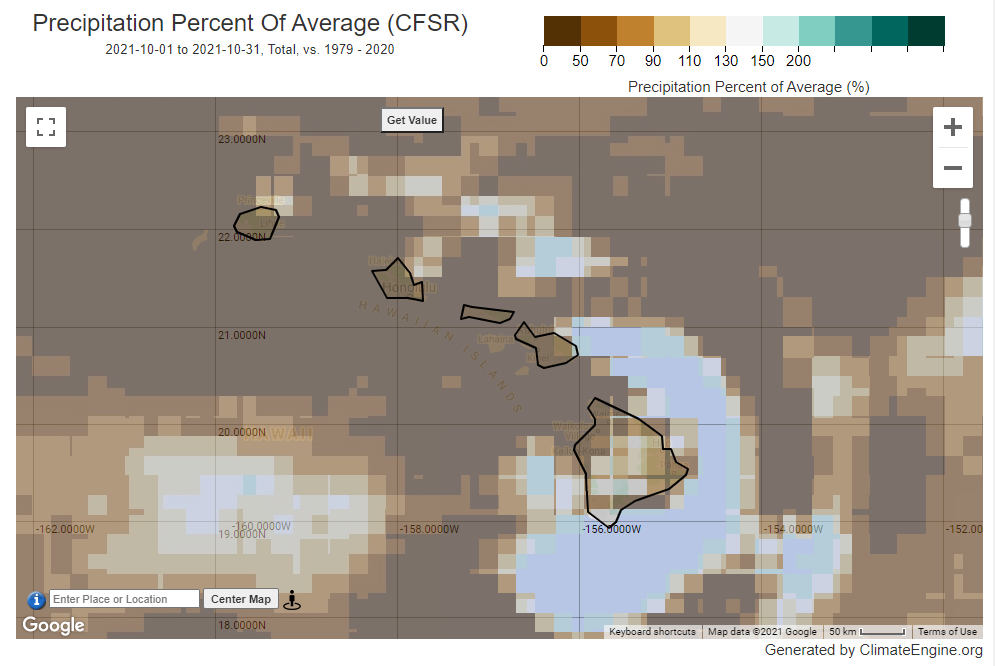
Hawaii


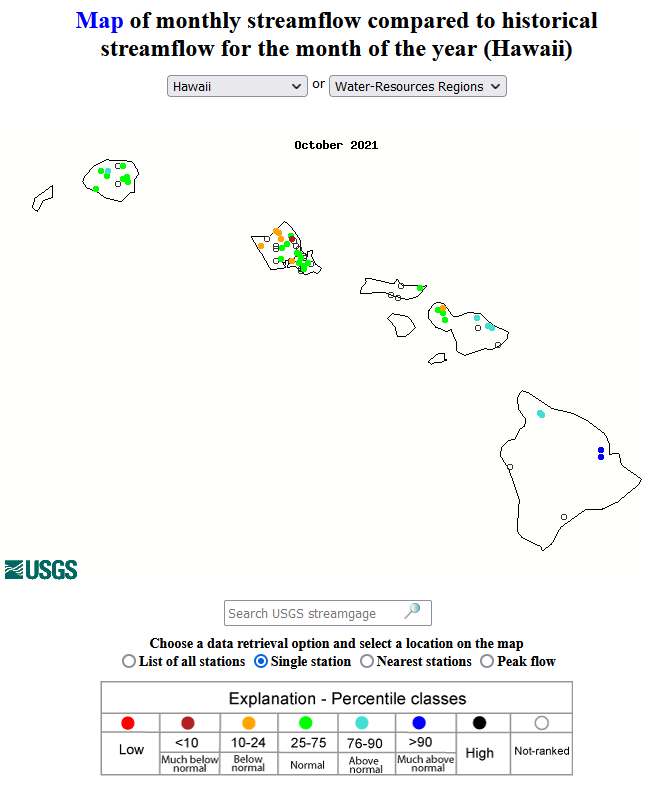
October 2021 was mostly drier than normal across Hawaii. Dry conditions dominated for much of the last 7 months. A wet March resulted in a mixed anomaly pattern at the 9- to 12-month time scales. Maps for the last 24-60 months are not available (last 1, 2, 3, 4, 6, 7, 9, 10, 12 months) (climate engine model percent of normal precipitation map for the last month). Monthly streamflow was near to above normal across most of the state, with some below-normal streams in the central islands. Areas of moderate to severe drought were on all of the main islands, with extreme to exceptional drought over Molokai, Lanai, Maui and Kaho'Olawe. But the overall drought footprint changed little, ending the month at 38.5 percent on the November 2nd USDM map.
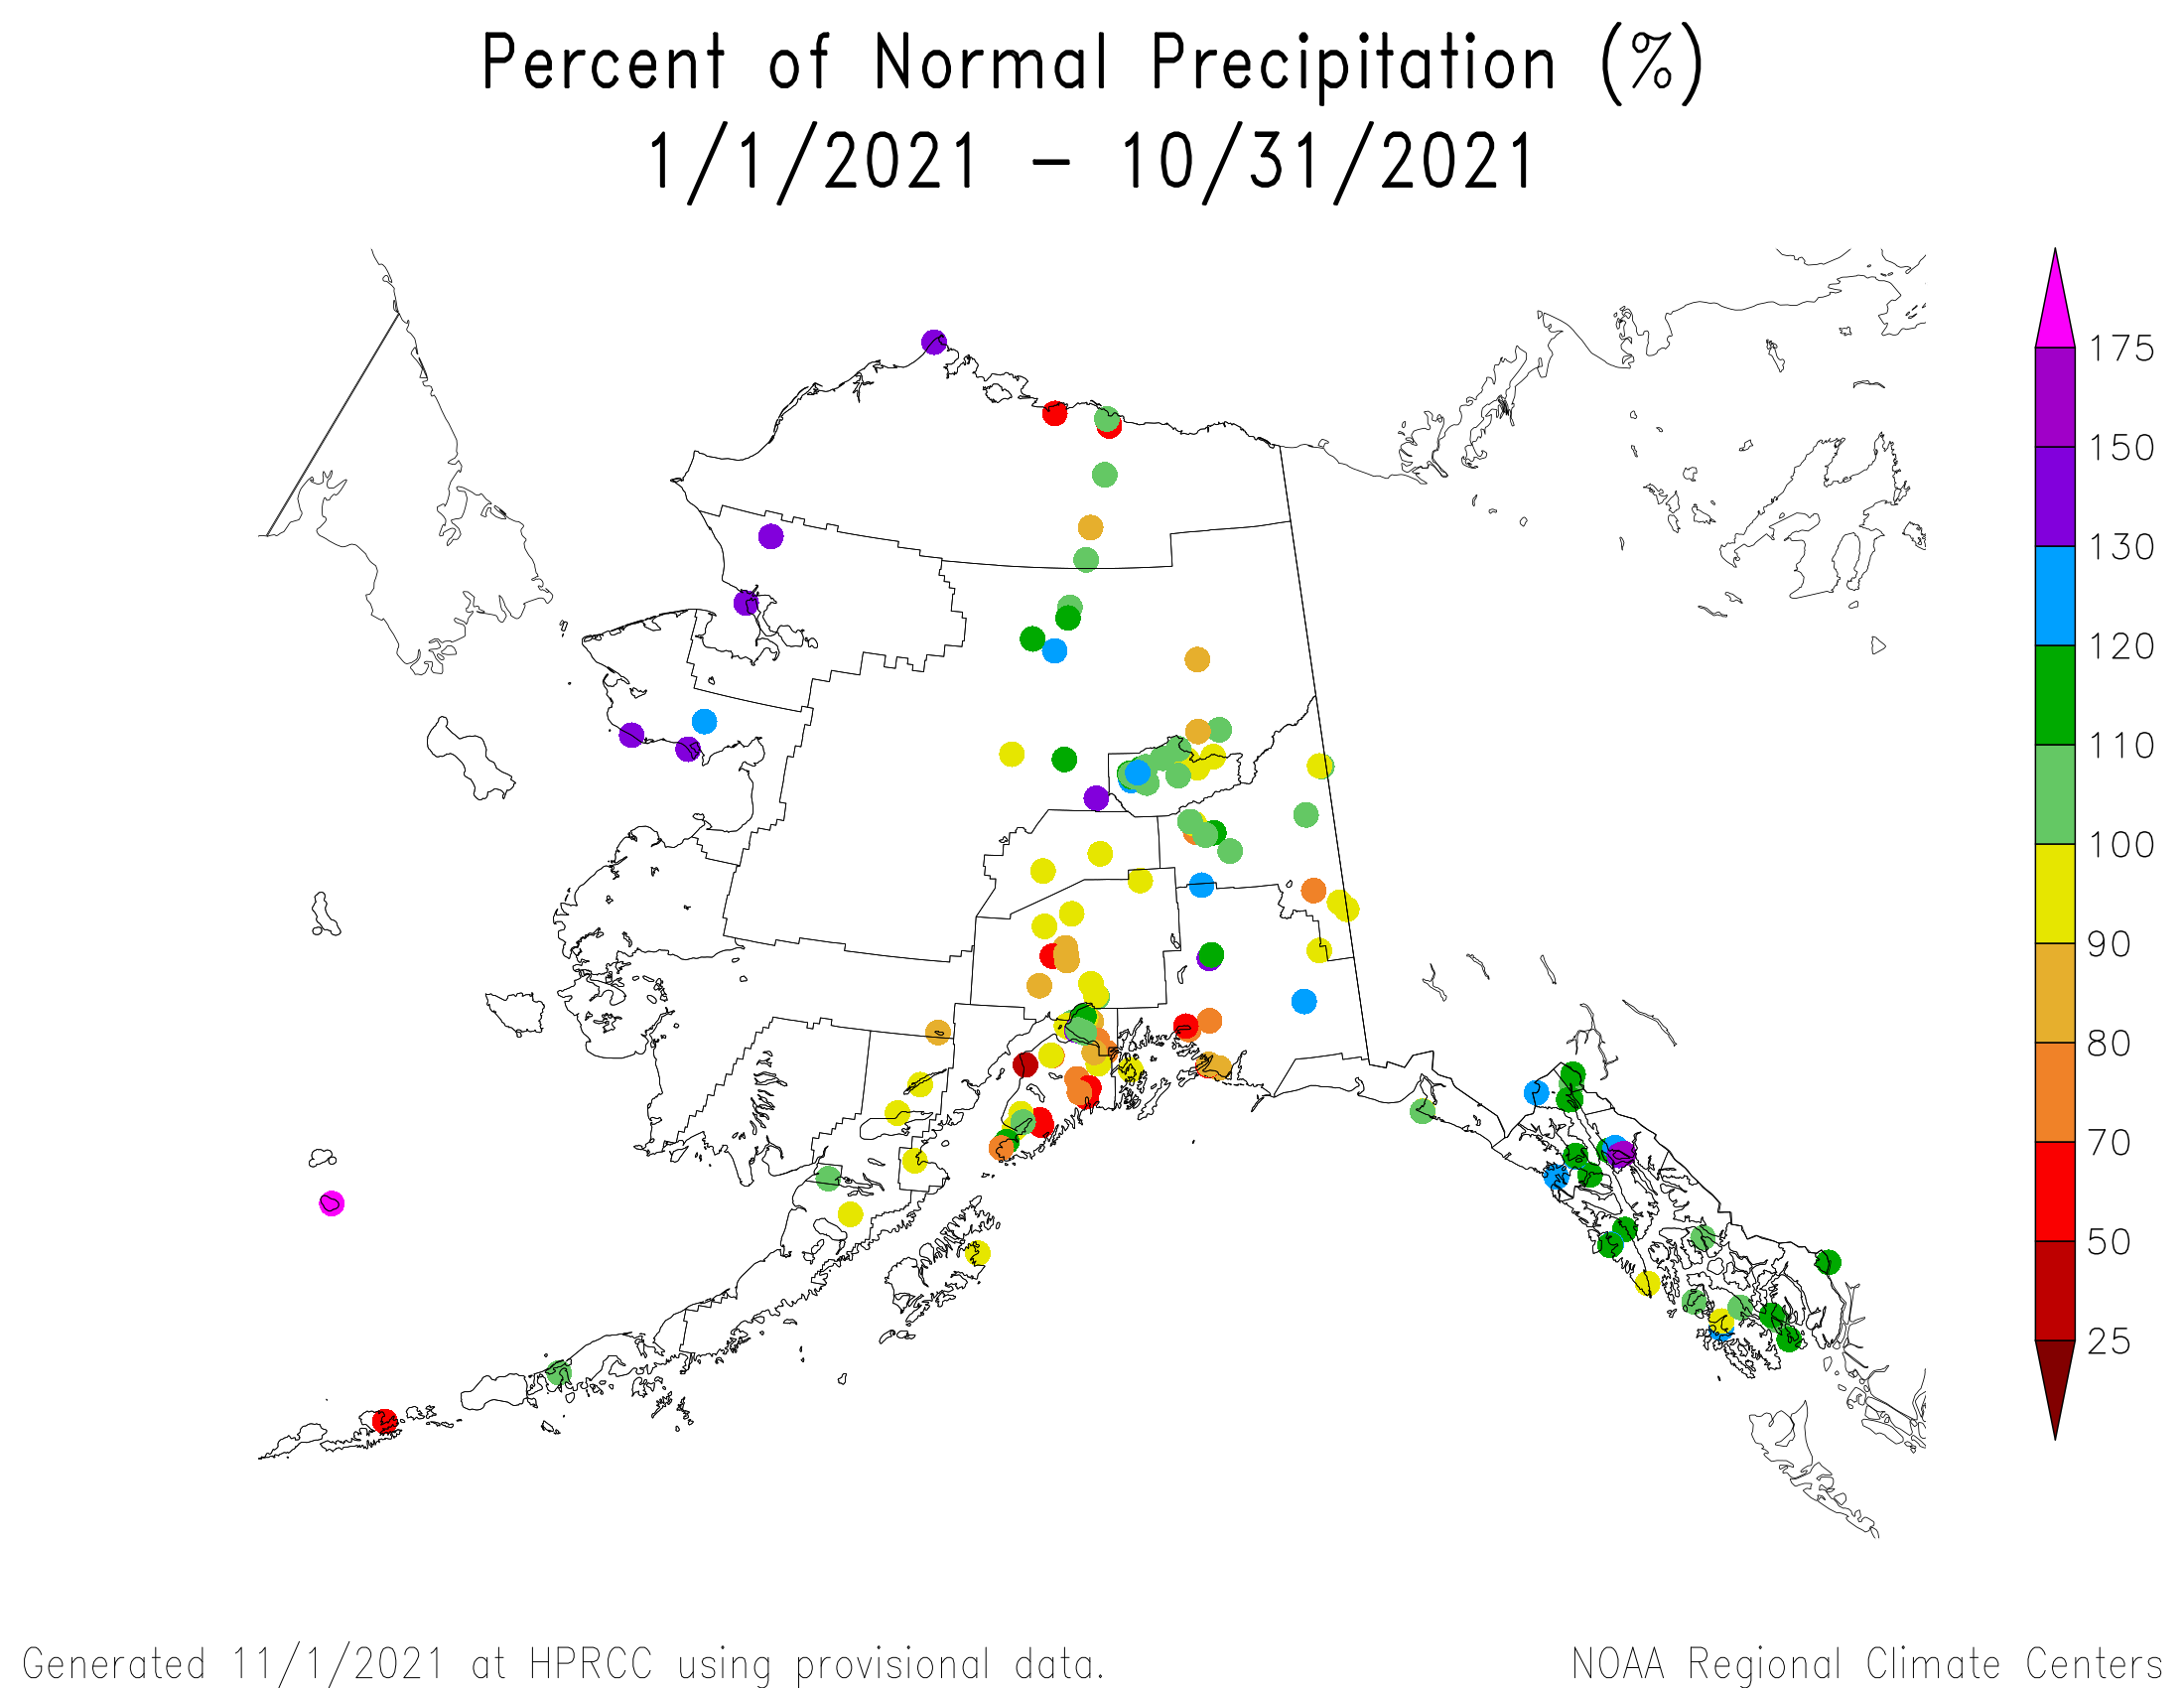
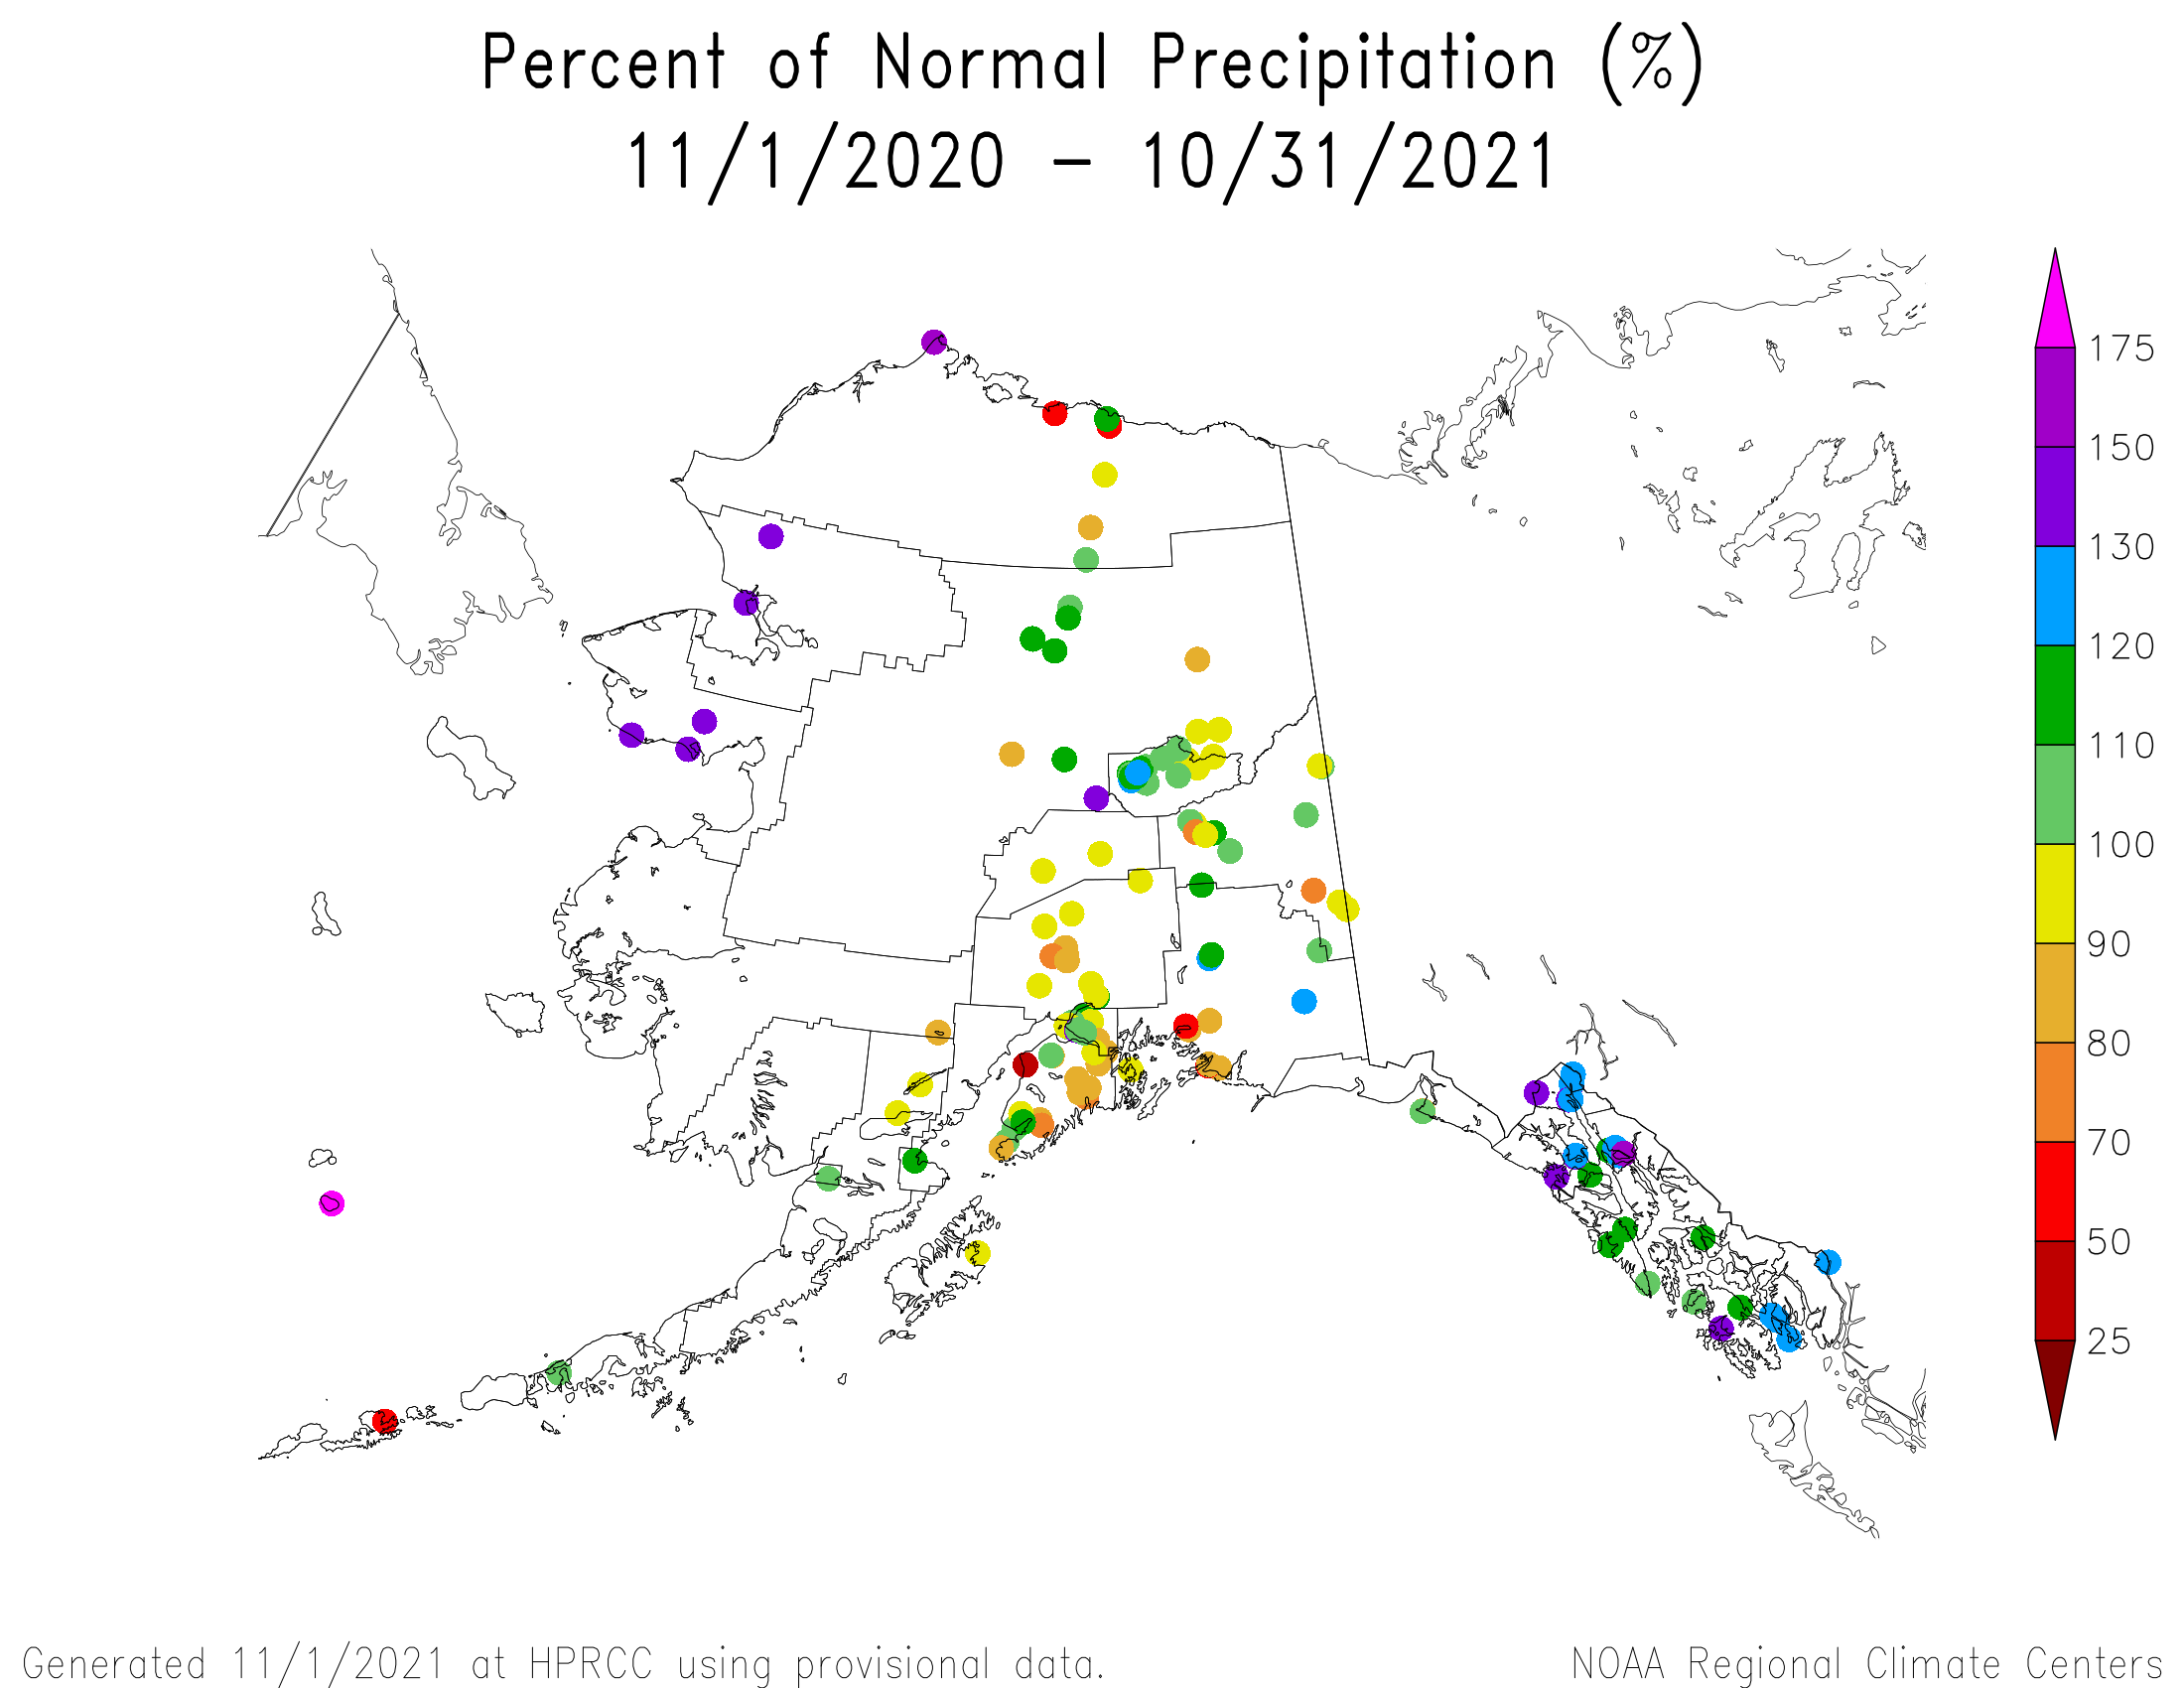
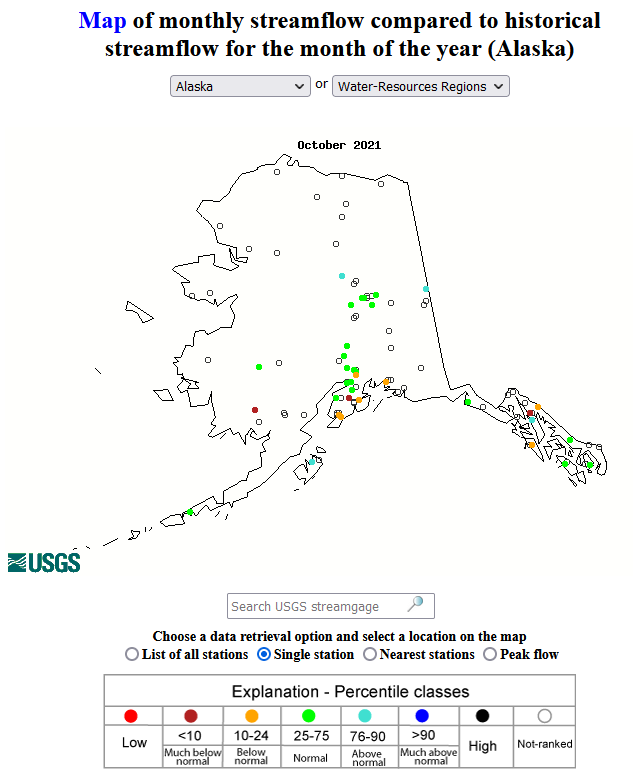
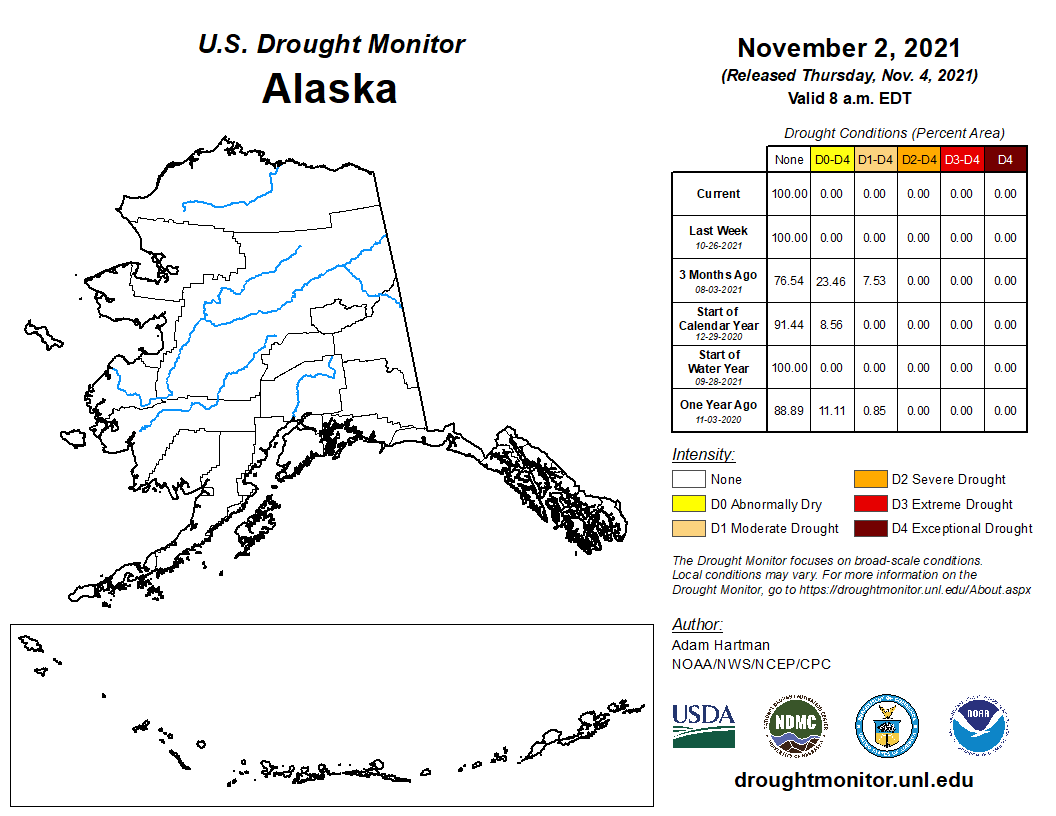
Alaska
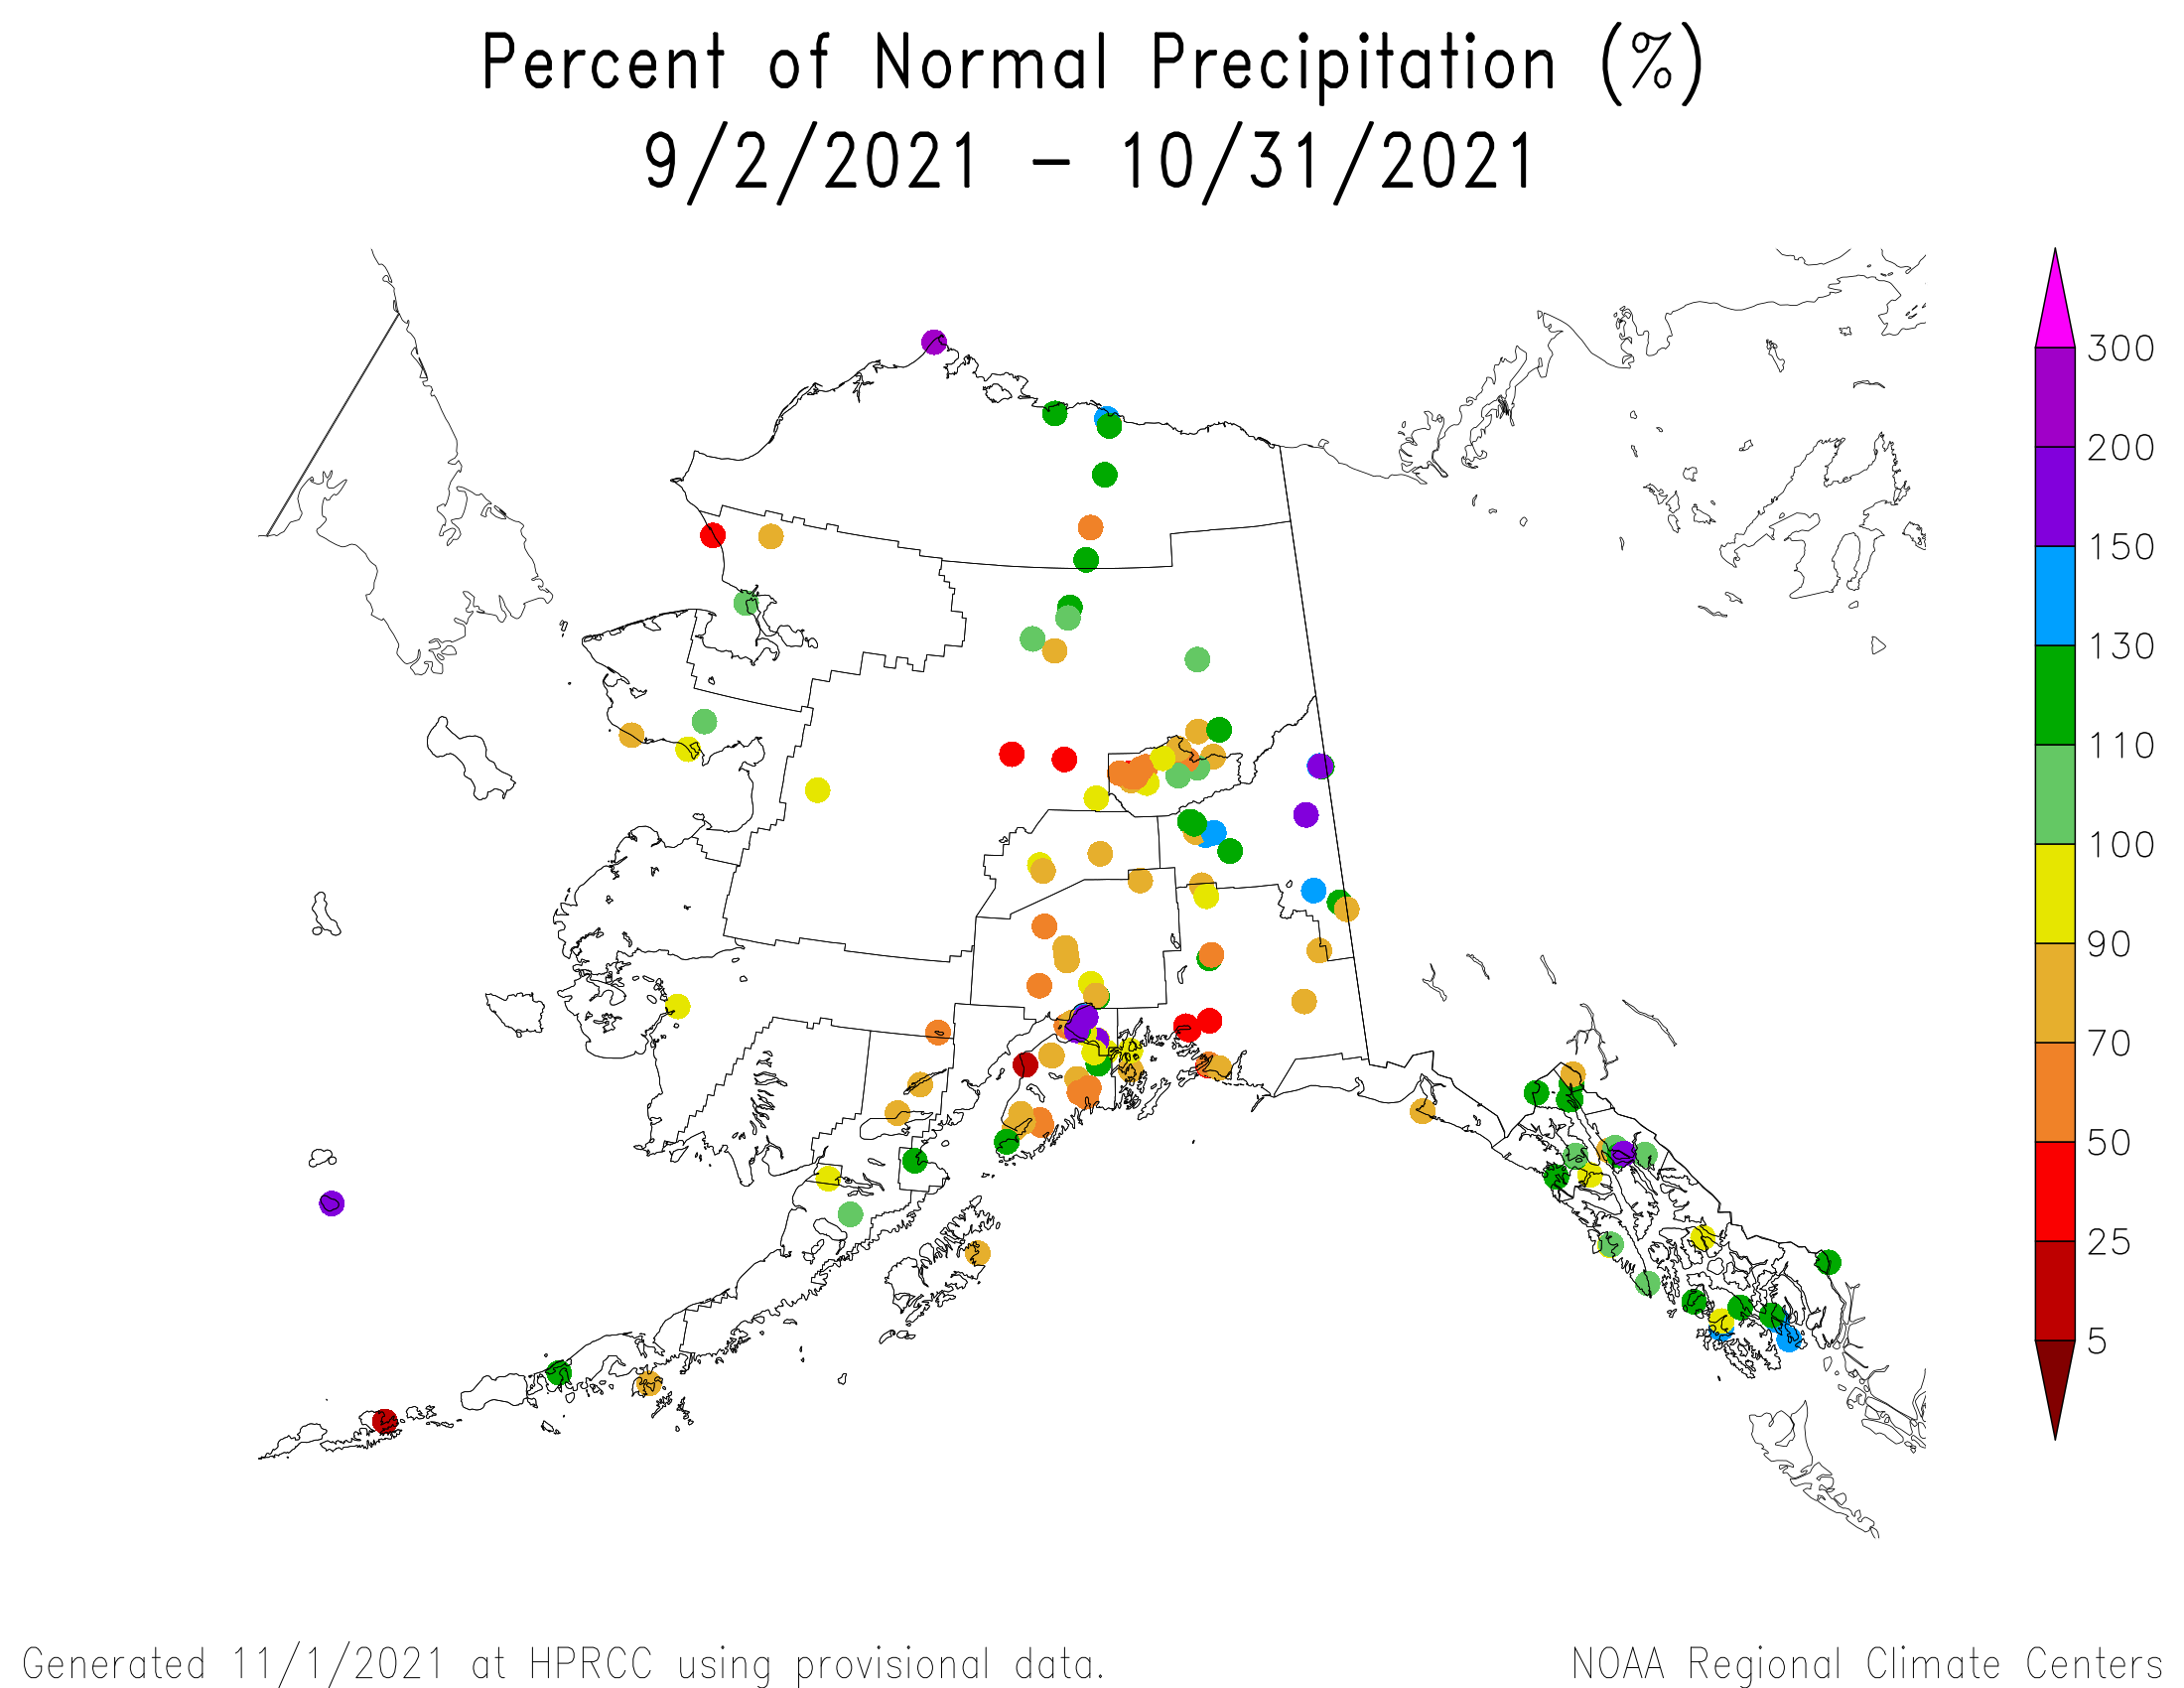
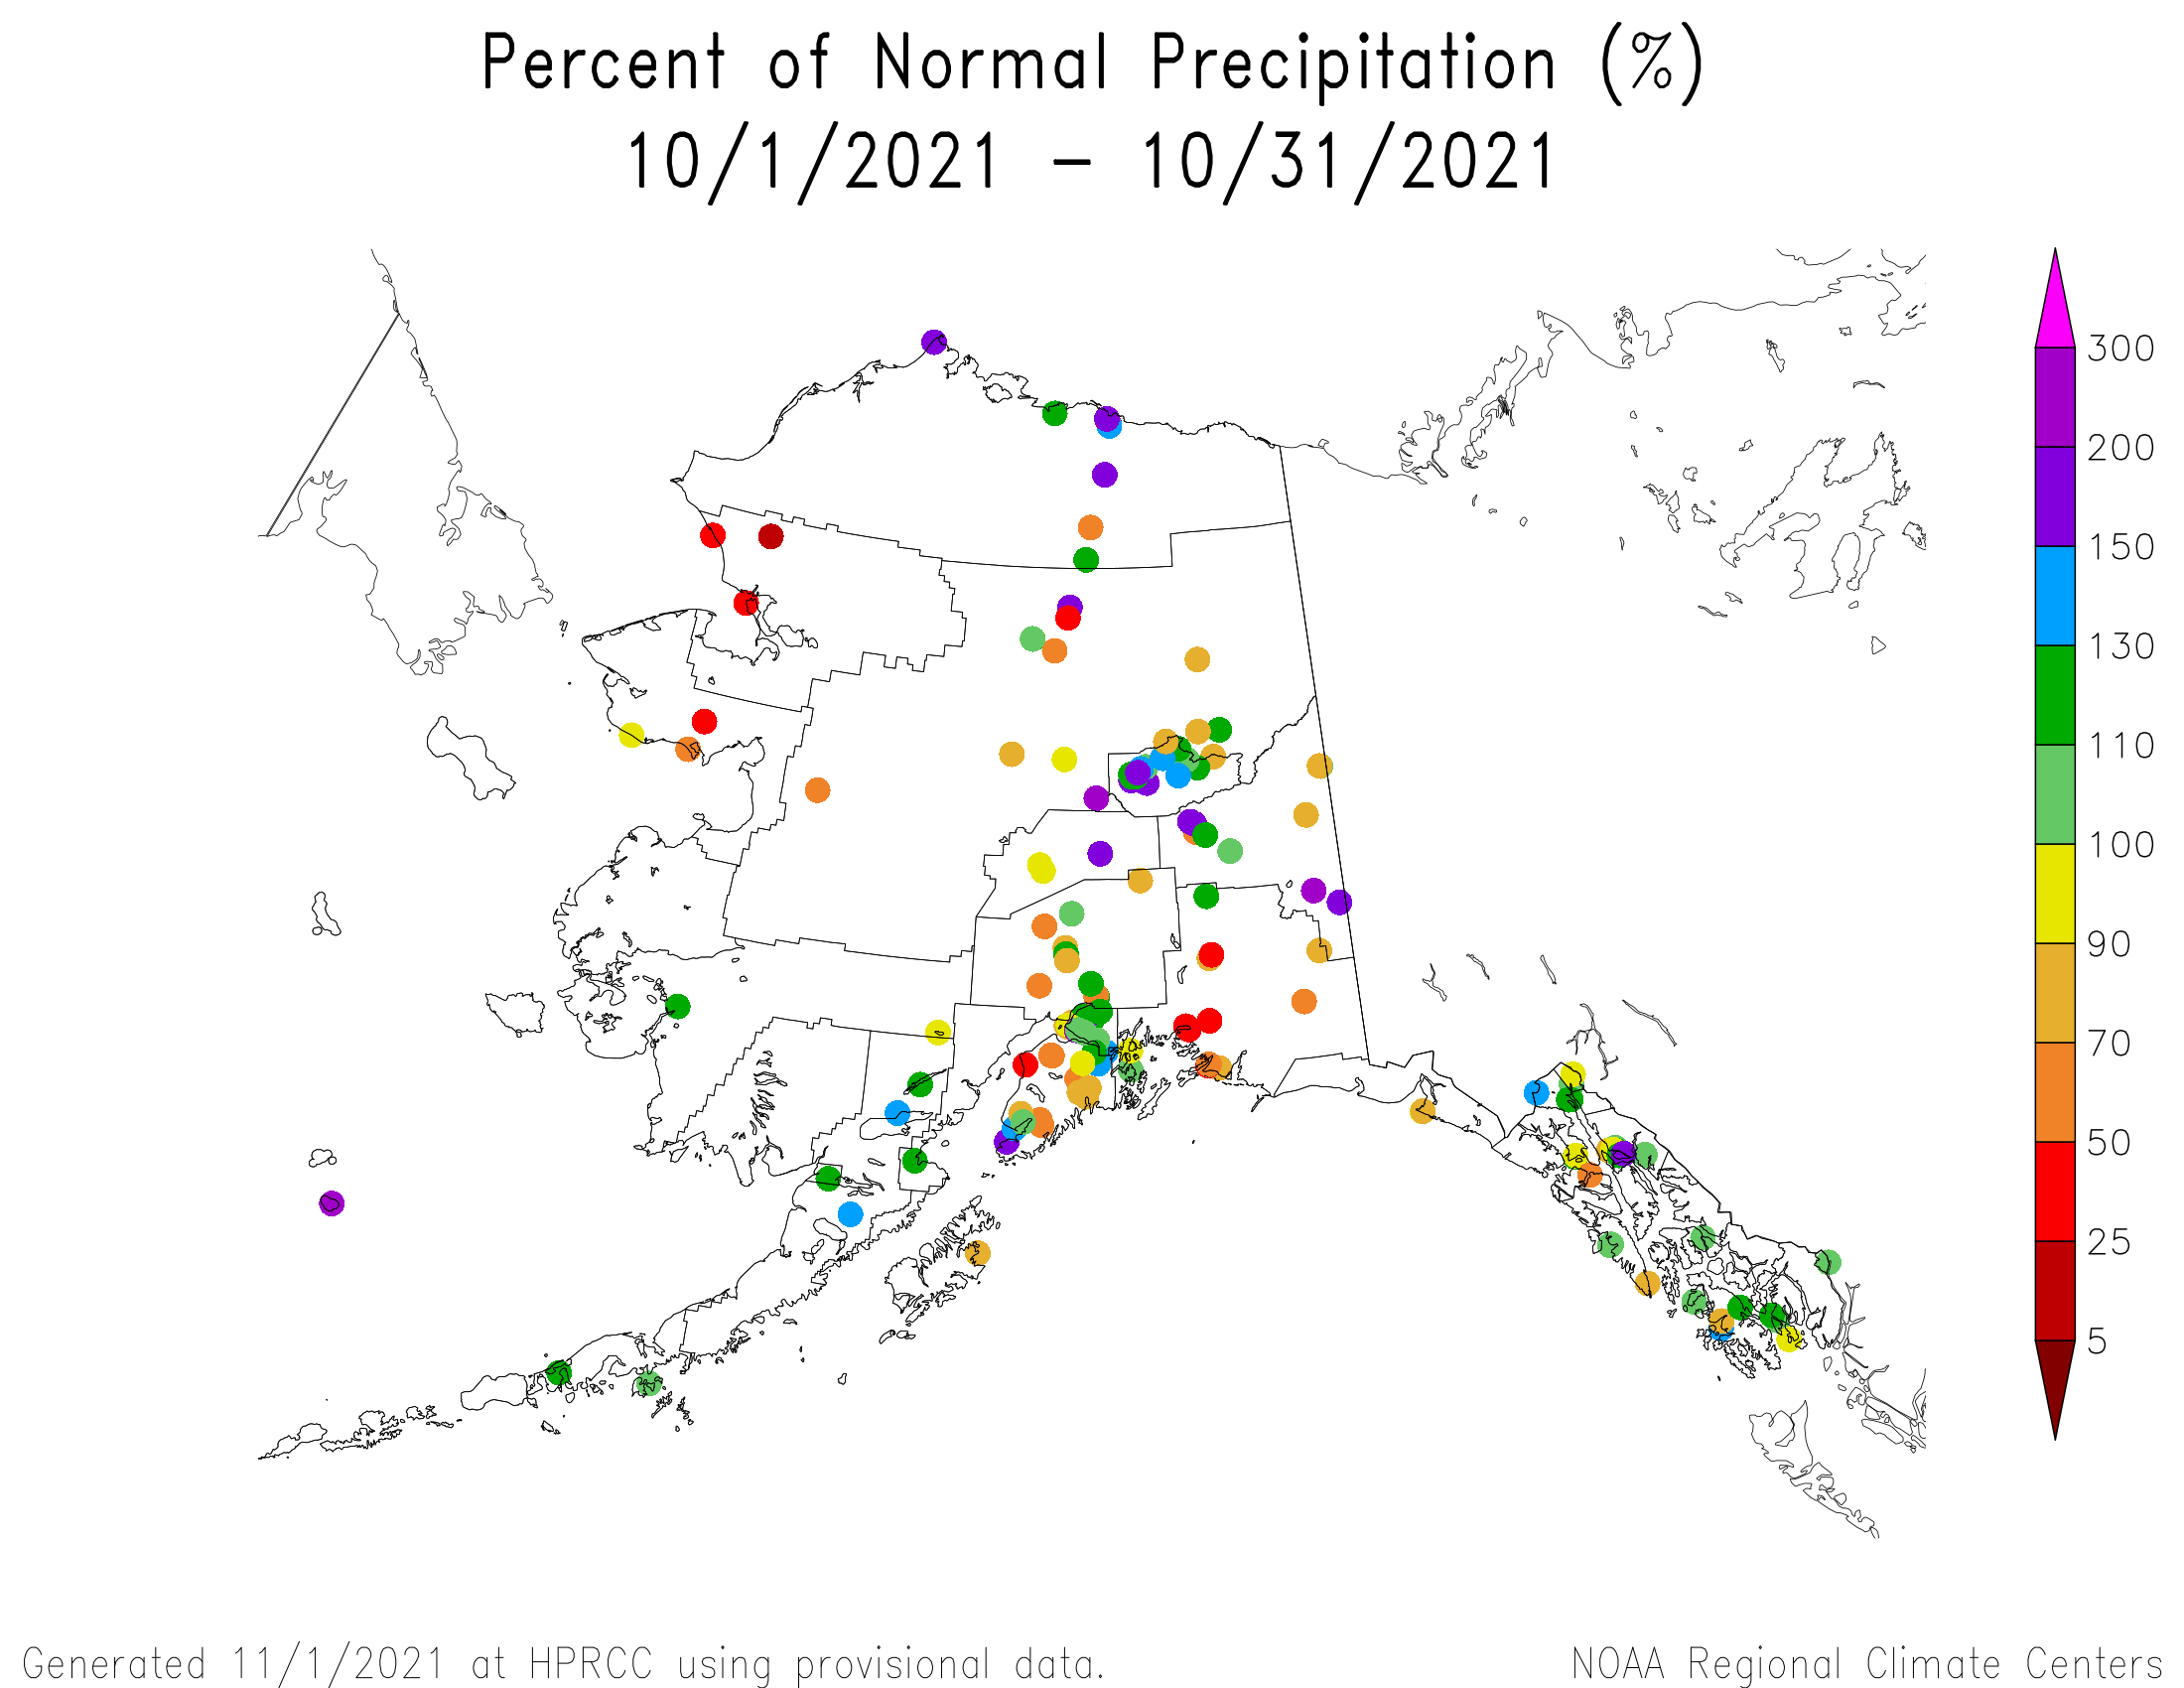
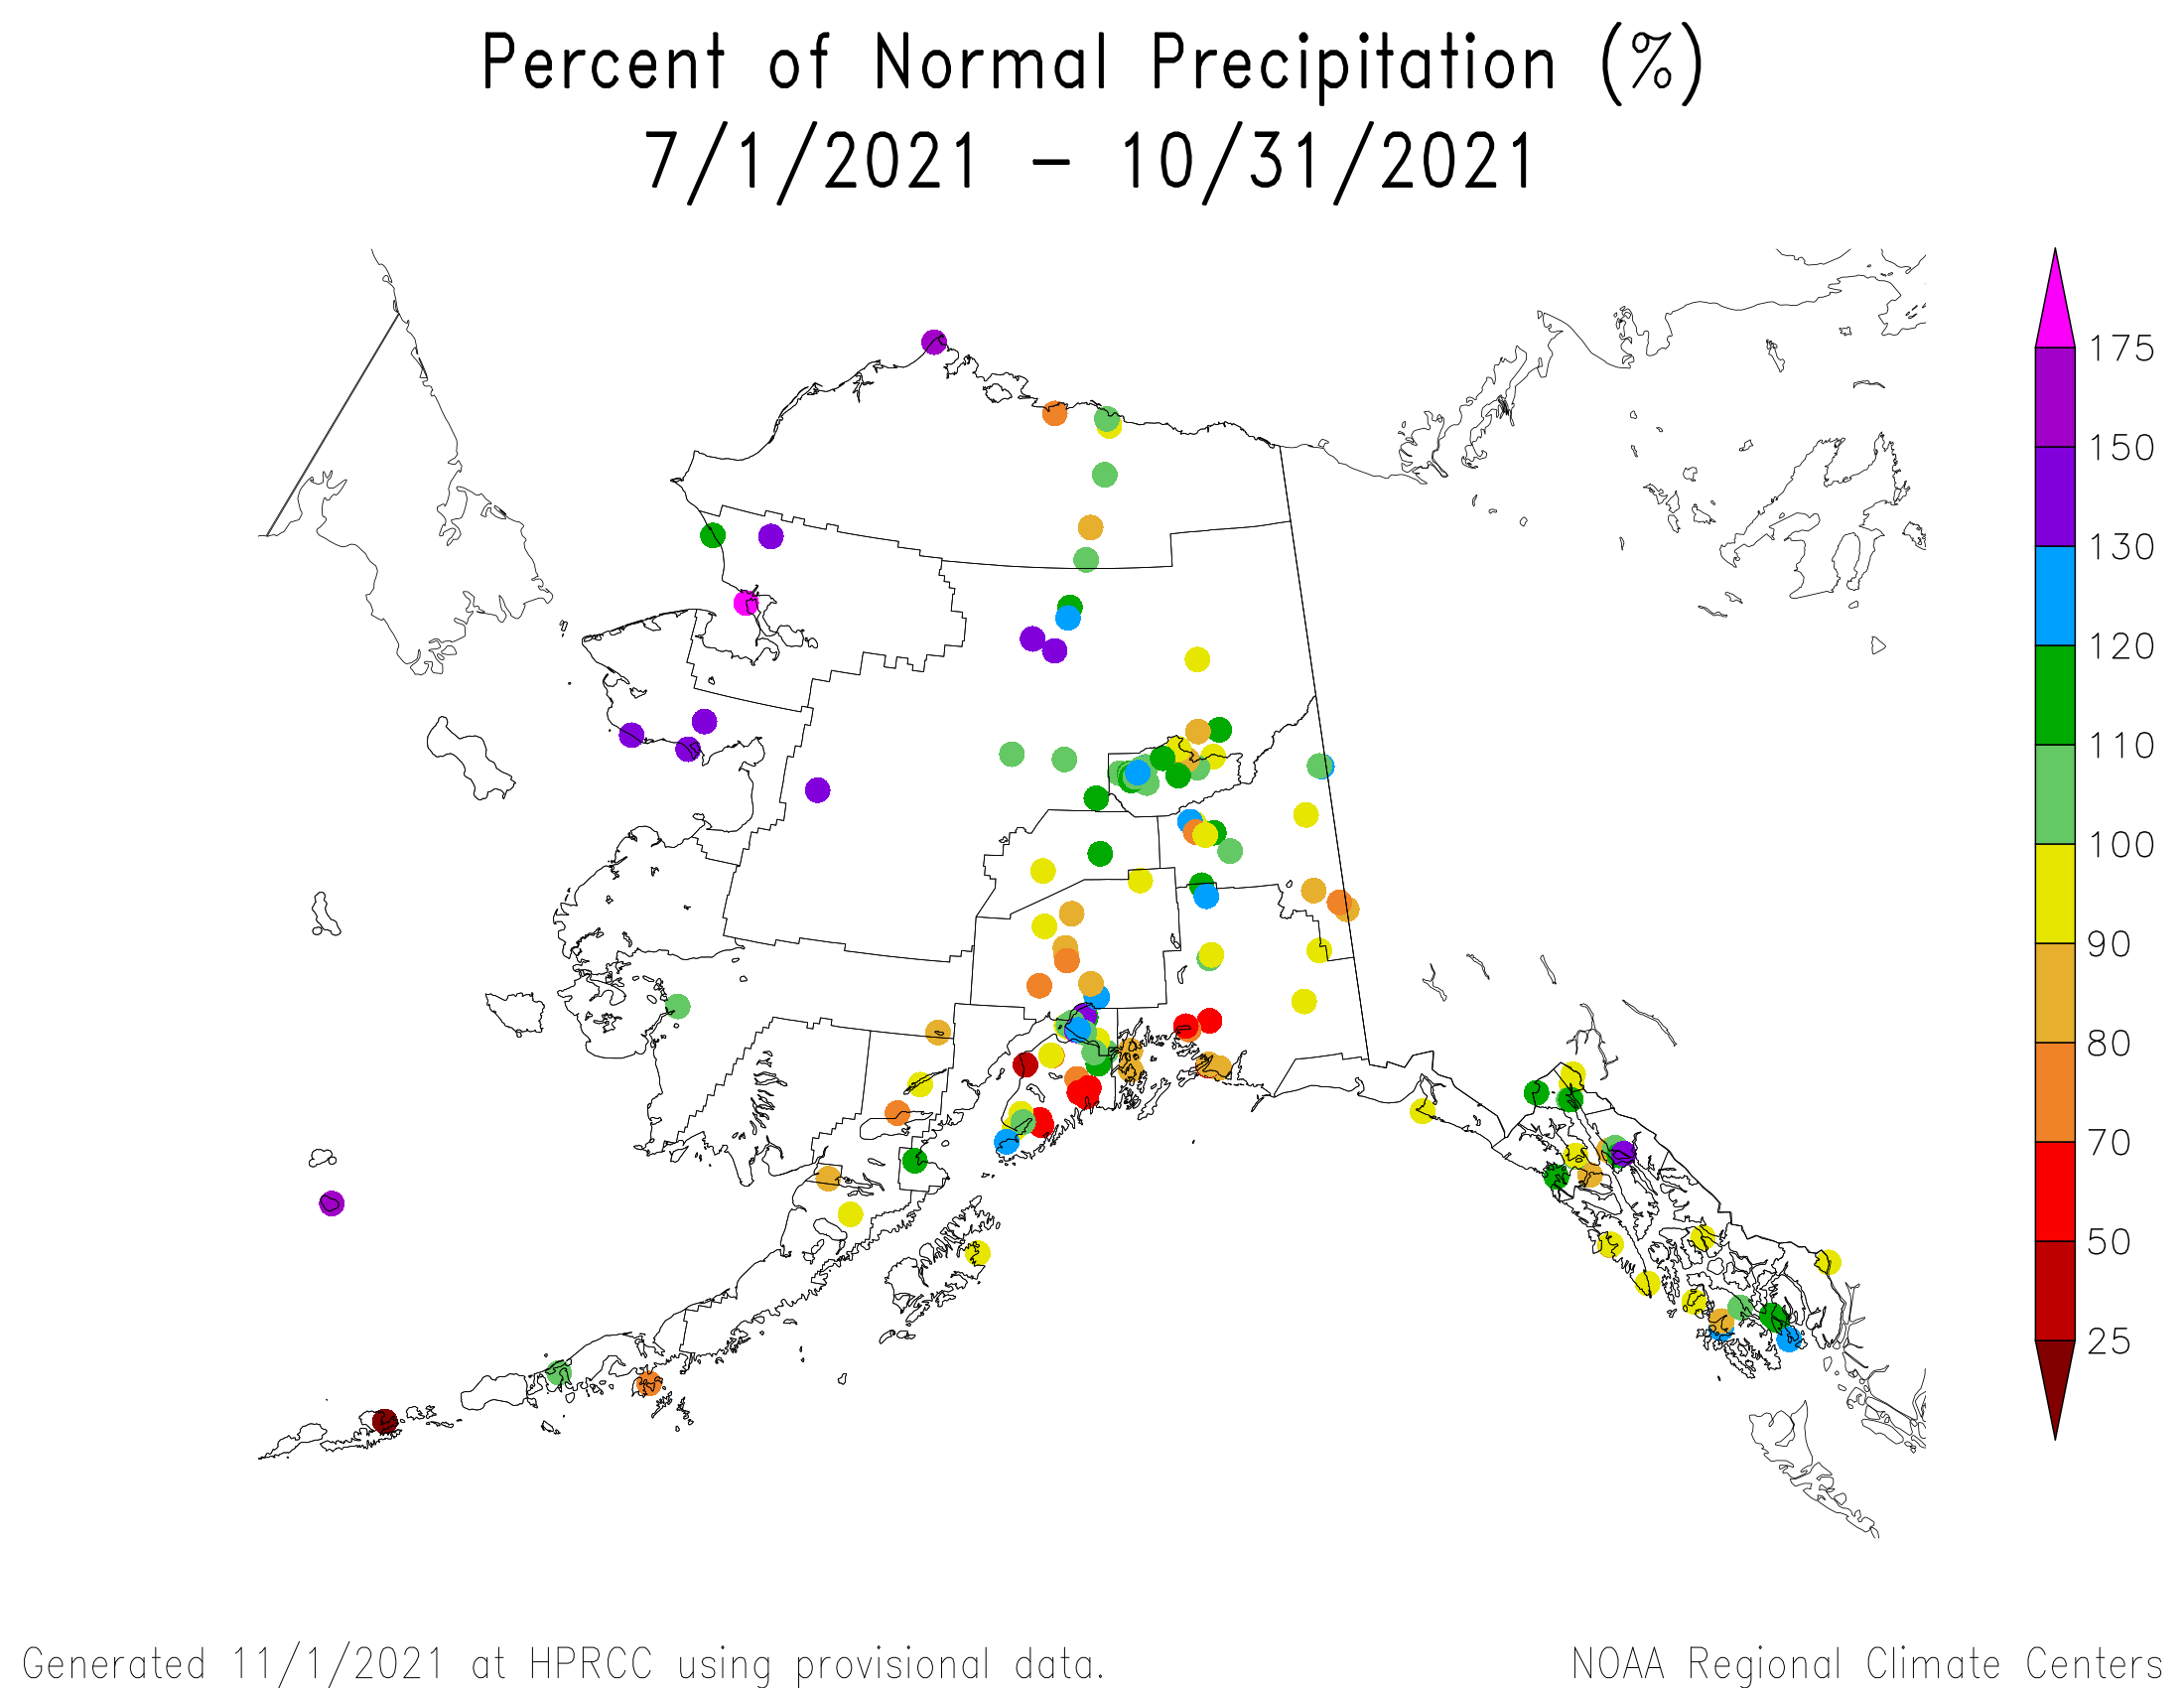
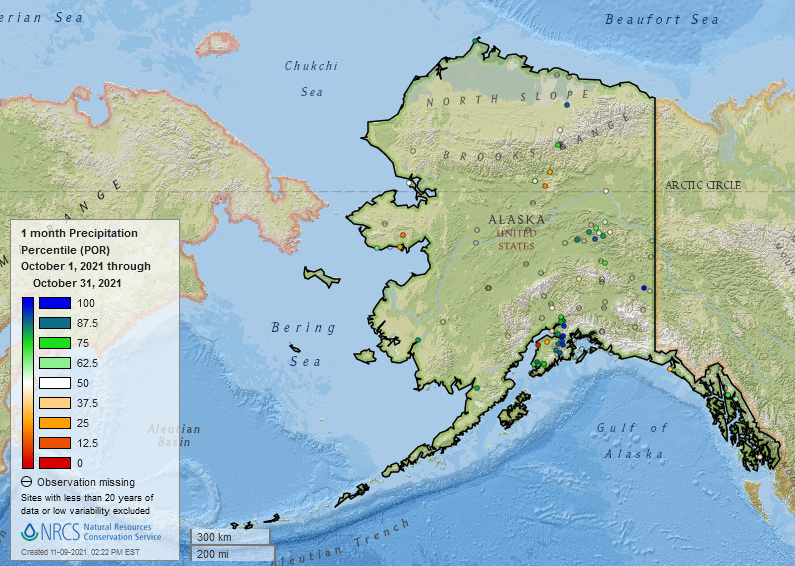
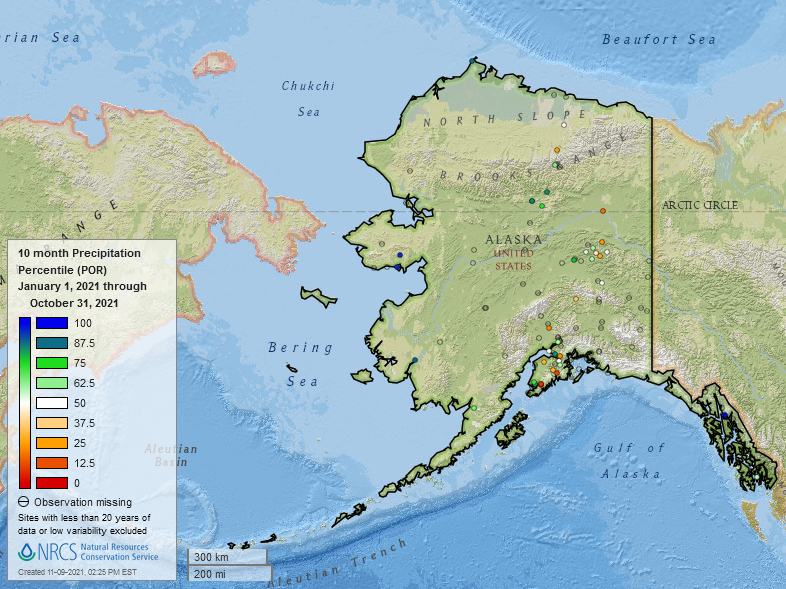
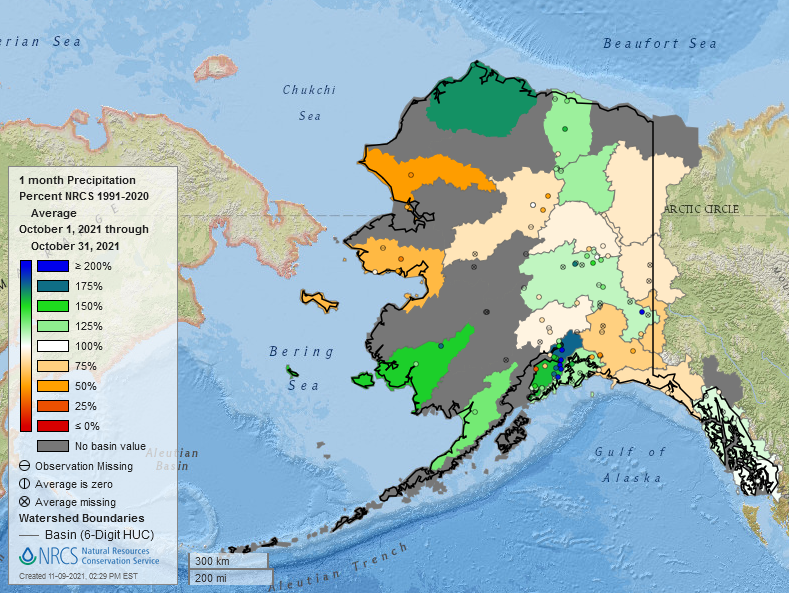
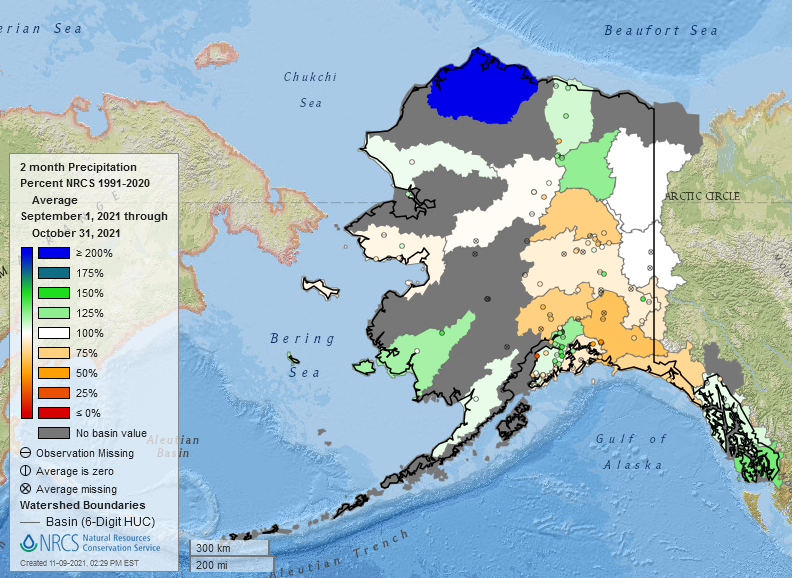
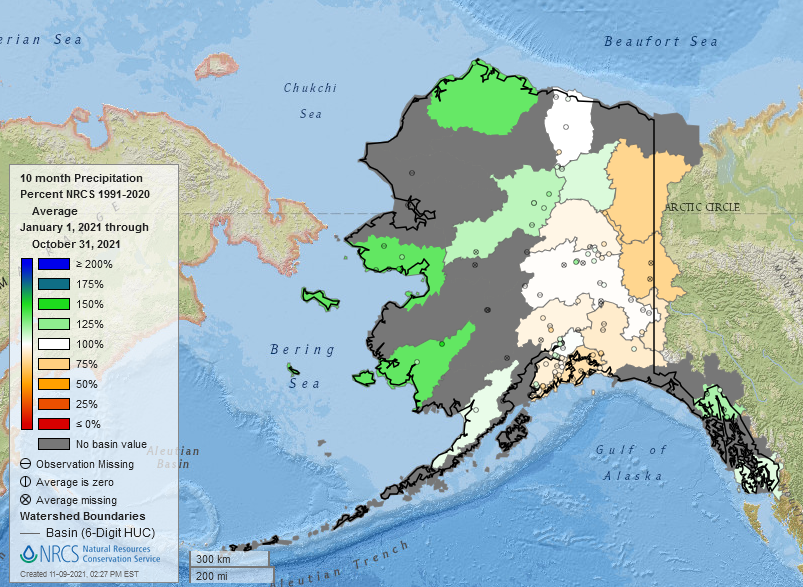
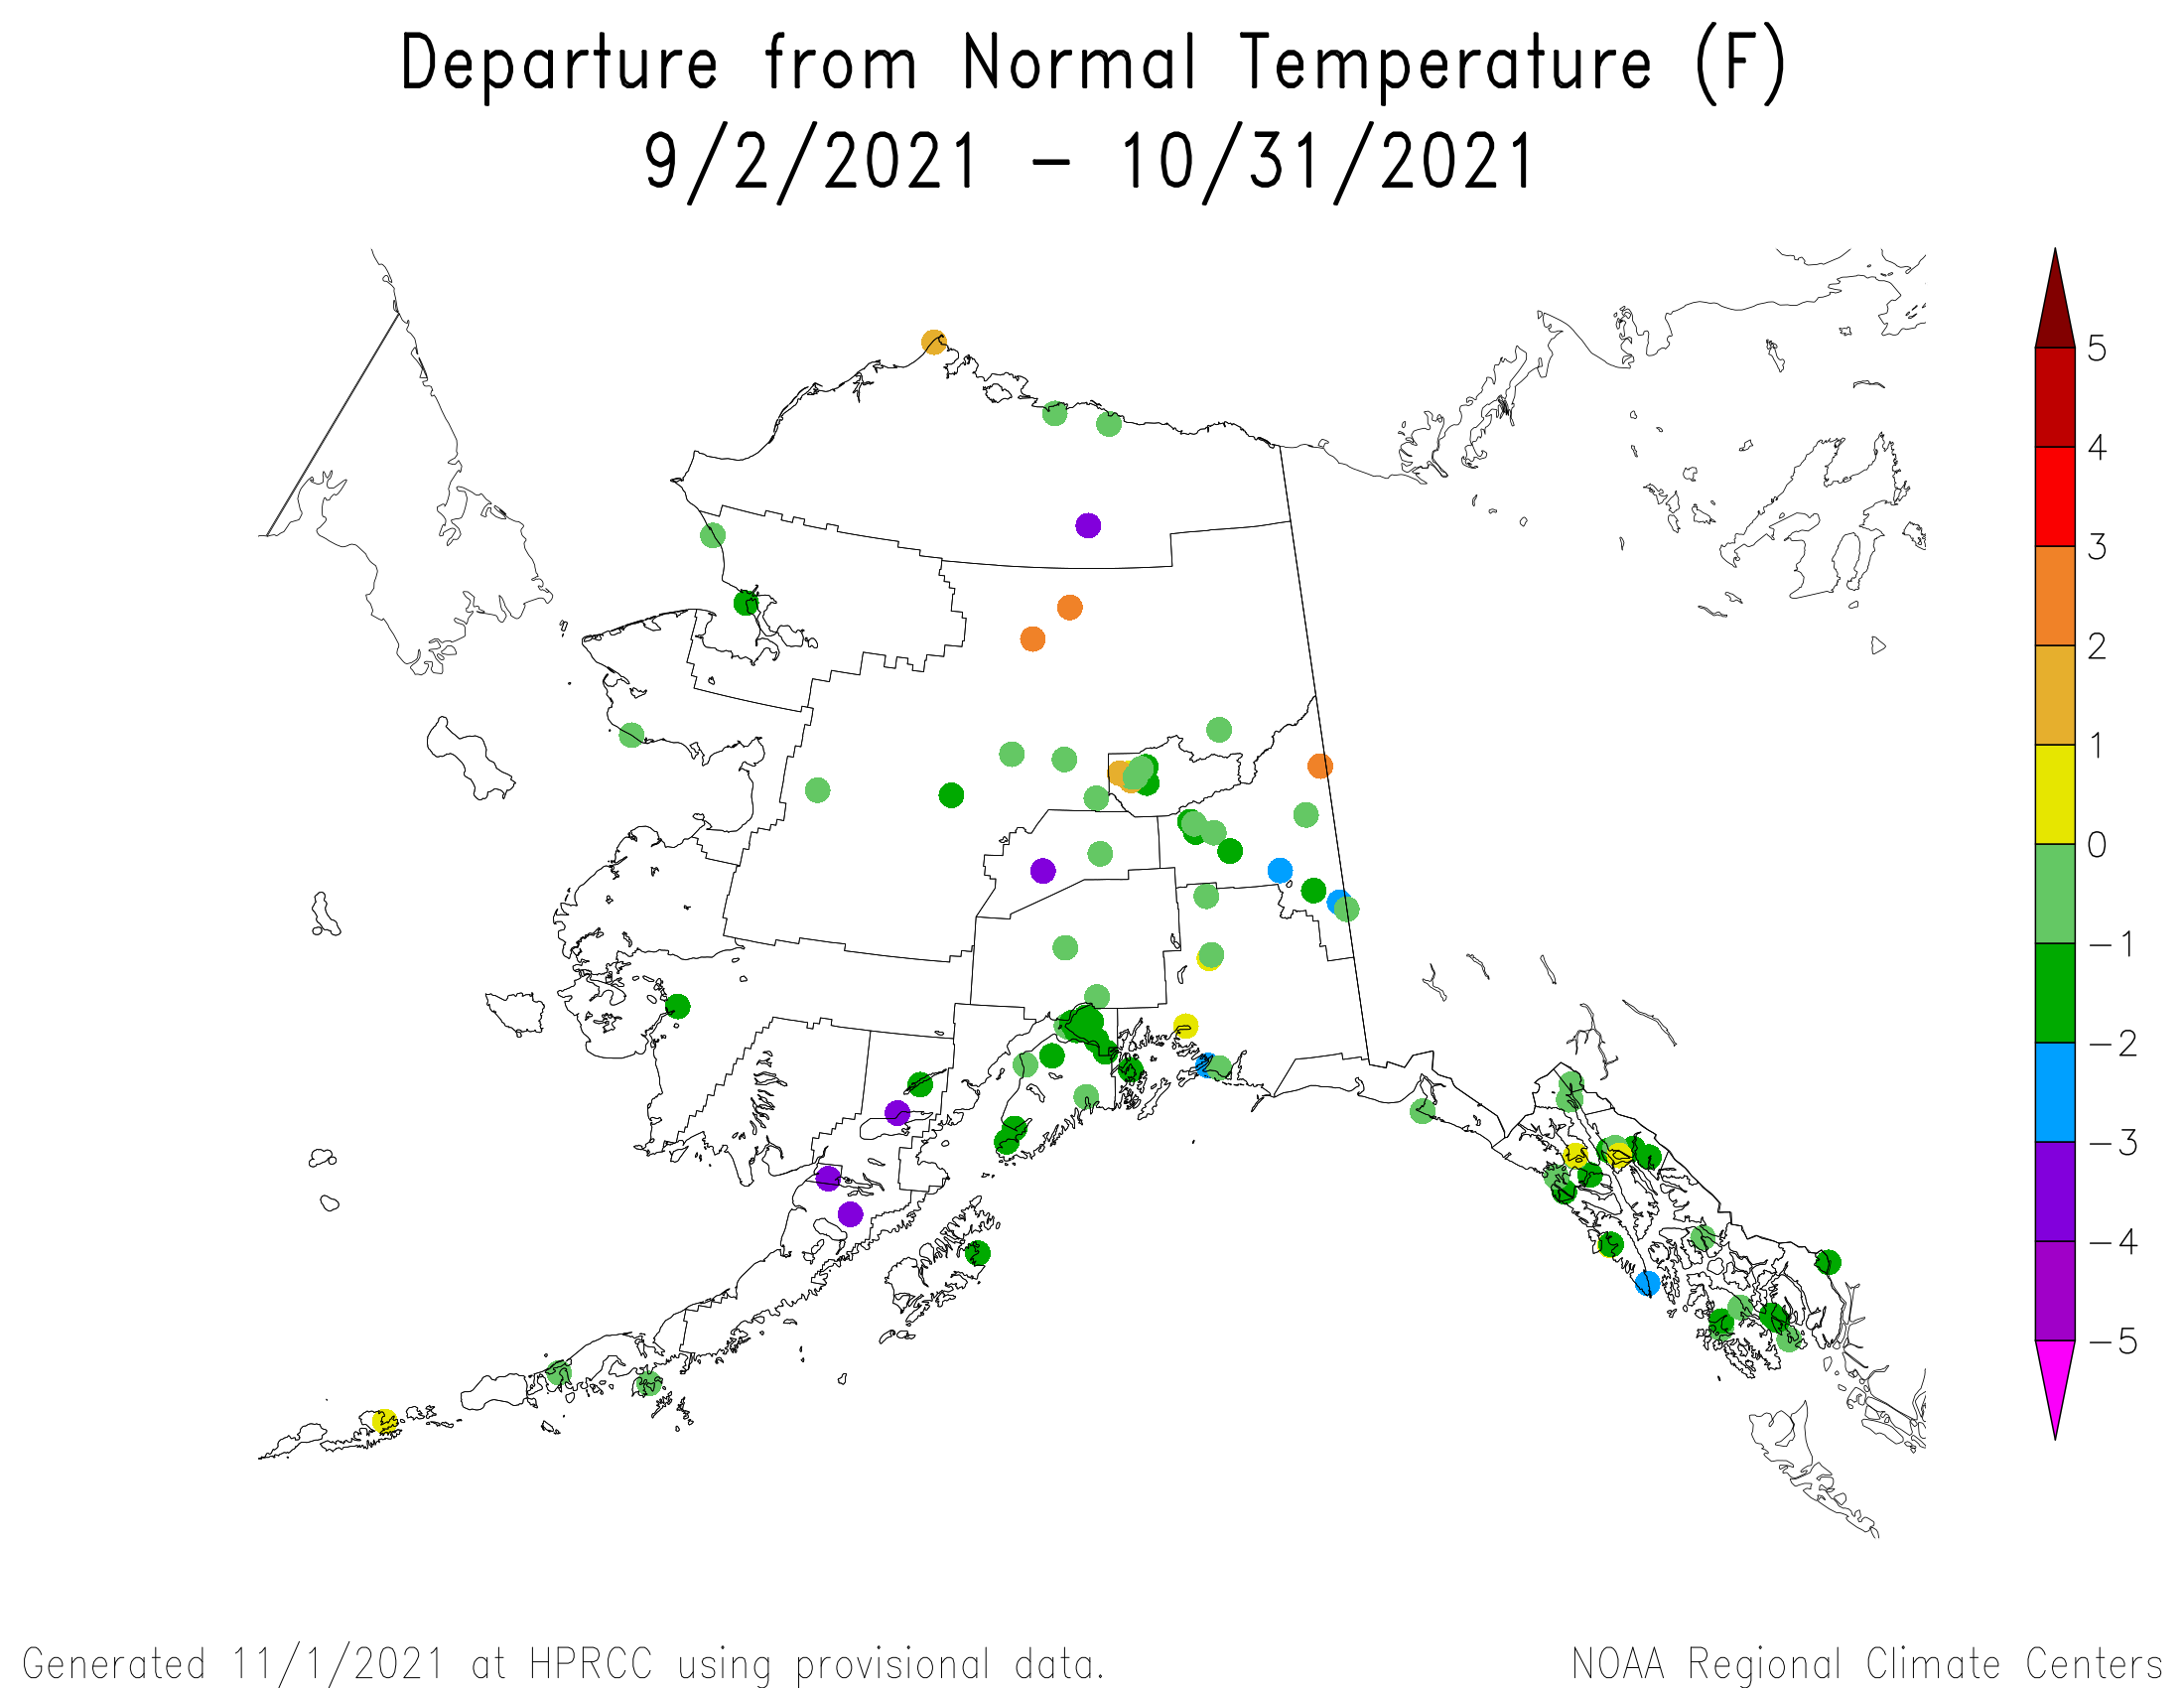
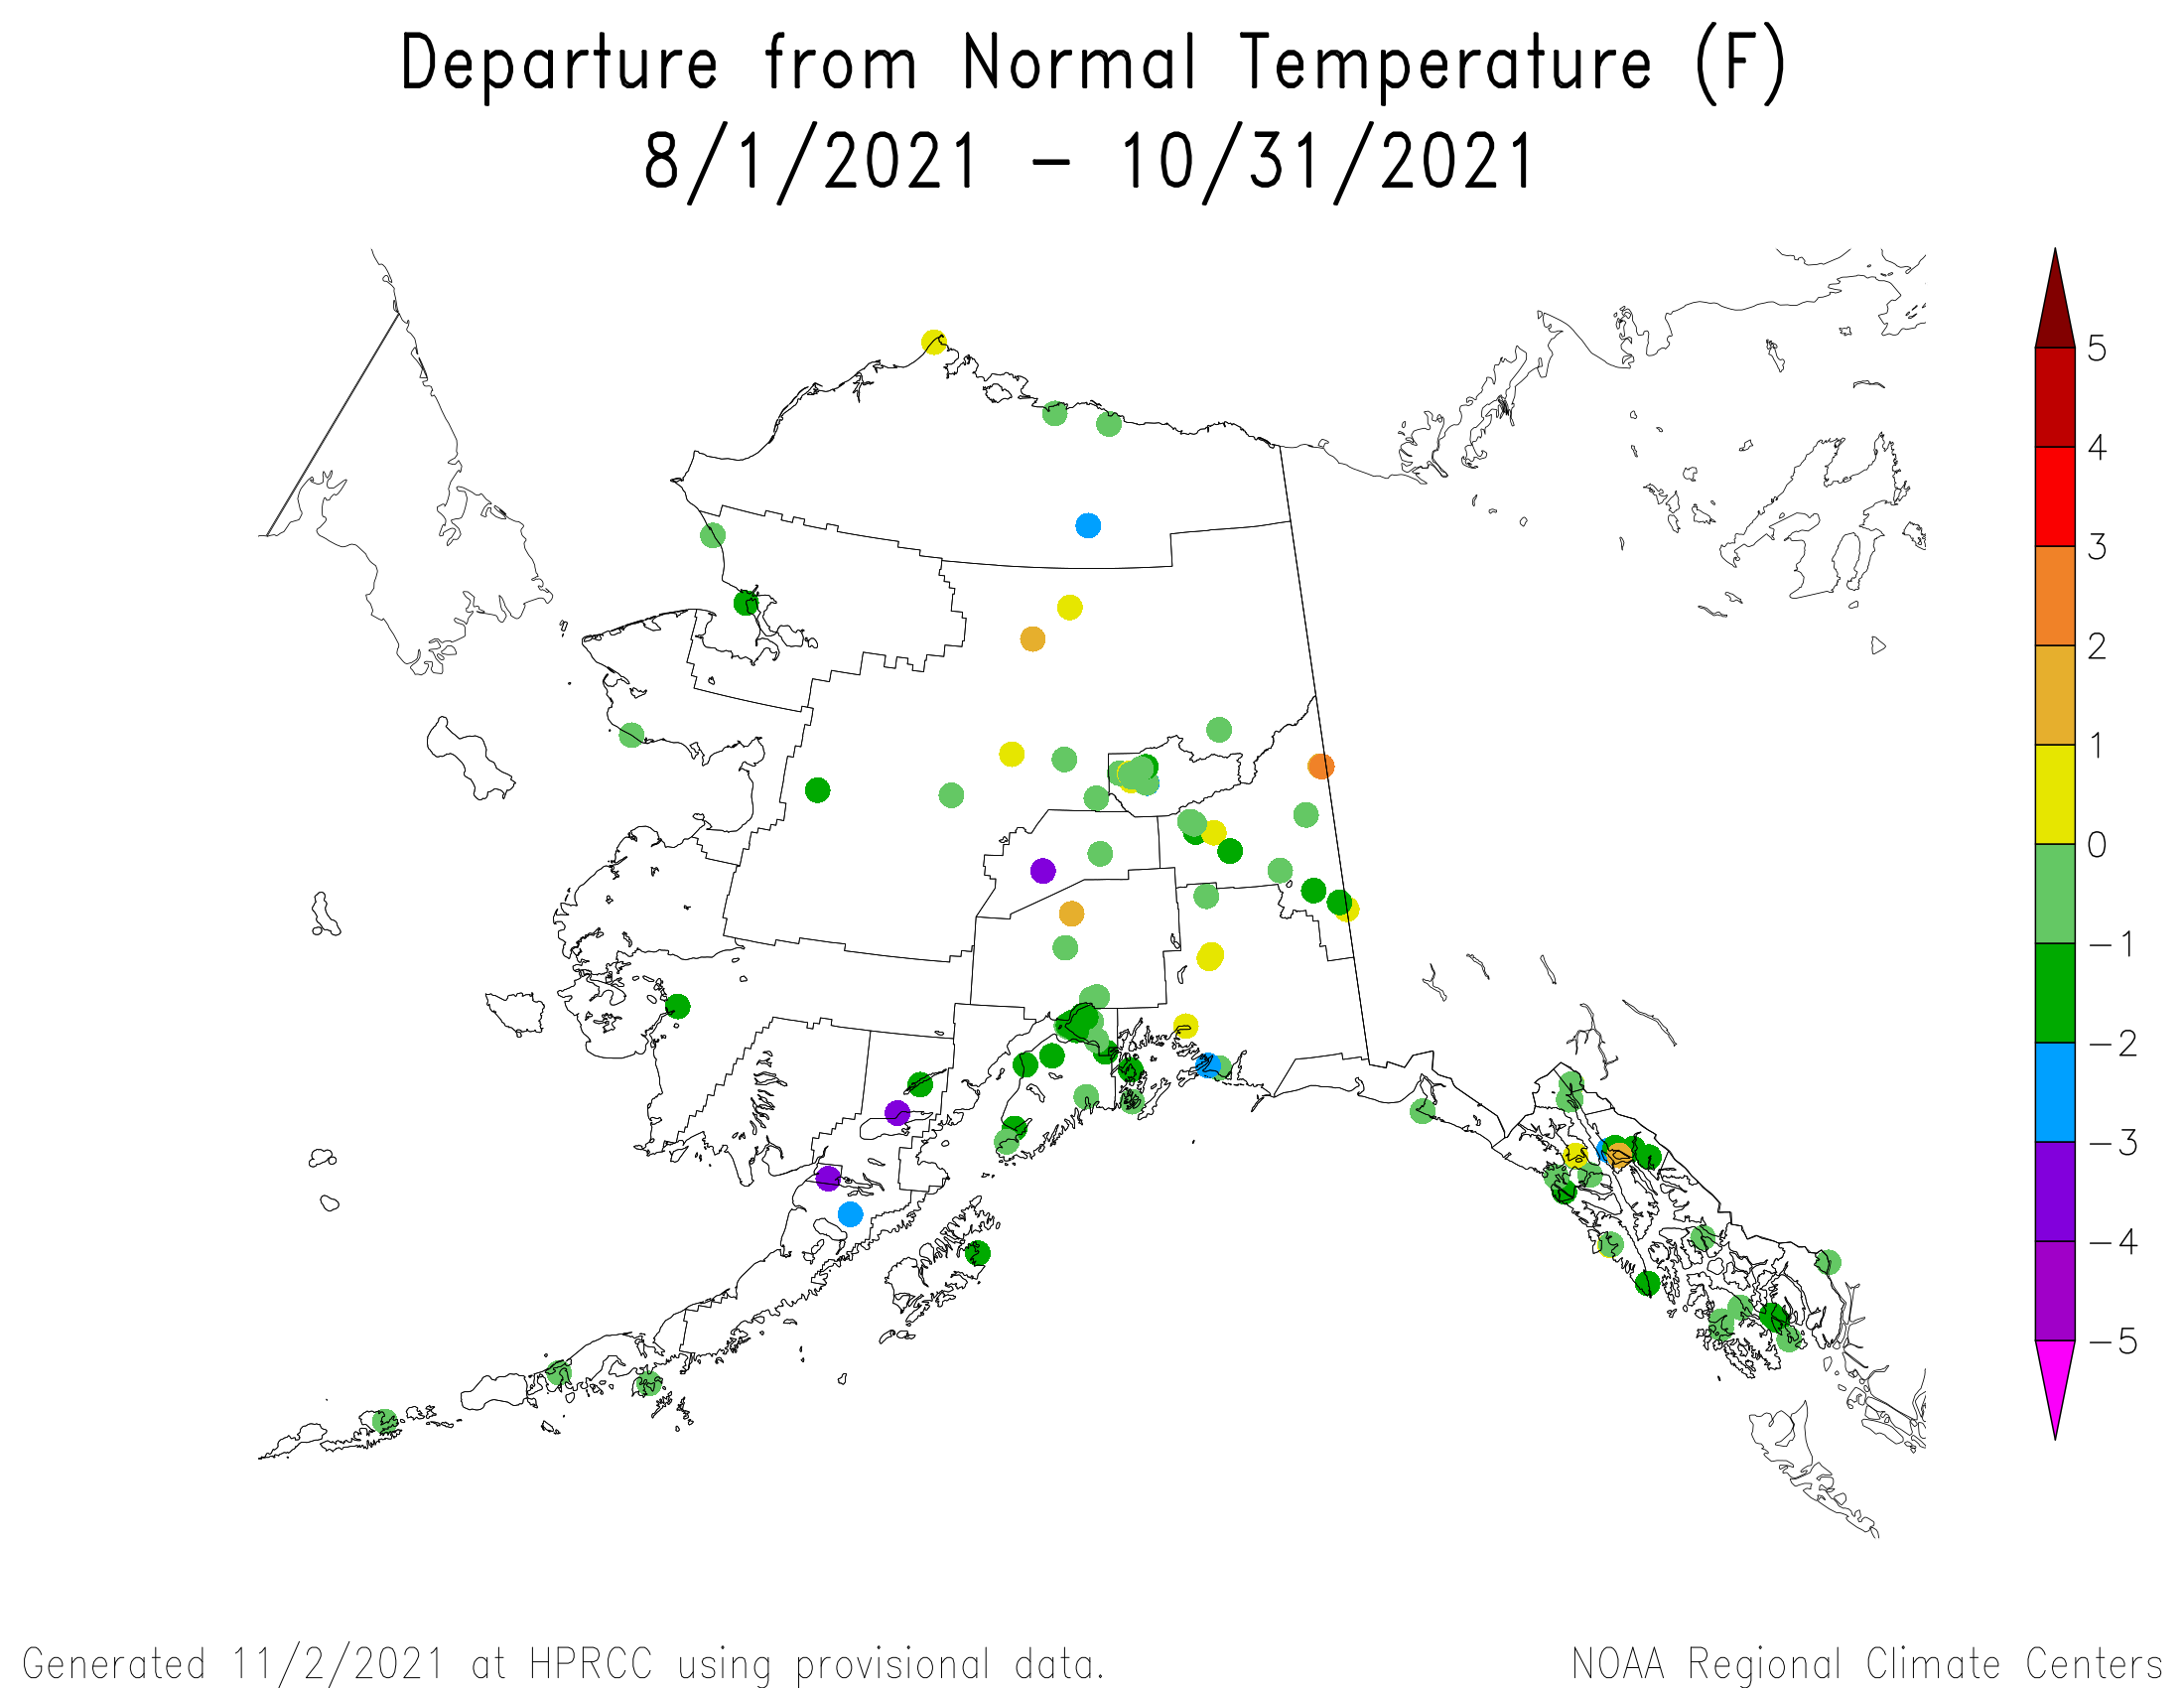
October 2021 was drier than normal across parts of northwestern, southern coastal, and eastern interior Alaska. Below-normal precipitation extended from southern coastal areas to interior Alaska at 2 months, then shifted to the Cook Inlet-Bristol Bay area at 3 to 10 months and mainly Cook Inlet at 12 months. Maps for longer time scales were not available this month (low elevation station precipitation anomaly maps for the last 1, 2, 3, 4, 6, 7, 9, 10, 12 months) (high elevation SNOTEL station precipitation percentile map for the last 1, 2, 6, and 10 months) (high elevation SNOTEL station precipitation anomaly maps for October) (SNOTEL basin precipitation anomaly map for October) (SNOTEL basin and station precipitation anomaly maps for the last 1, 2, 6, 10, 12 months) (climate division precipitation rank maps for the last 1, 3, 6, 10, and 12 months) (climate engine model percent of normal precipitation map for the last month) (Leaky Bucket model precipitation percentile map).
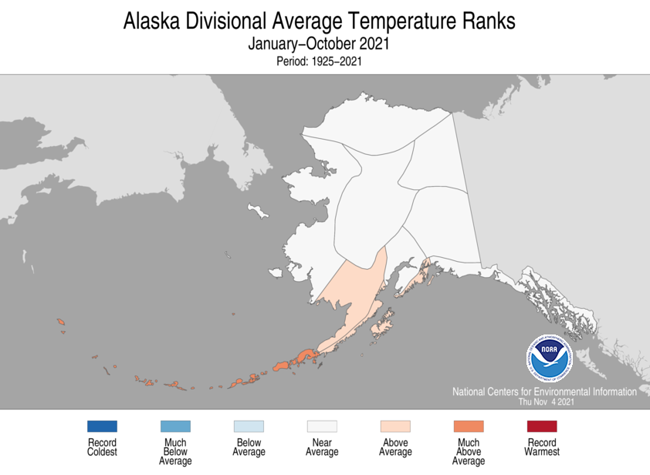
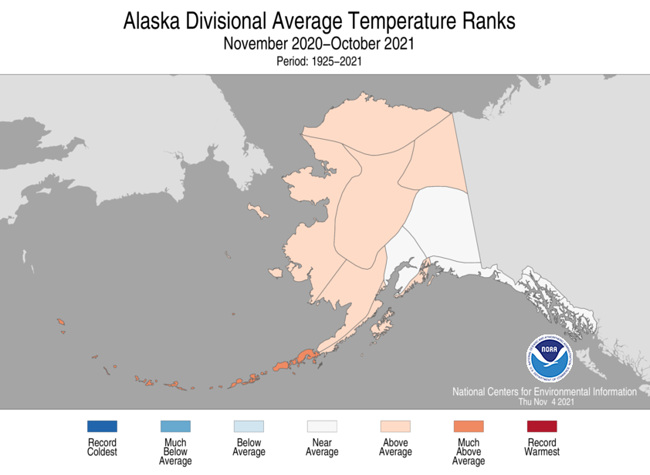
October was warmer than normal in the central to northern regions and near to cooler than normal along the west coast and in the south. Cooler-than-normal conditions dominated for the last 2-4 months. Southern to central areas were warmer than normal at the 6-month time scale. At 10 months, the southwest was warmer than normal and the rest of the state near to cooler than normal, while at 12 months the west and north were warmer than normal with near- to cooler-than-normal conditions in the central to southeast regions (low elevation station temperature anomaly maps for the last 1, 2, 3, 4, 10, 12 months) (climate division temperature rank maps for the last 1, 3, 6, 10, 12 months) (Leaky Bucket model temperature percentile map).
Monthly streamflow (for those streams that were not frozen) was mostly near normal with some below-normal streamflows in the Cook Inlet and Bristol Bay regions and panhandle. There was no drought or abnormal dryness on the November 2nd USDM map.
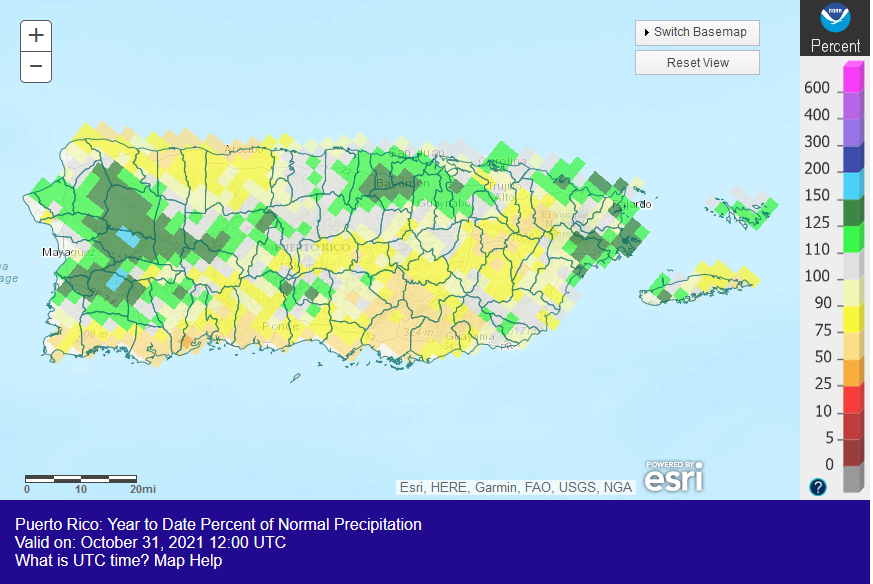
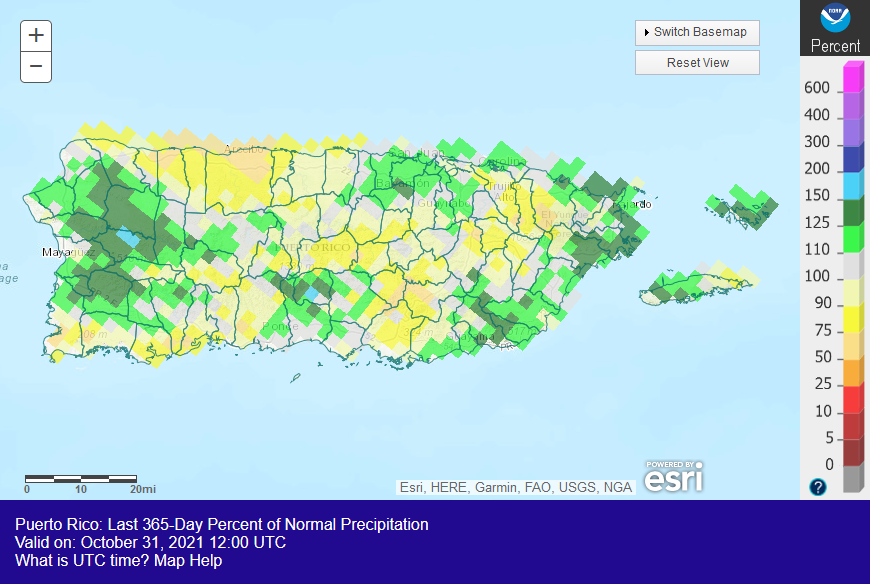
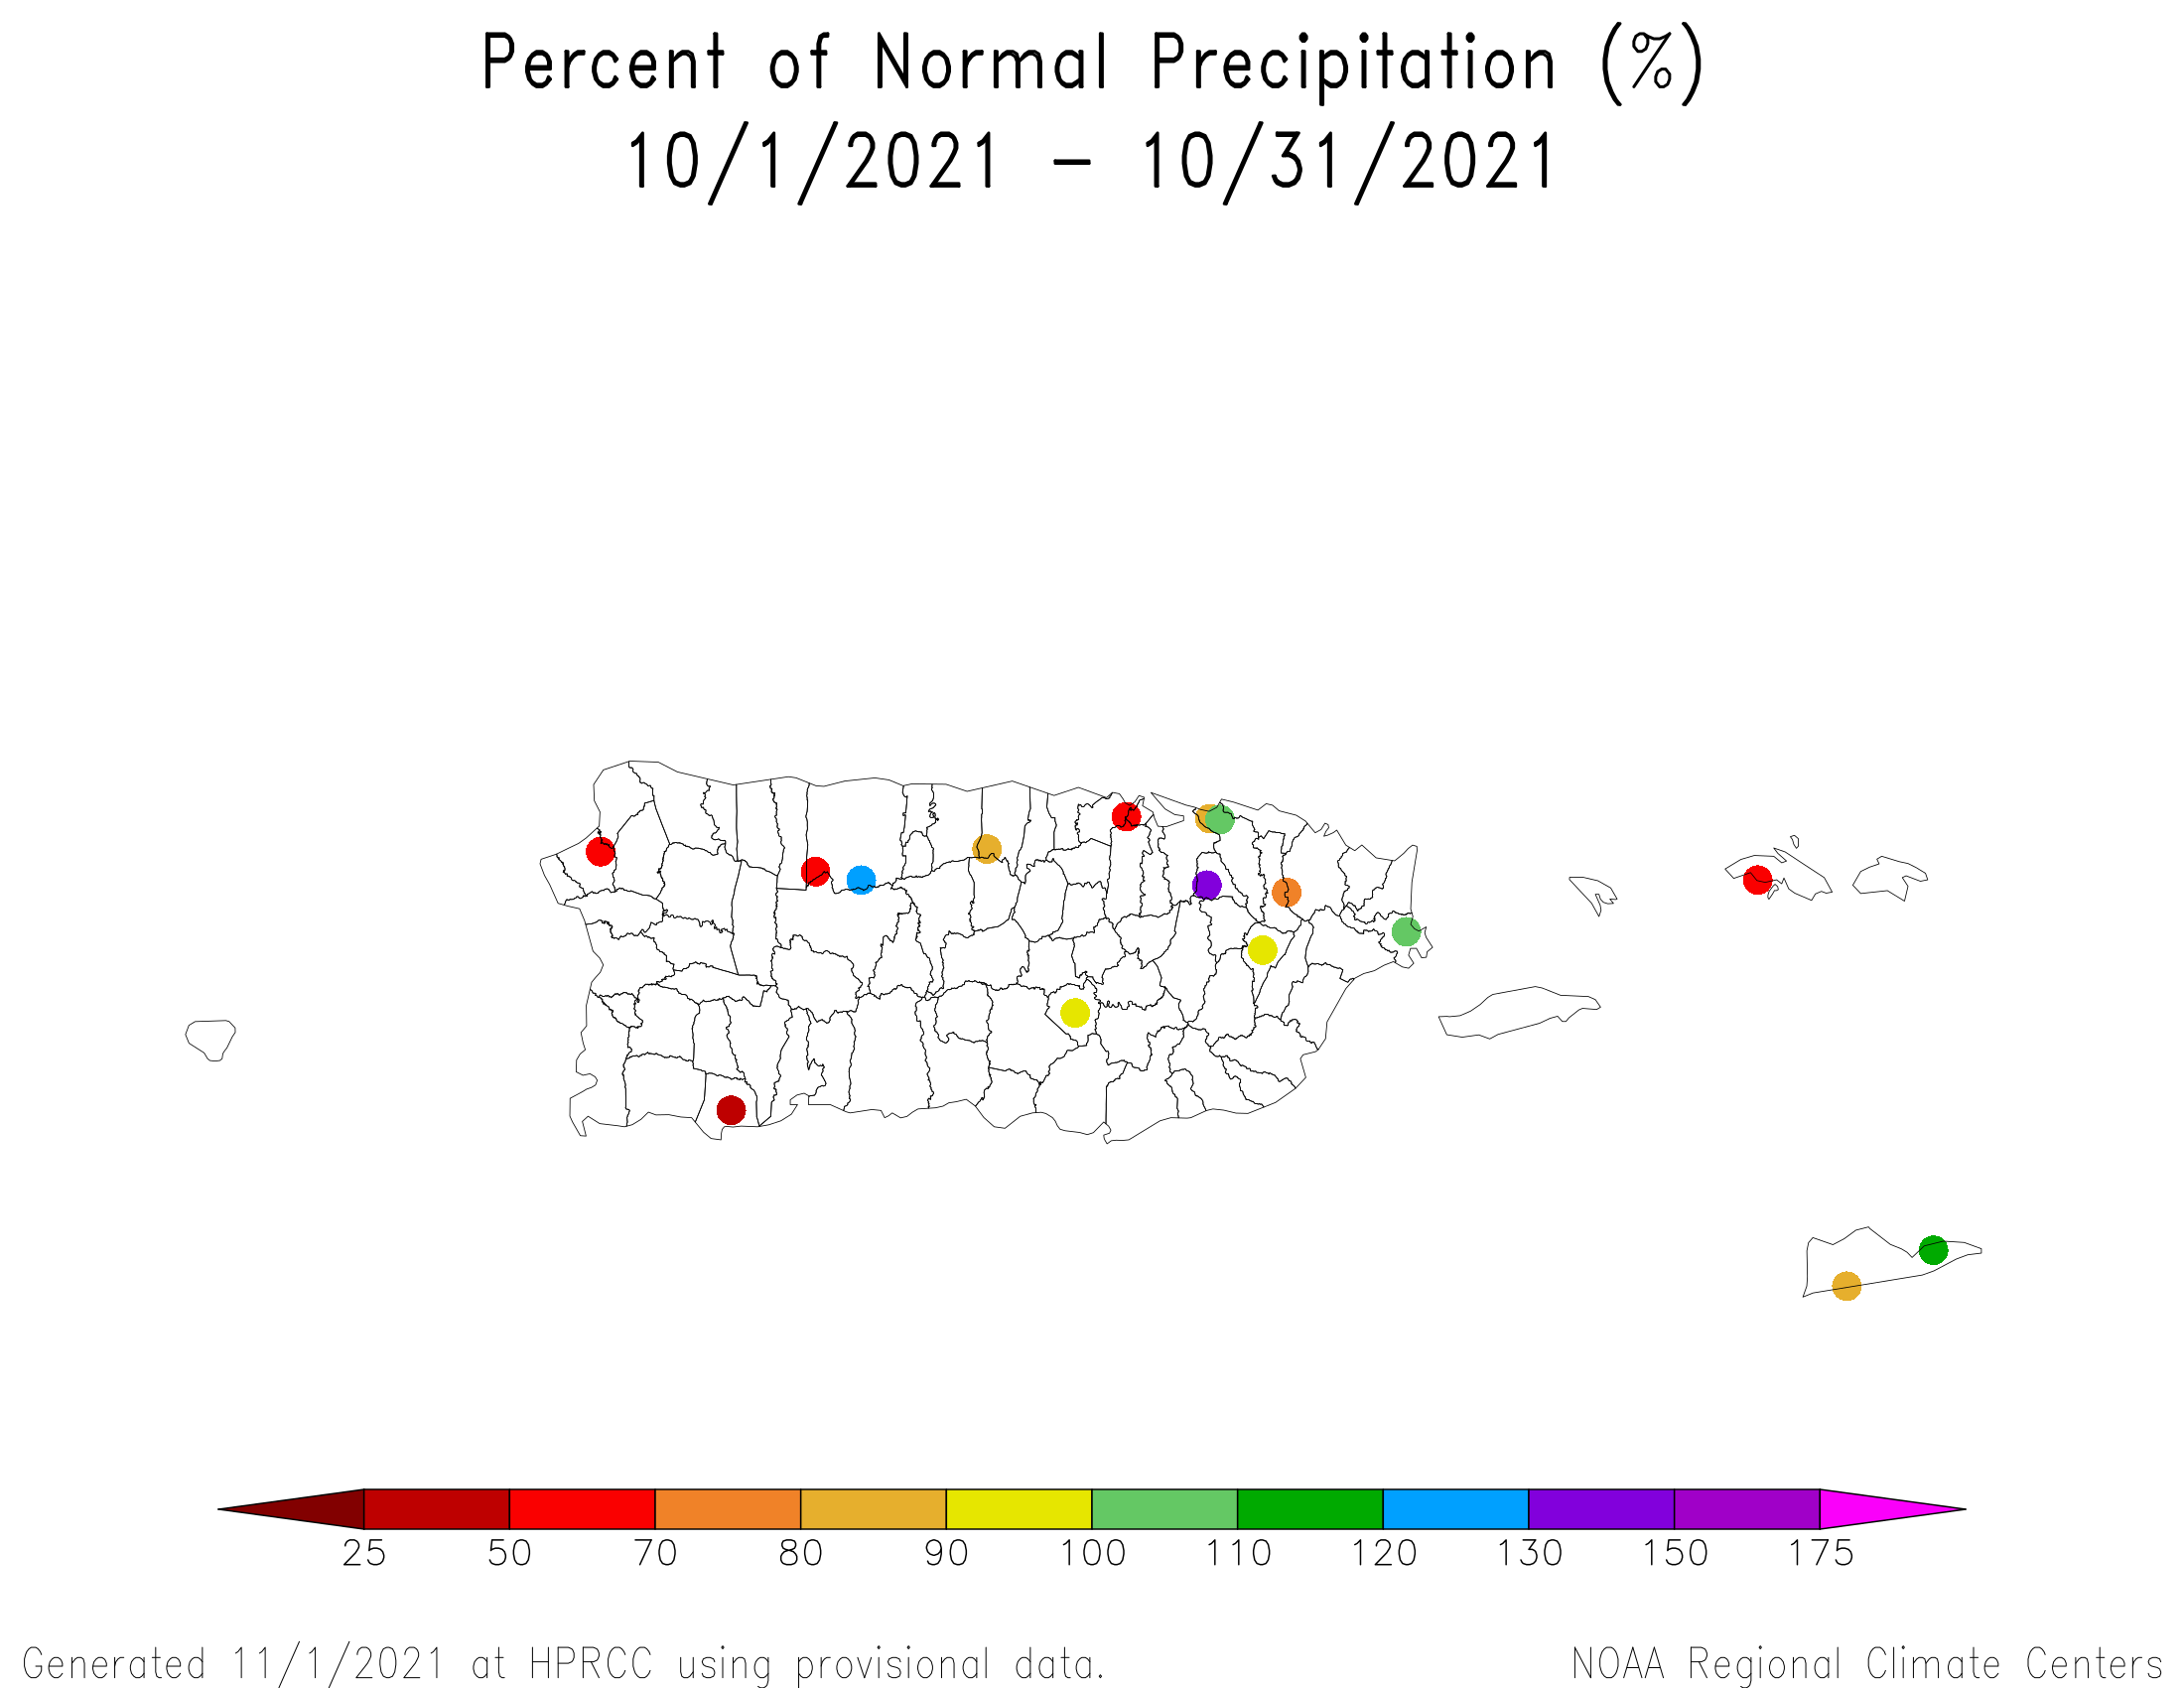
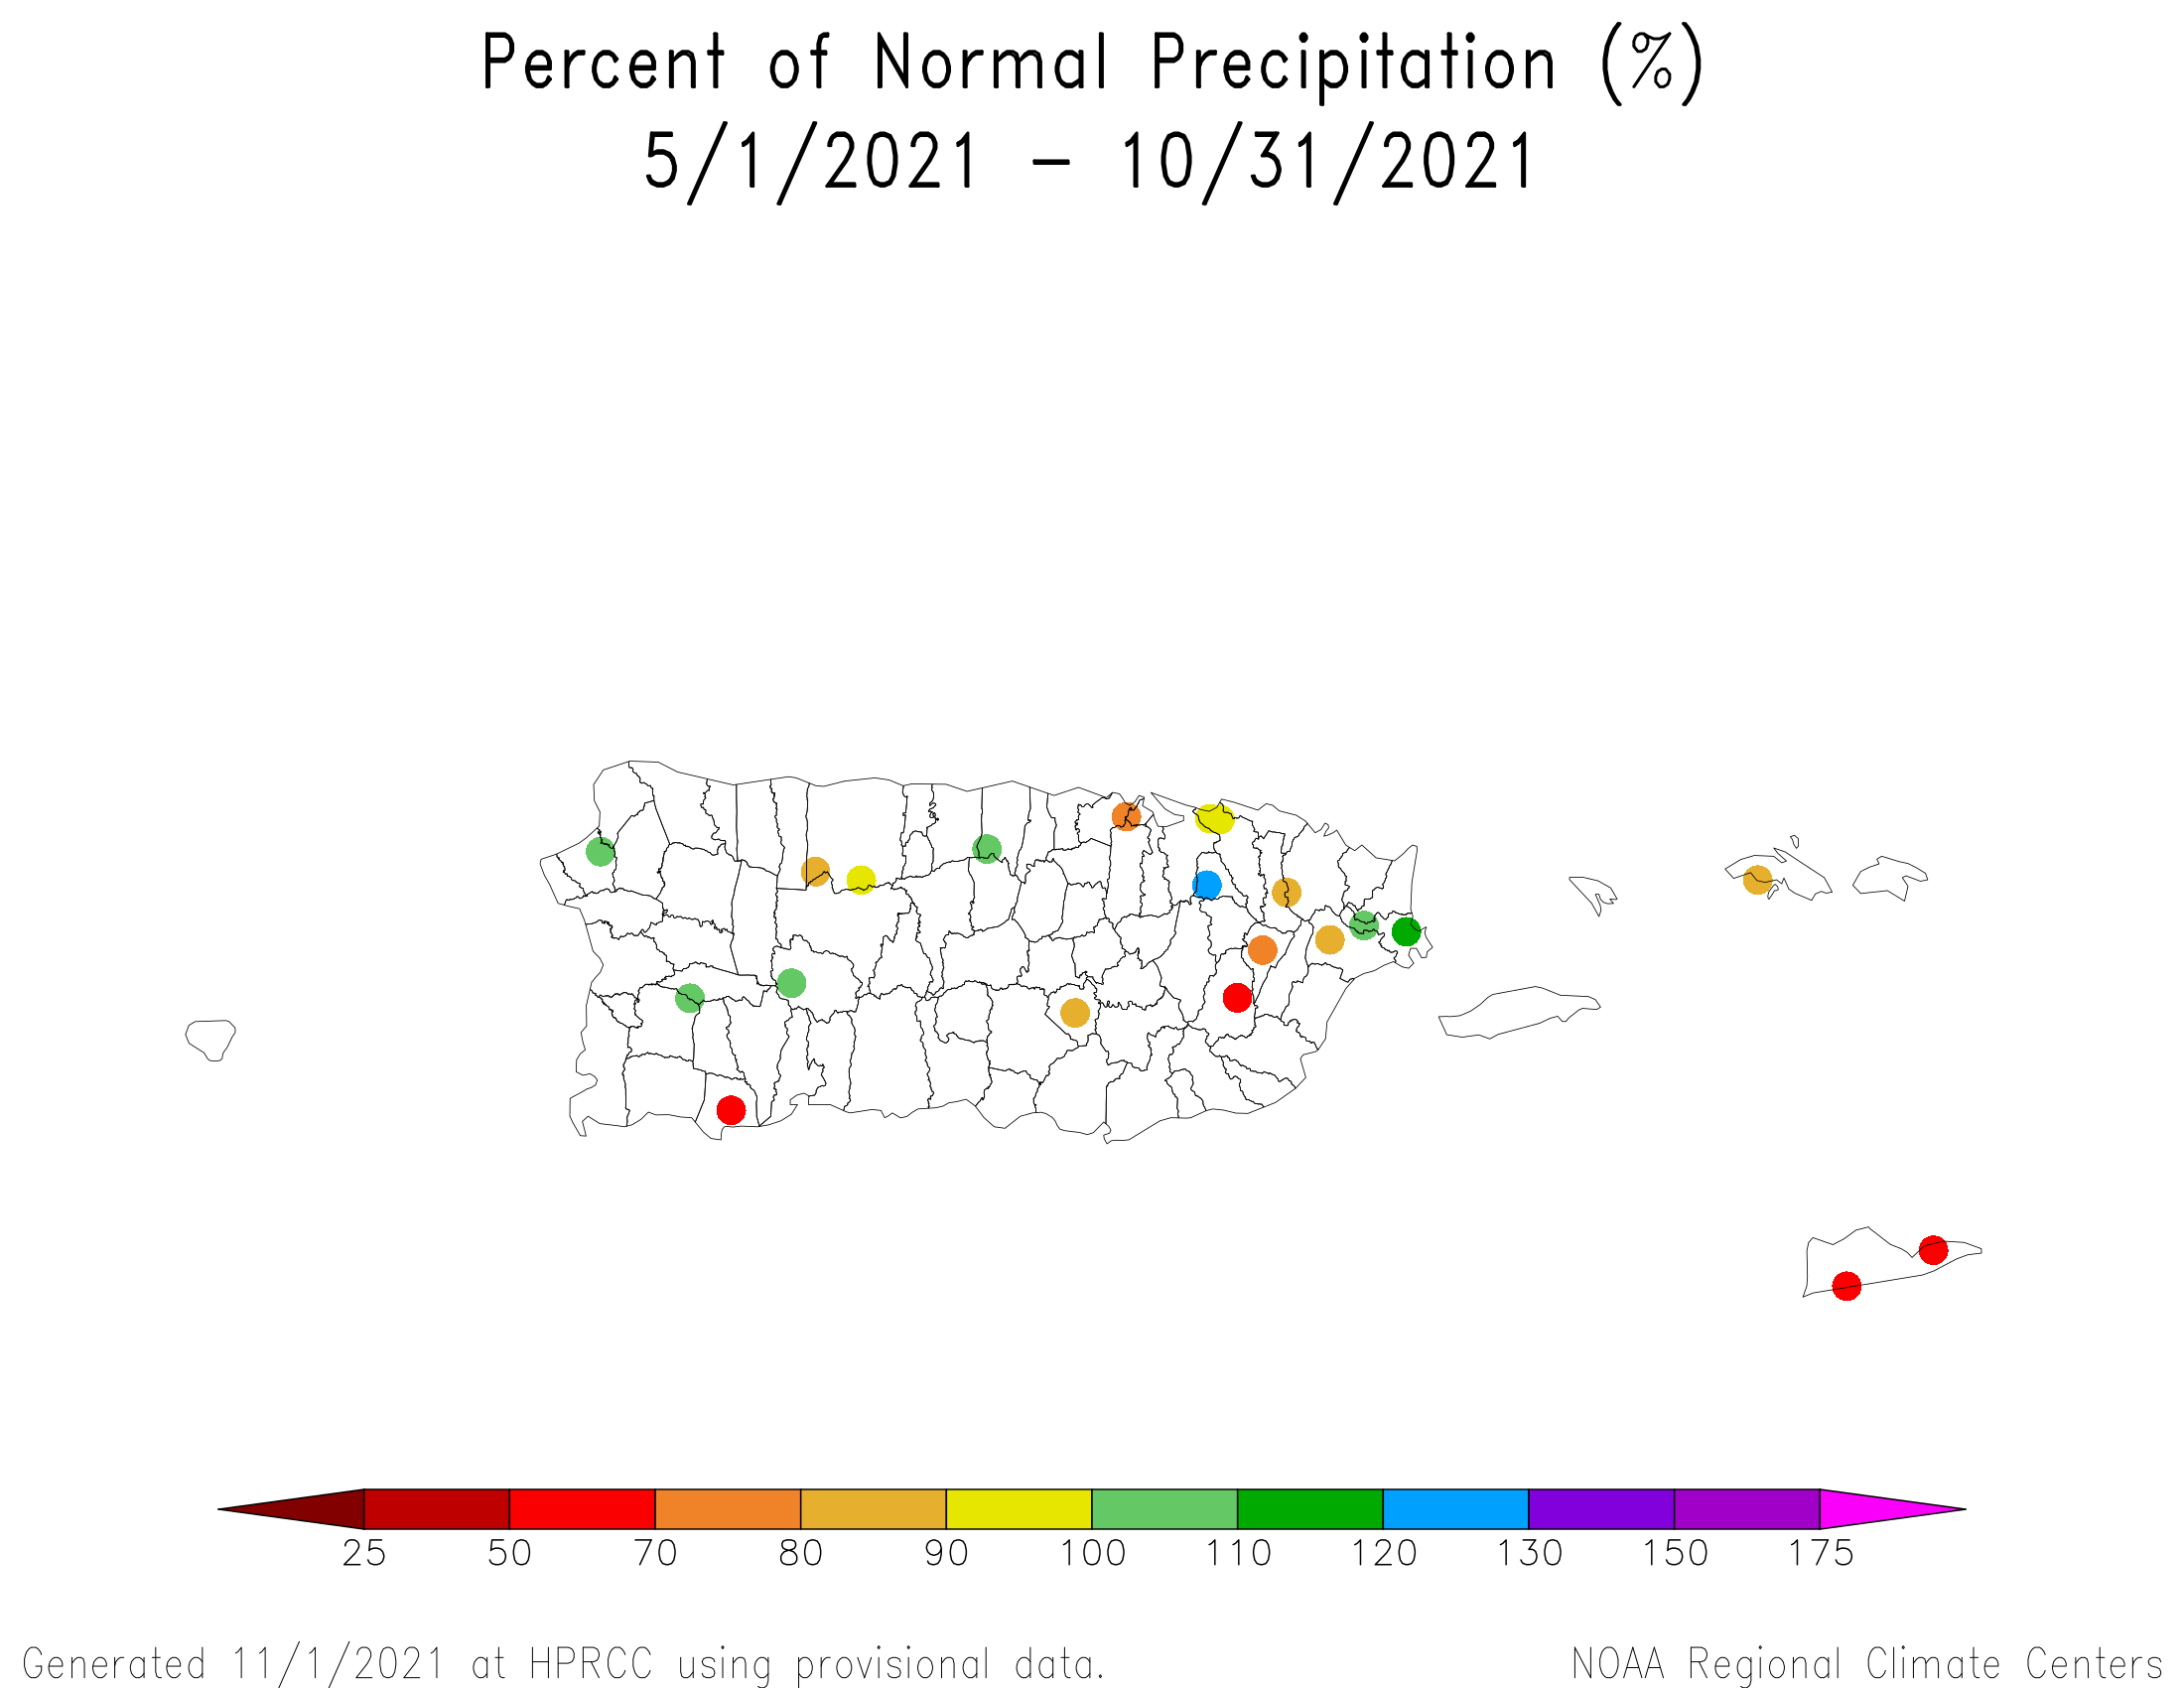
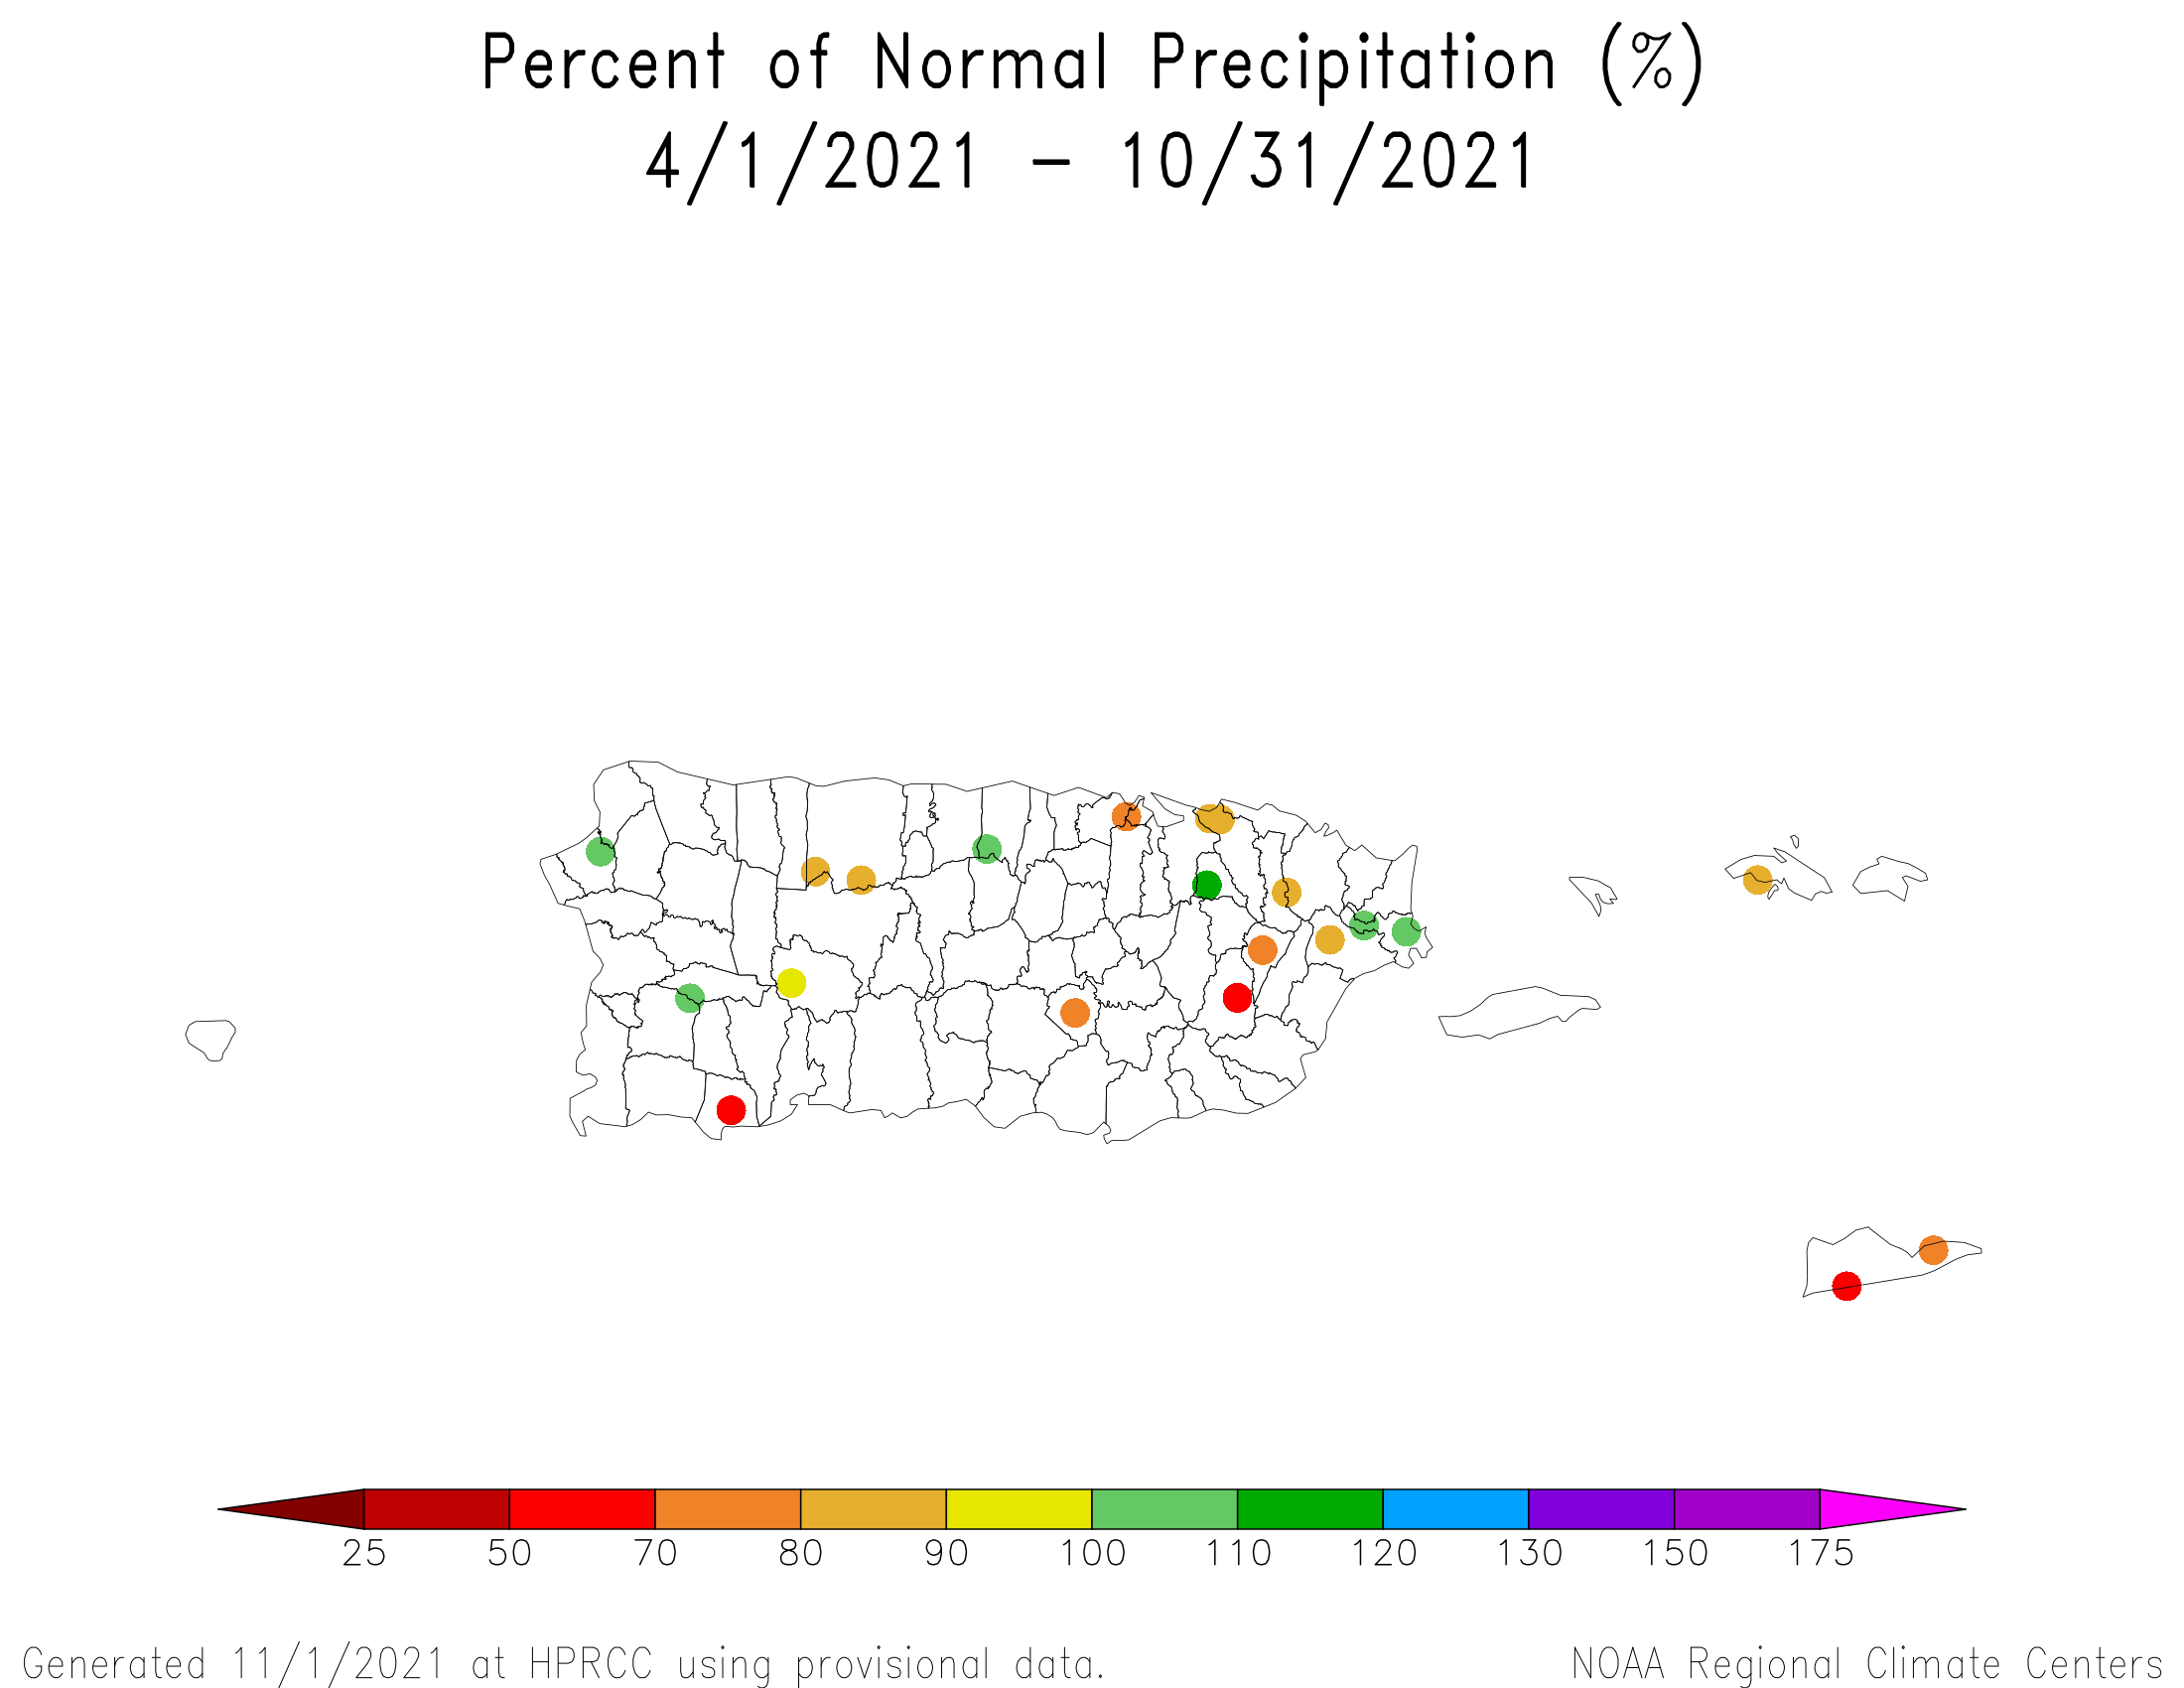
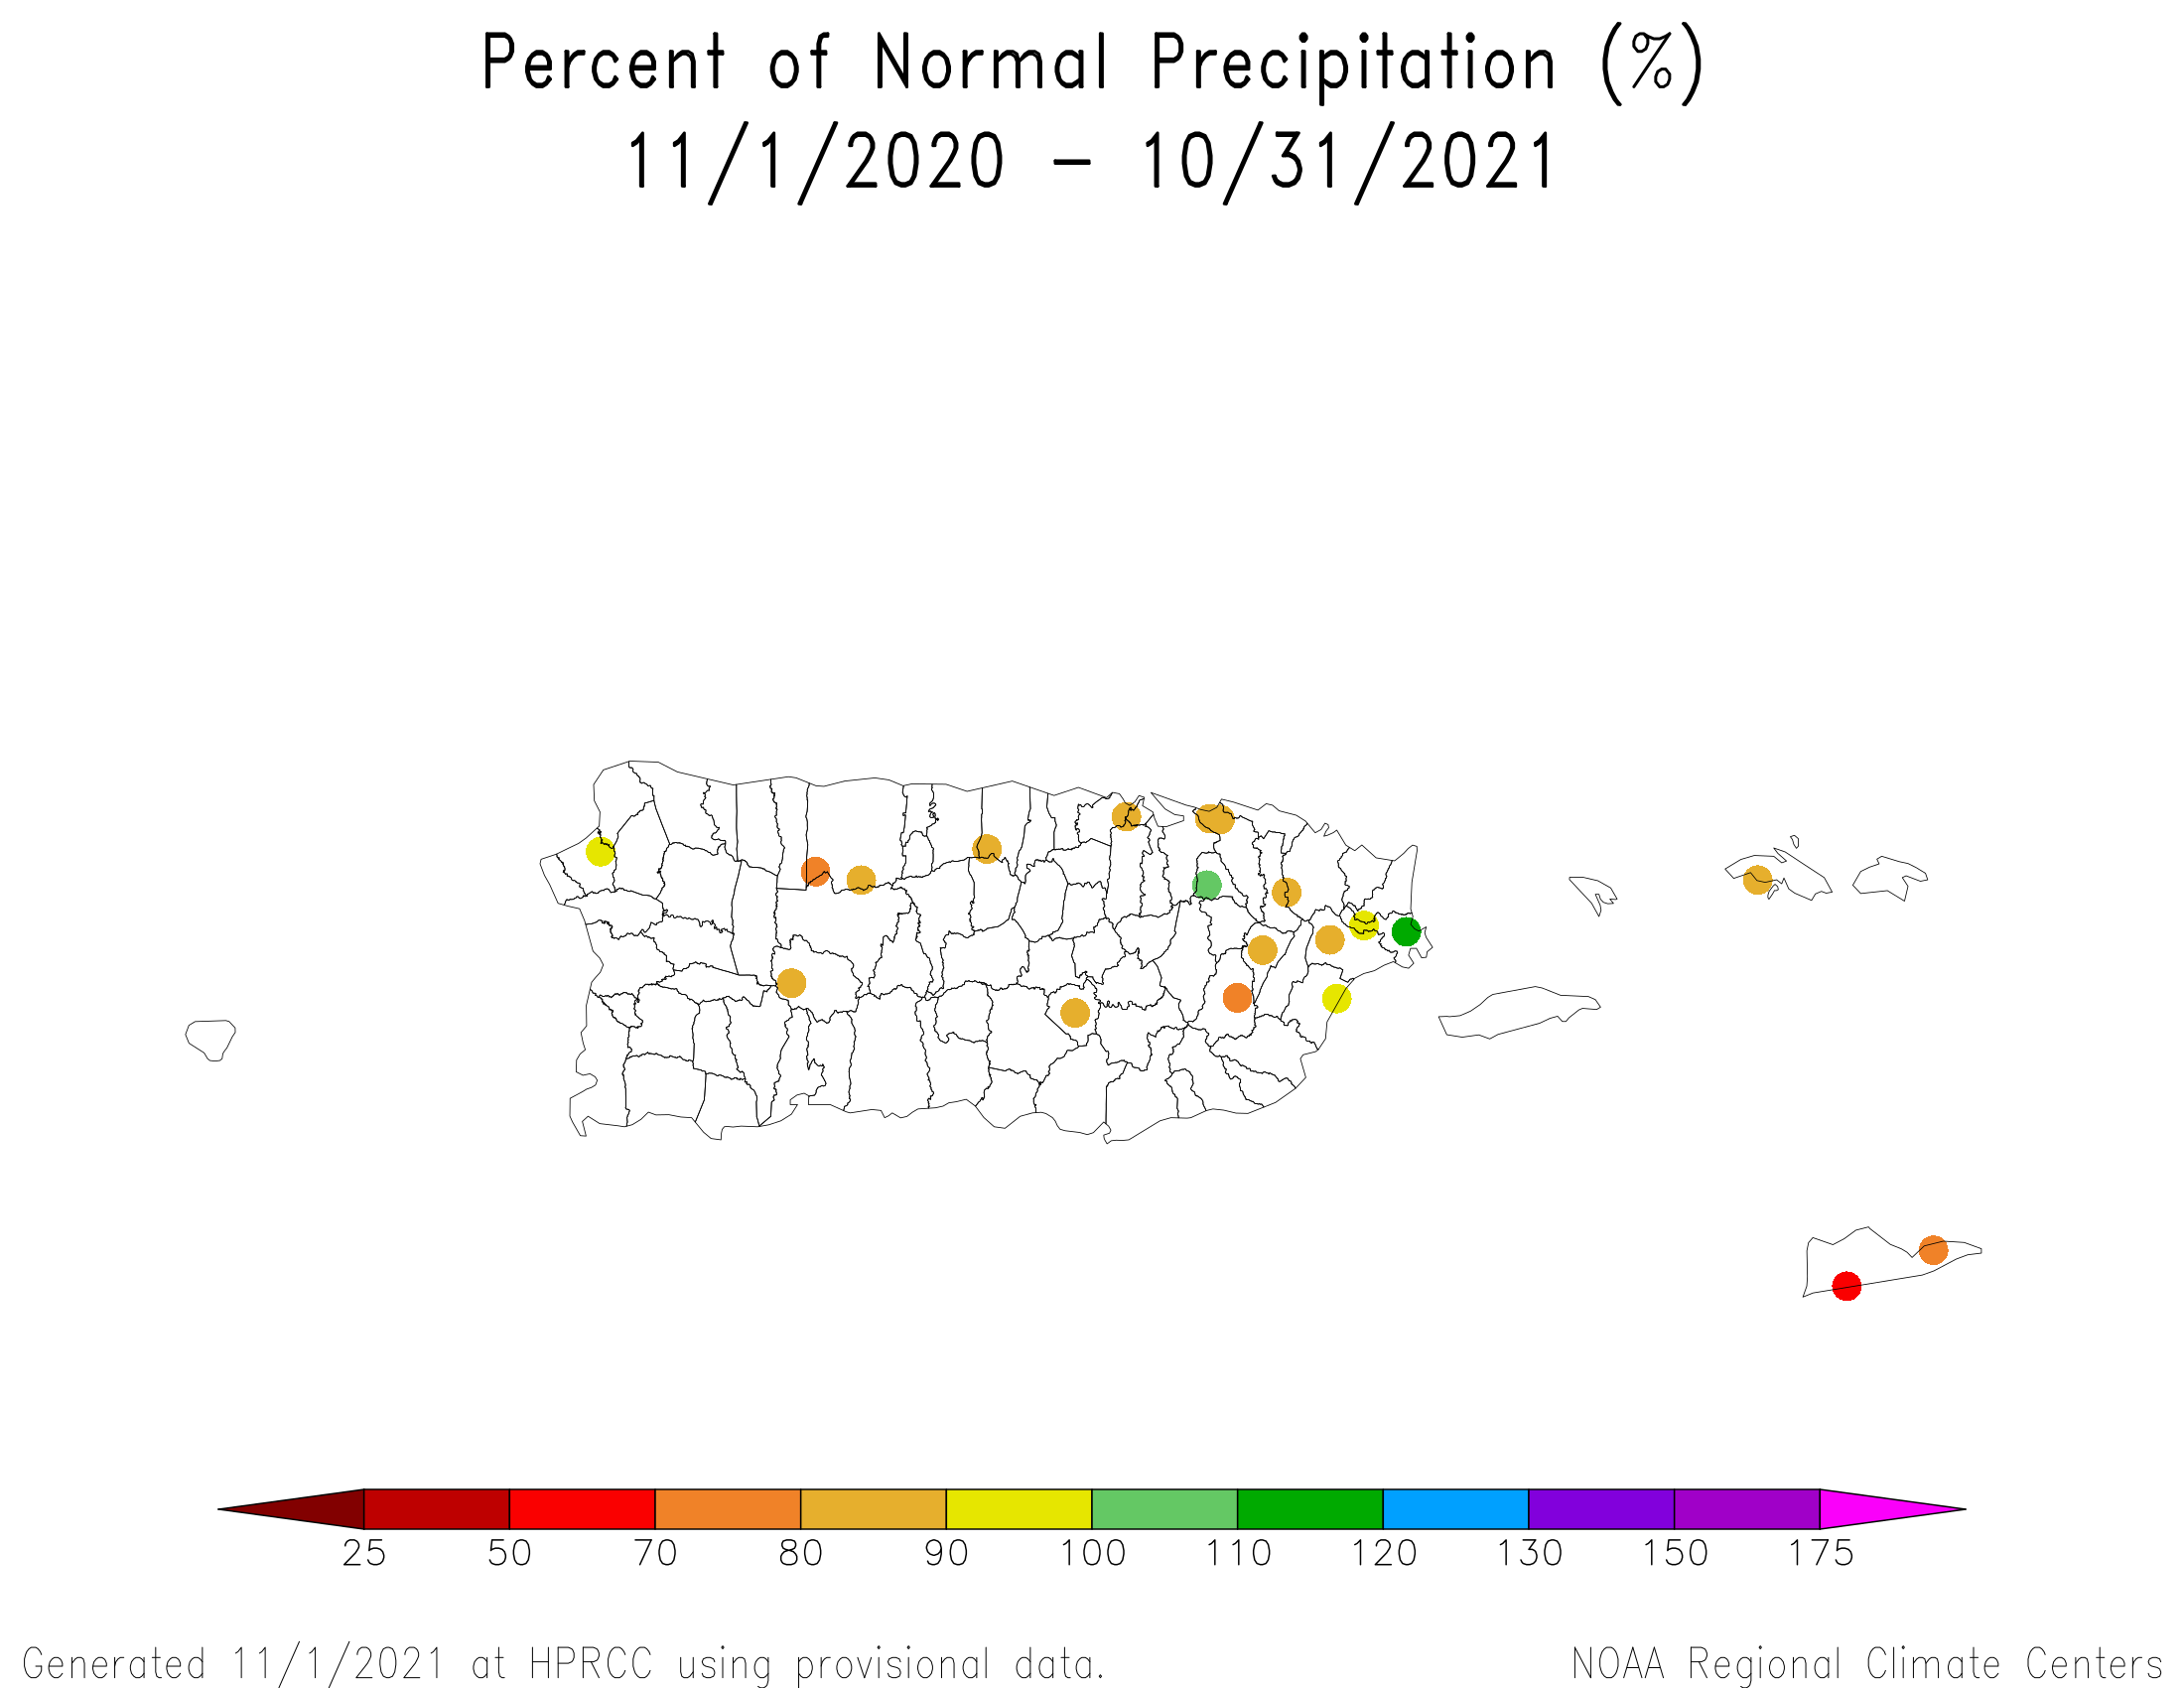
Puerto Rico and U.S. Virgin Islands

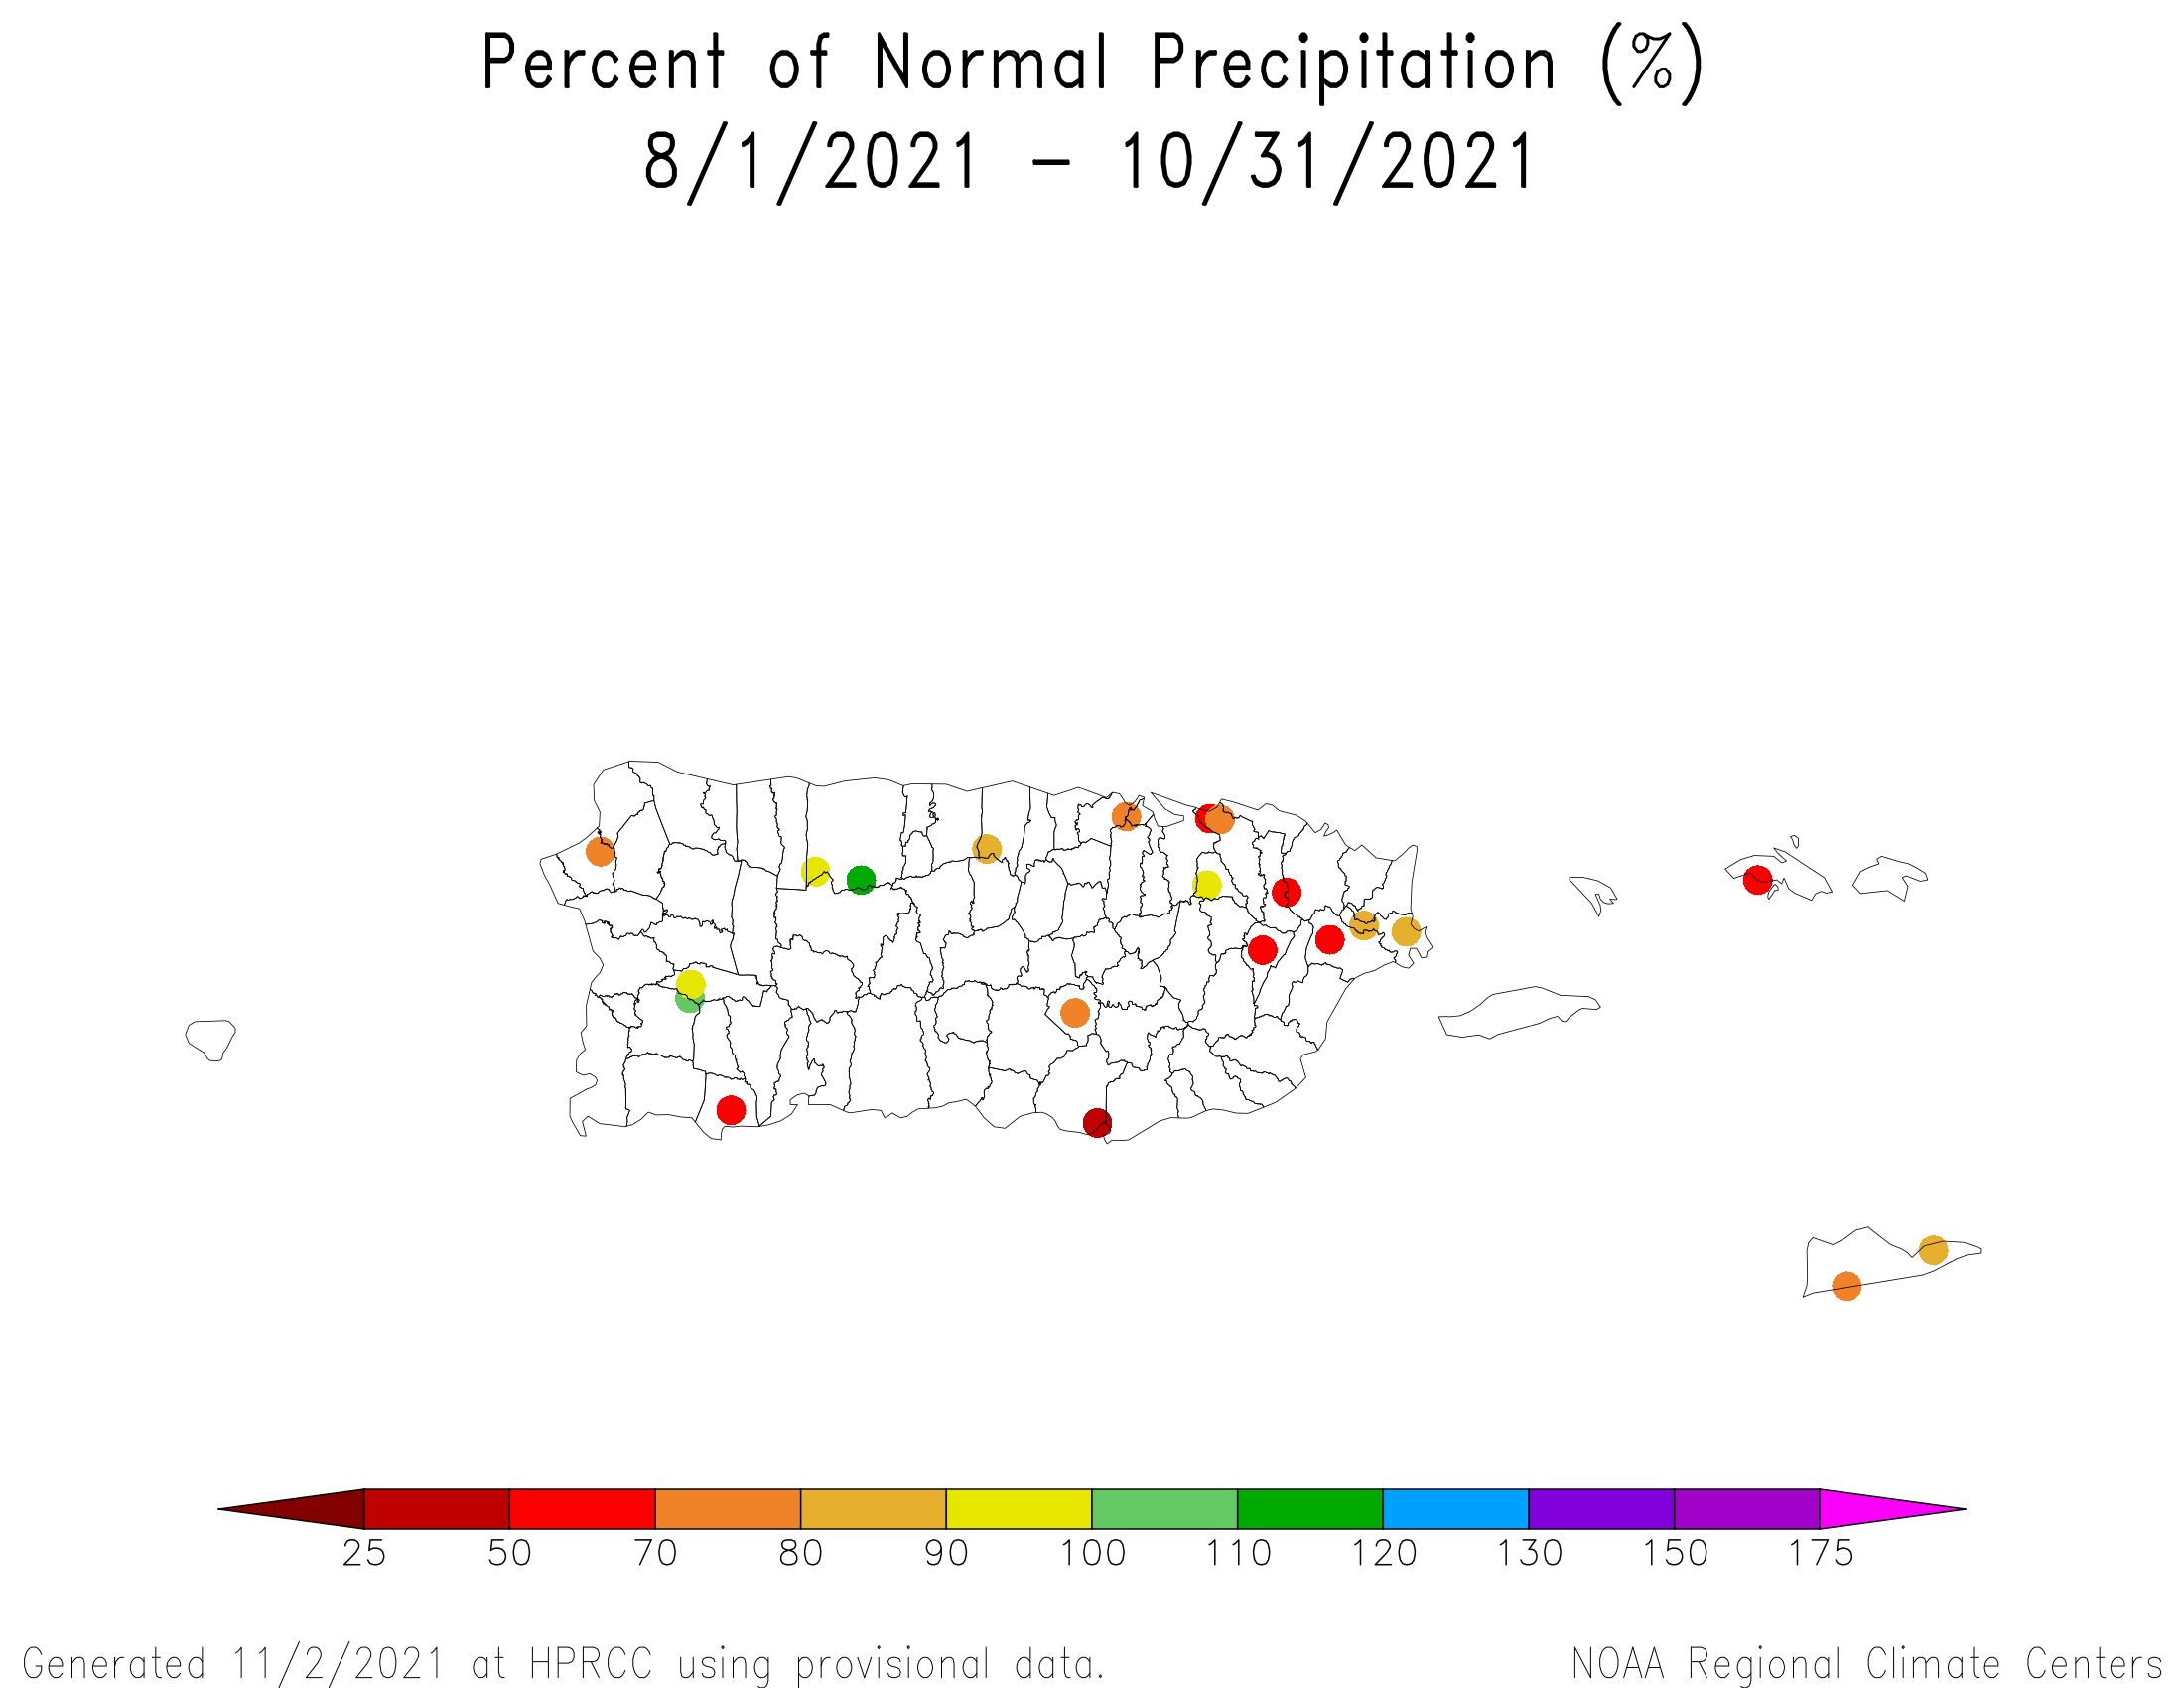
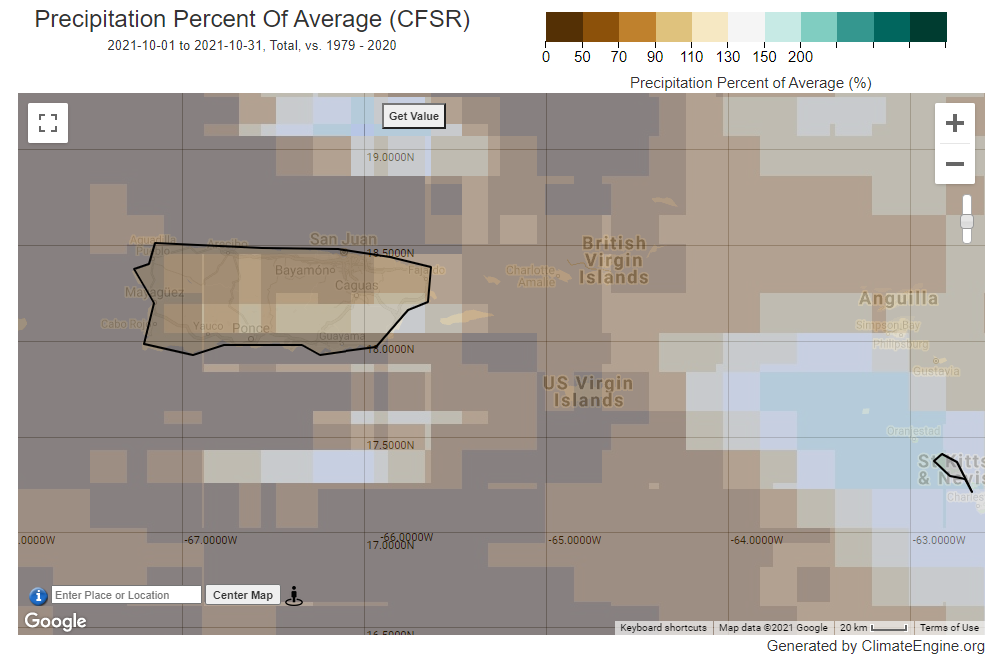
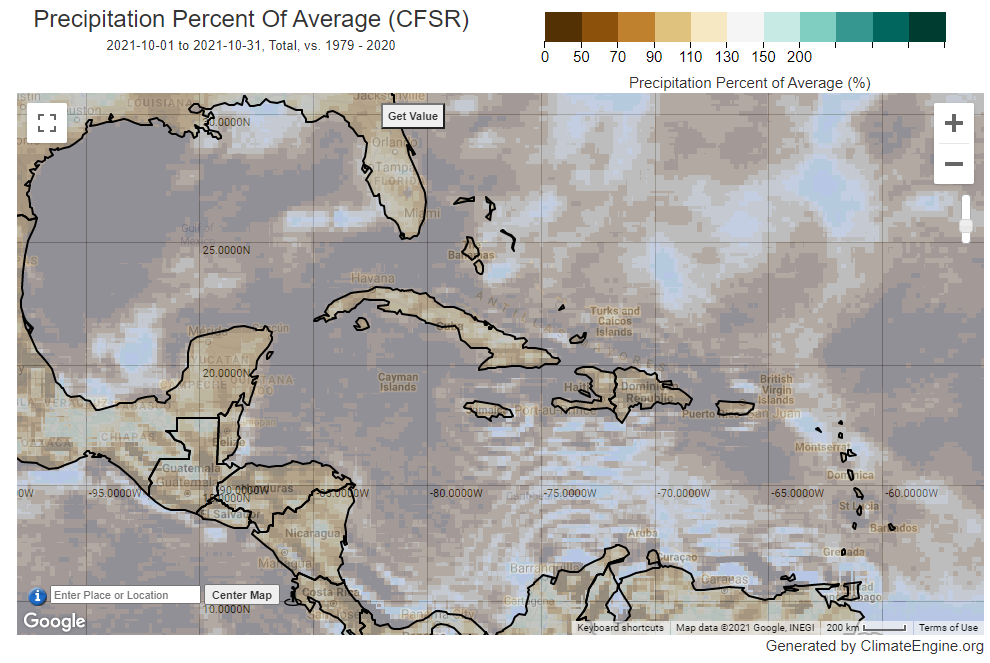
October 2021 was drier than normal across much of Puerto Rico (PR) and the U.S. Virgin Islands (USVI) with some locations having a wetter-than-normal month. Drier-than-normal conditions dominated the USVI and southern and coastal areas of PR for the last 2 to 12 months. Maps are not available for longer time periods (radar-based precipitation anomaly estimates for the last 1, 2, 3, 6, 10, 12 months) (low elevation station precipitation maps for the last 1, 2, 3, 4, 6, 7, 9, 10, 12 months) (climate engine model percent of normal precipitation map for the last month: PR and USVI, Caribbean and Gulf of Mexico region).
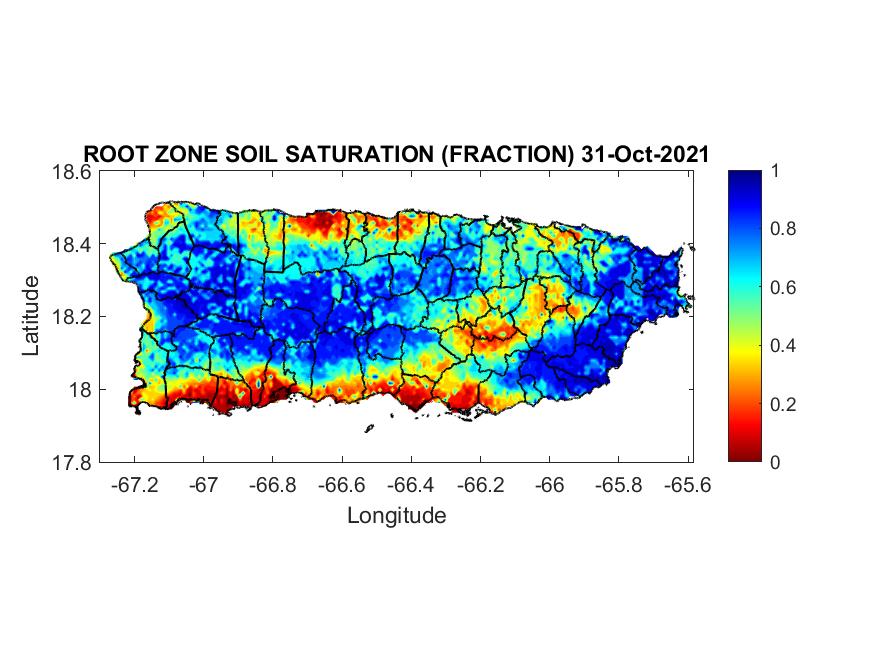
Root zone analyses indicated that soil conditions were dry along the southern and northern coasts and eastern interior regions of PR. Monthly streamflow in PR was mostly near normal. Groundwater on the USVI continued well below peak levels of the last year. On St. Croix, groundwater has been steadily declining since March 2021. On St. Thomas, groundwater levels improved during the summer and early fall, but have been declining during the last month. Groundwater levels were declining on St. John for the first half of the year, then leveled off; they improved during the last half of October. Moderate drought shrank from 11.8 percent of Puerto Rico at the end of September to 1.8 percent at the end of October, with abnormal dryness along the southern coast and in parts of the east and northwest. In the USVI, moderate drought continued in the south on St. Croix, while St. John became free of drought and abnormal dryness and abnormal dryness developed on St. Thomas.
CONUS State Precipitation Ranks
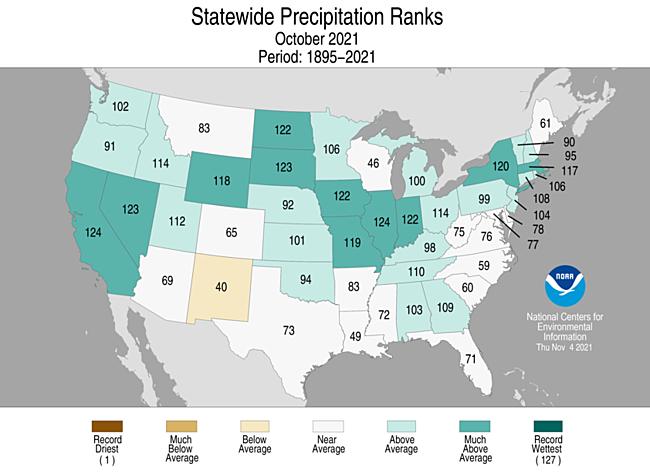
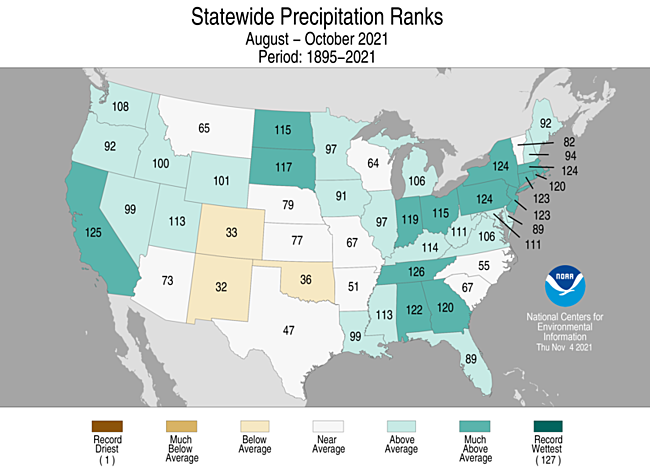
The widespread near to above-normal precipitation of October 2021 gave most states a rank that was in the near average to wet categories for October and August-October. The only states that ranked below average were New Mexico (both time periods) and Colorado and Oklahoma (August-October).
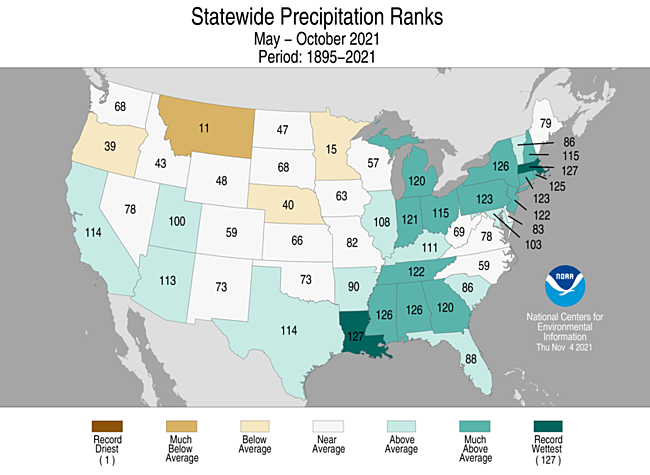
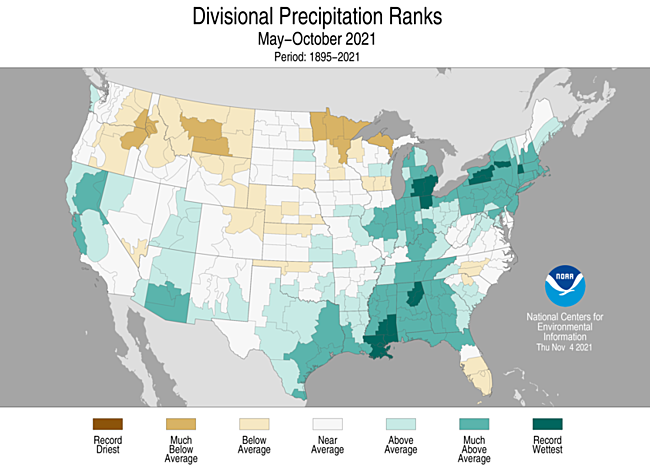
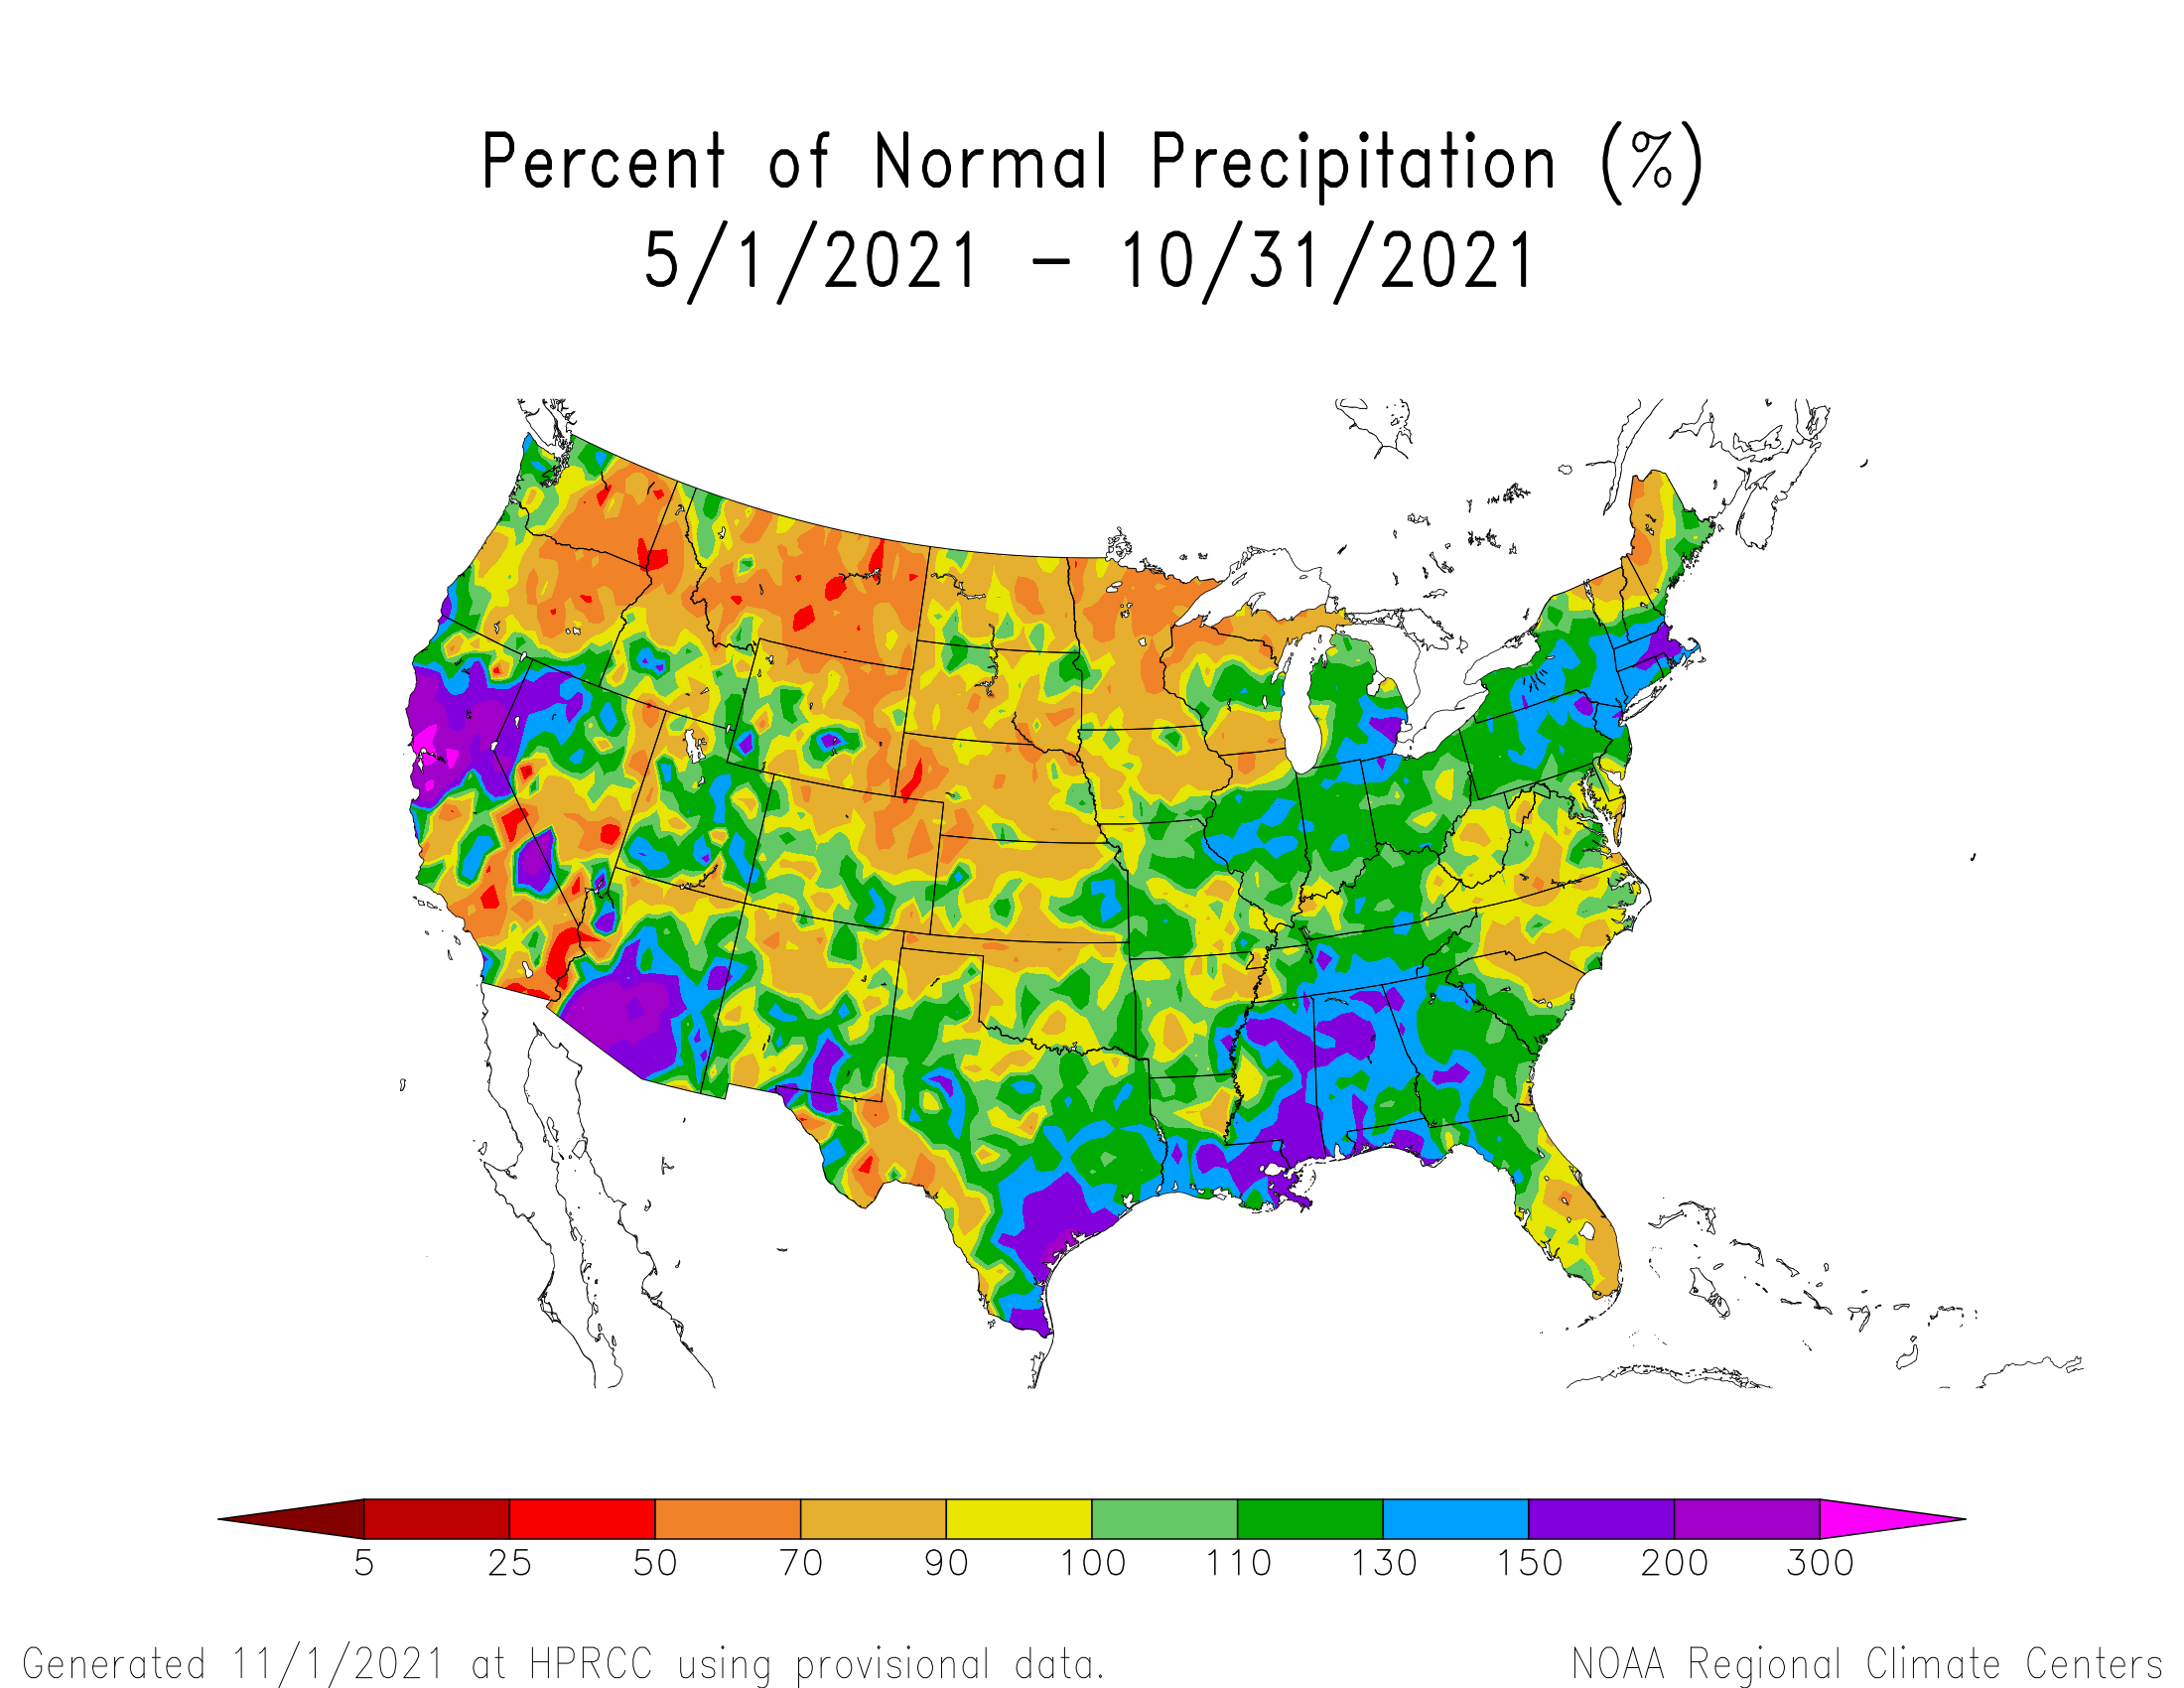
The last six months (May-October 2021) were drier than normal in the Pacific Northwest to Upper Mississippi Valley and central Plains, as well as parts of the Southwest, Rio Grande Valley, coastal Carolinas, northern New England, and southern Florida. Four states in the Northwest to central Plains and Upper Mississippi Valley had a precipitation rank in the driest third of the 127-year historical record for May-October, including Montana which ranked eleventh driest.
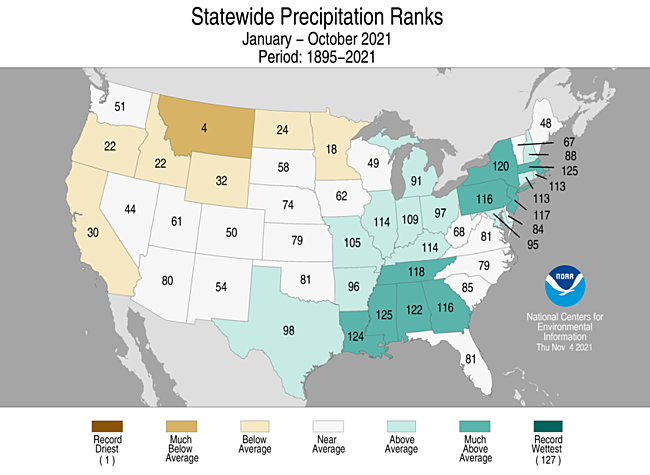

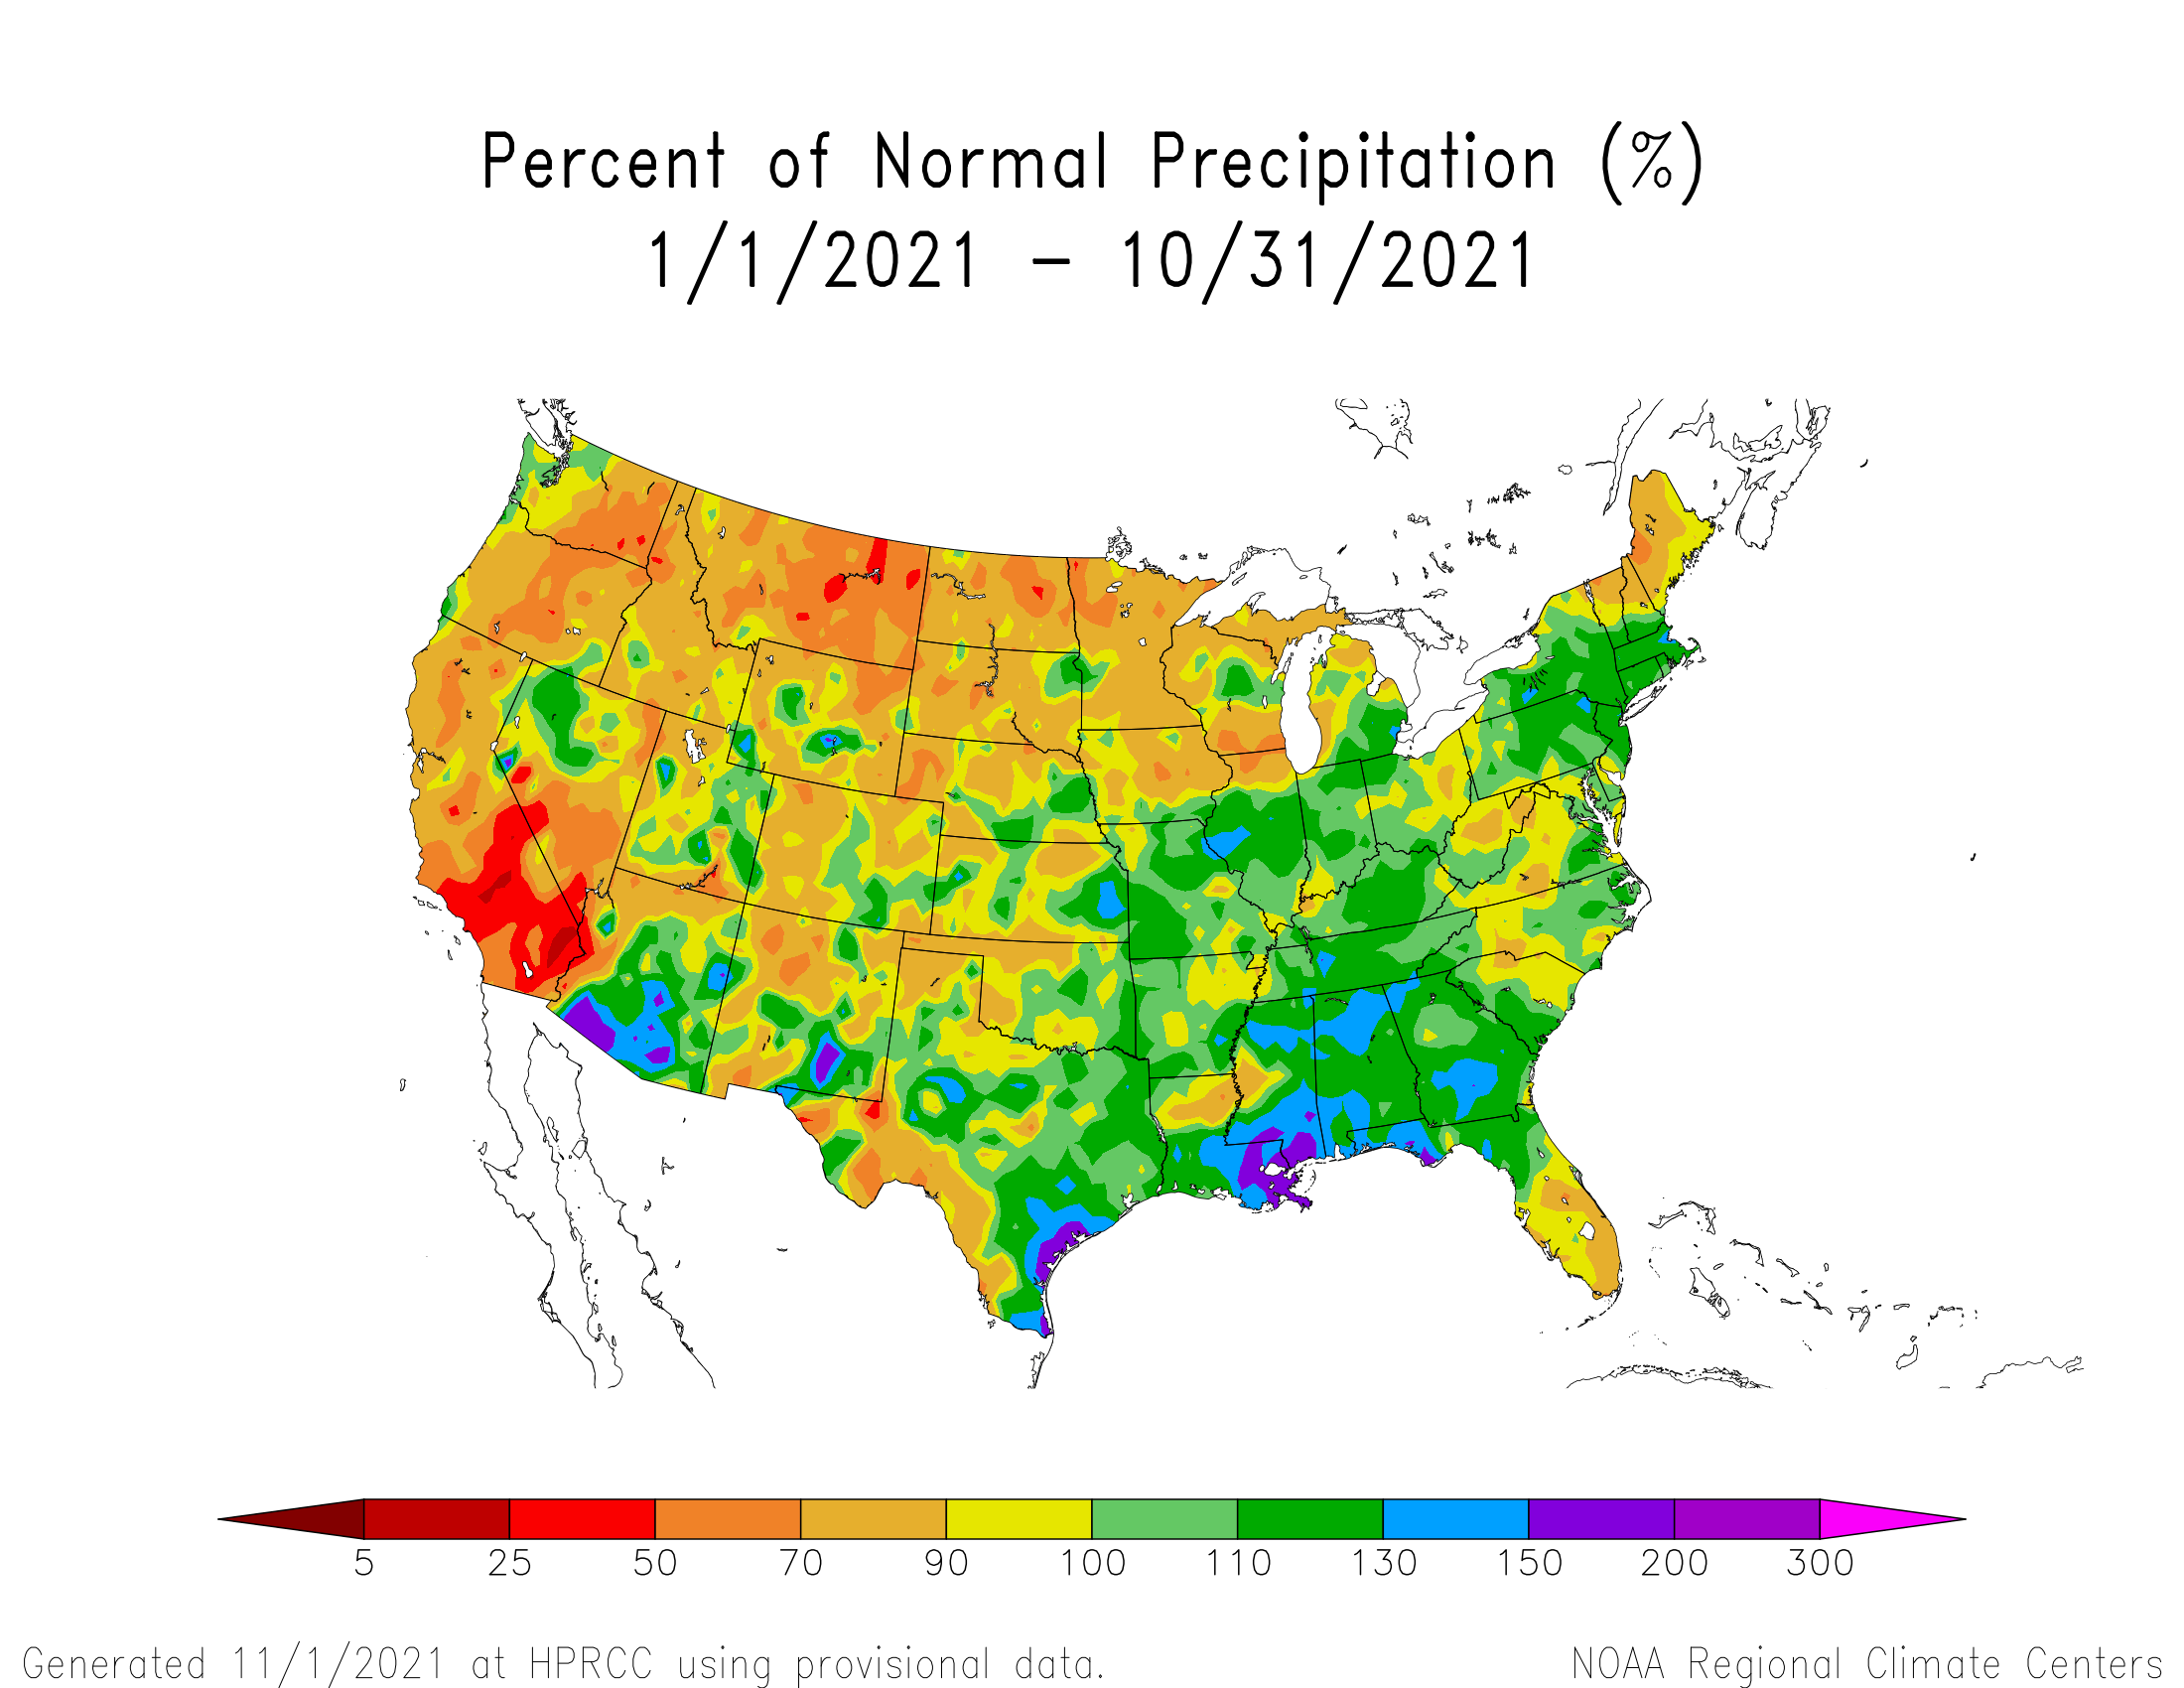
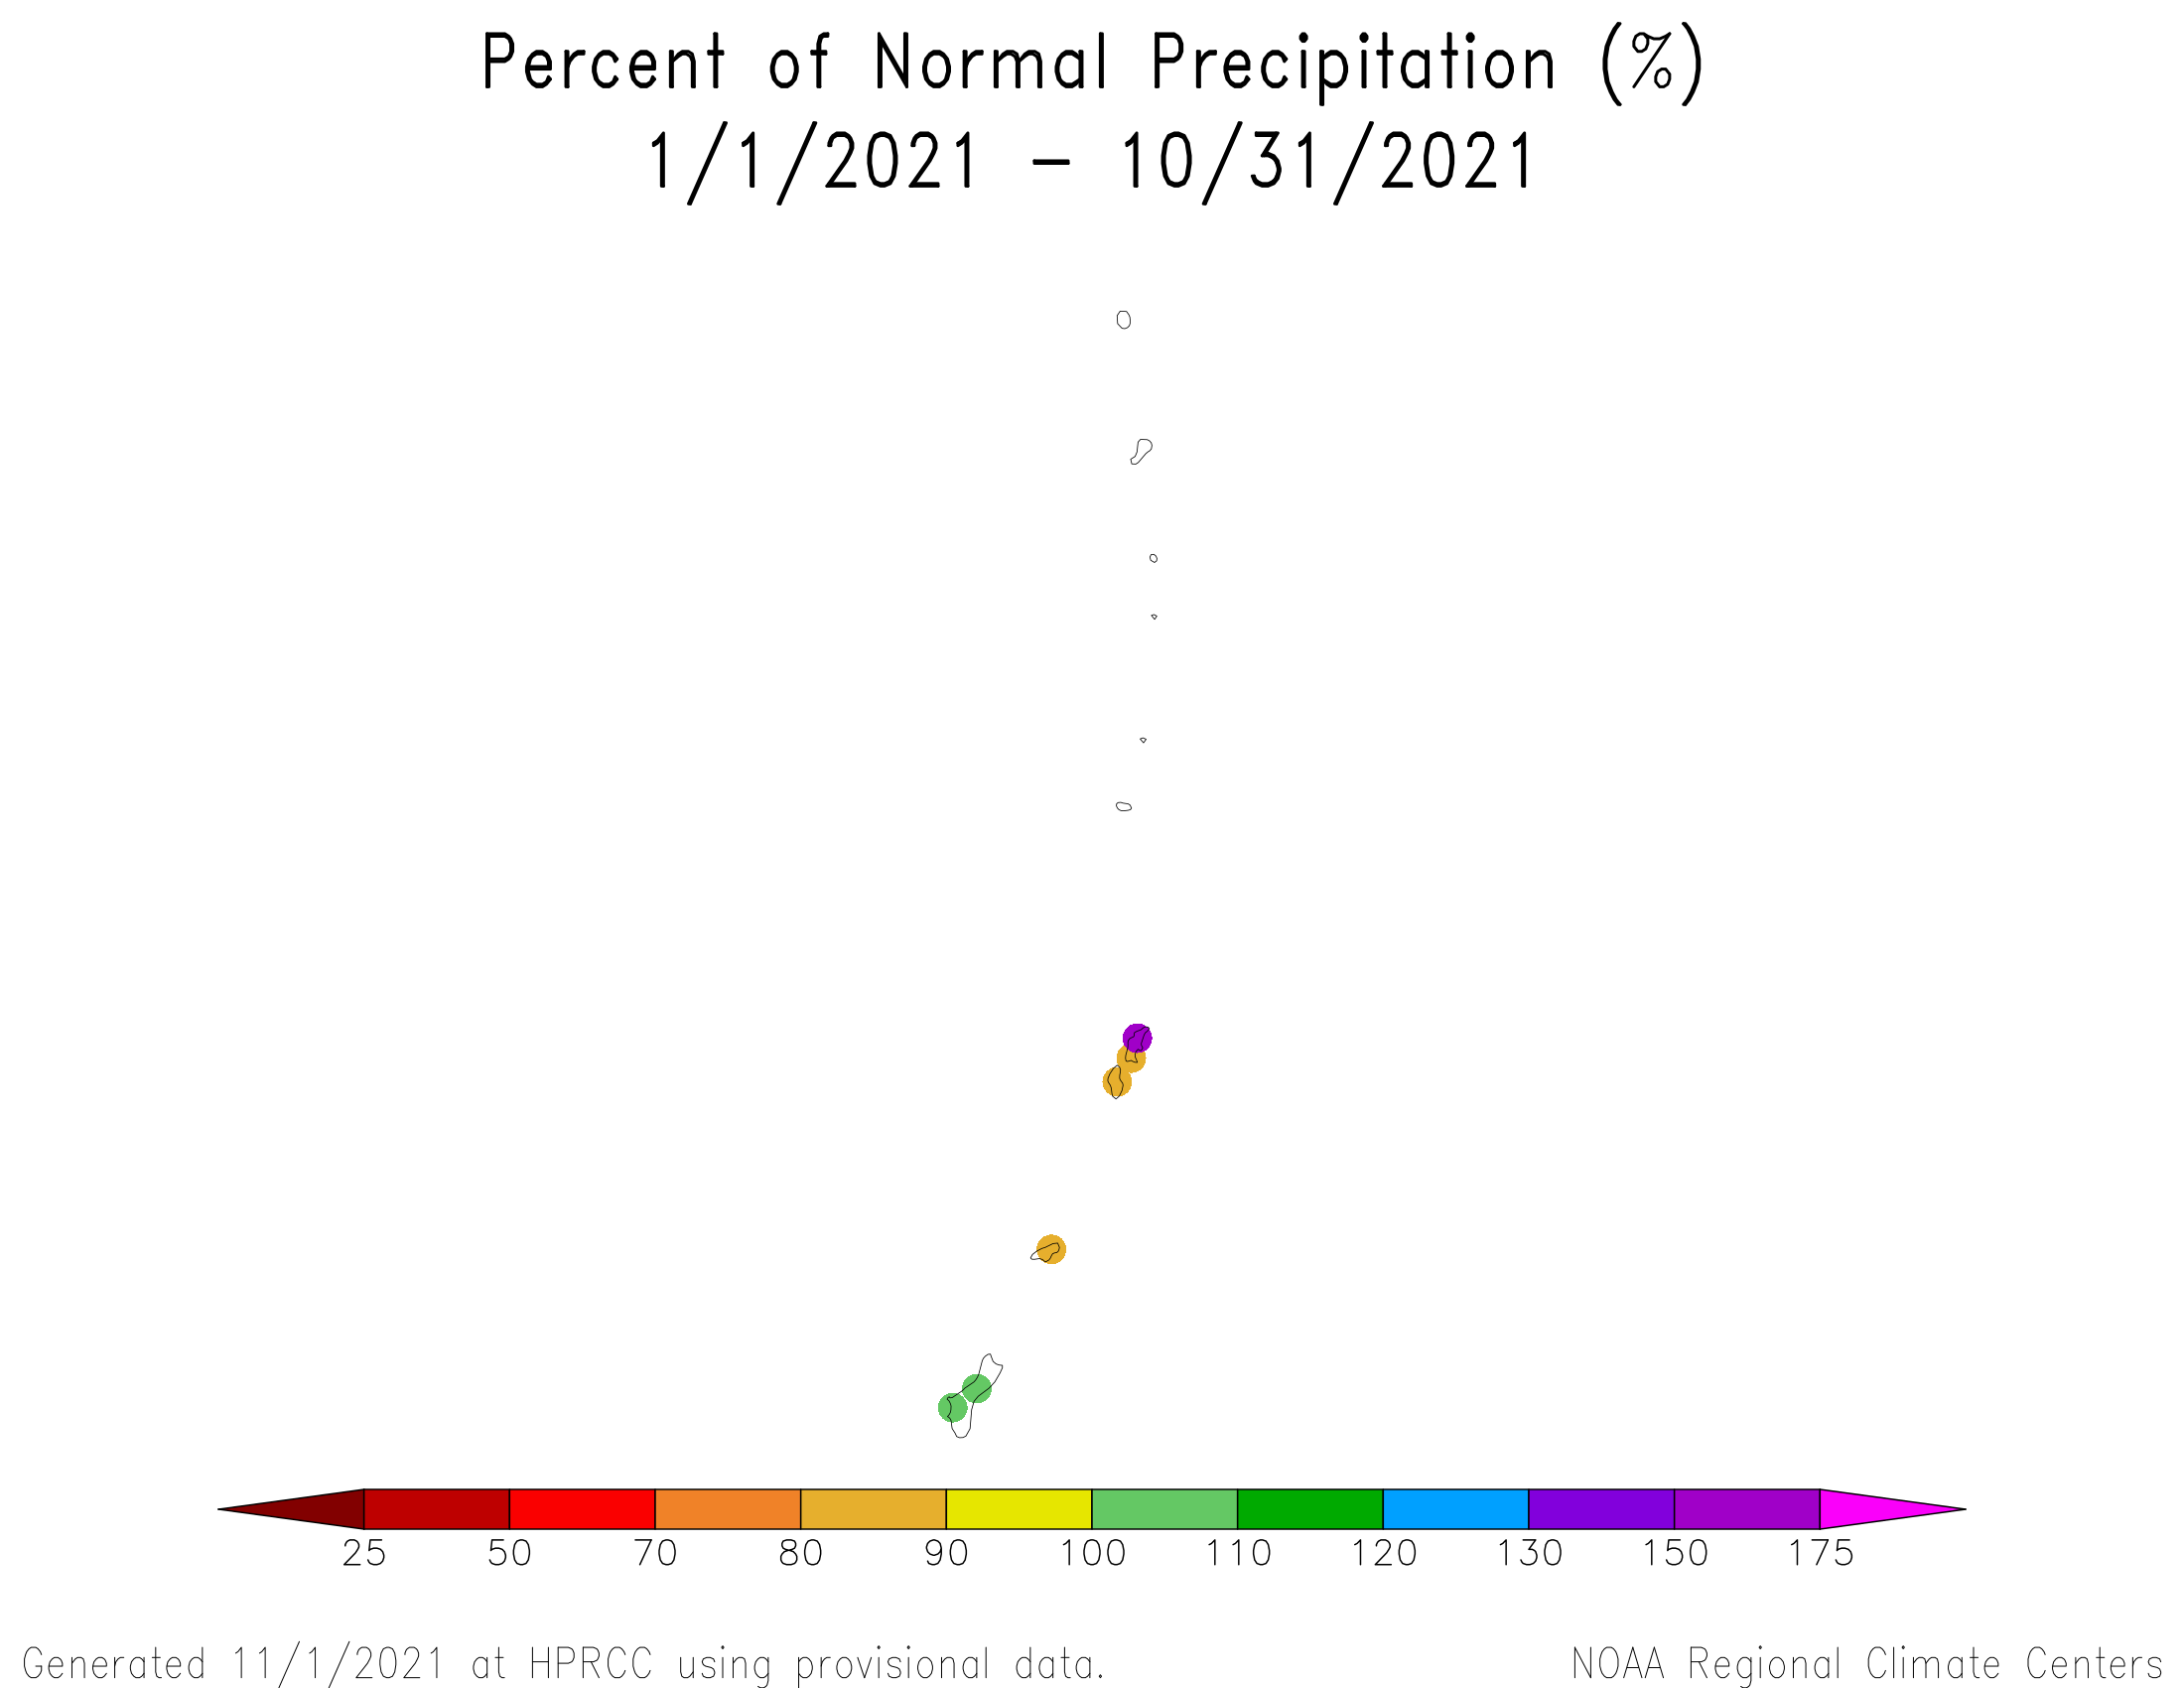
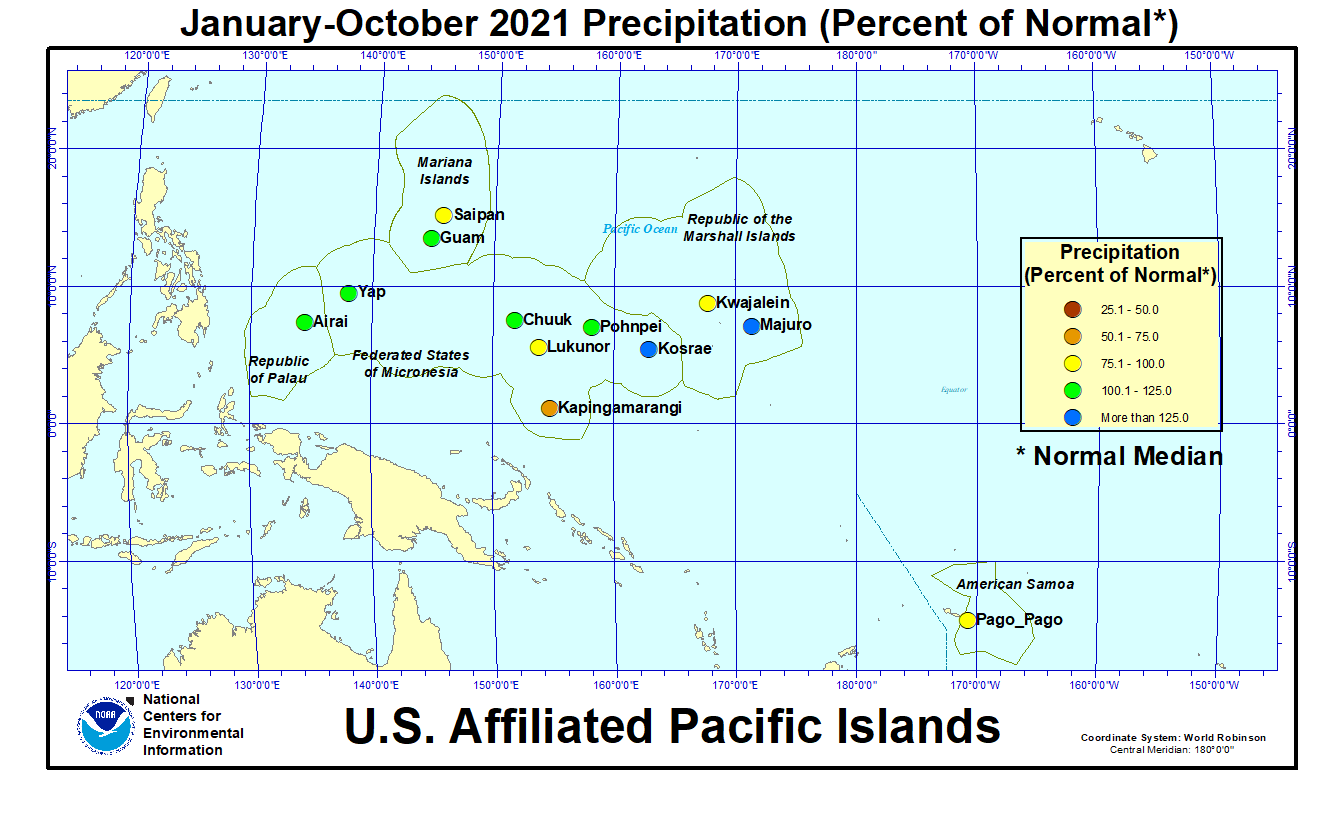
The year to date (January-October 2021) was drier than normal much of the West, central and northern Plains to western Great Lakes, and parts of the Rio Grande Valley, northern New England, and southern Florida. Seven states from the West Coast to Upper Mississippi Valley had a precipitation rank in the driest third of the historical record for January-October, including one in the top ten driest category — Montana (fourth driest).


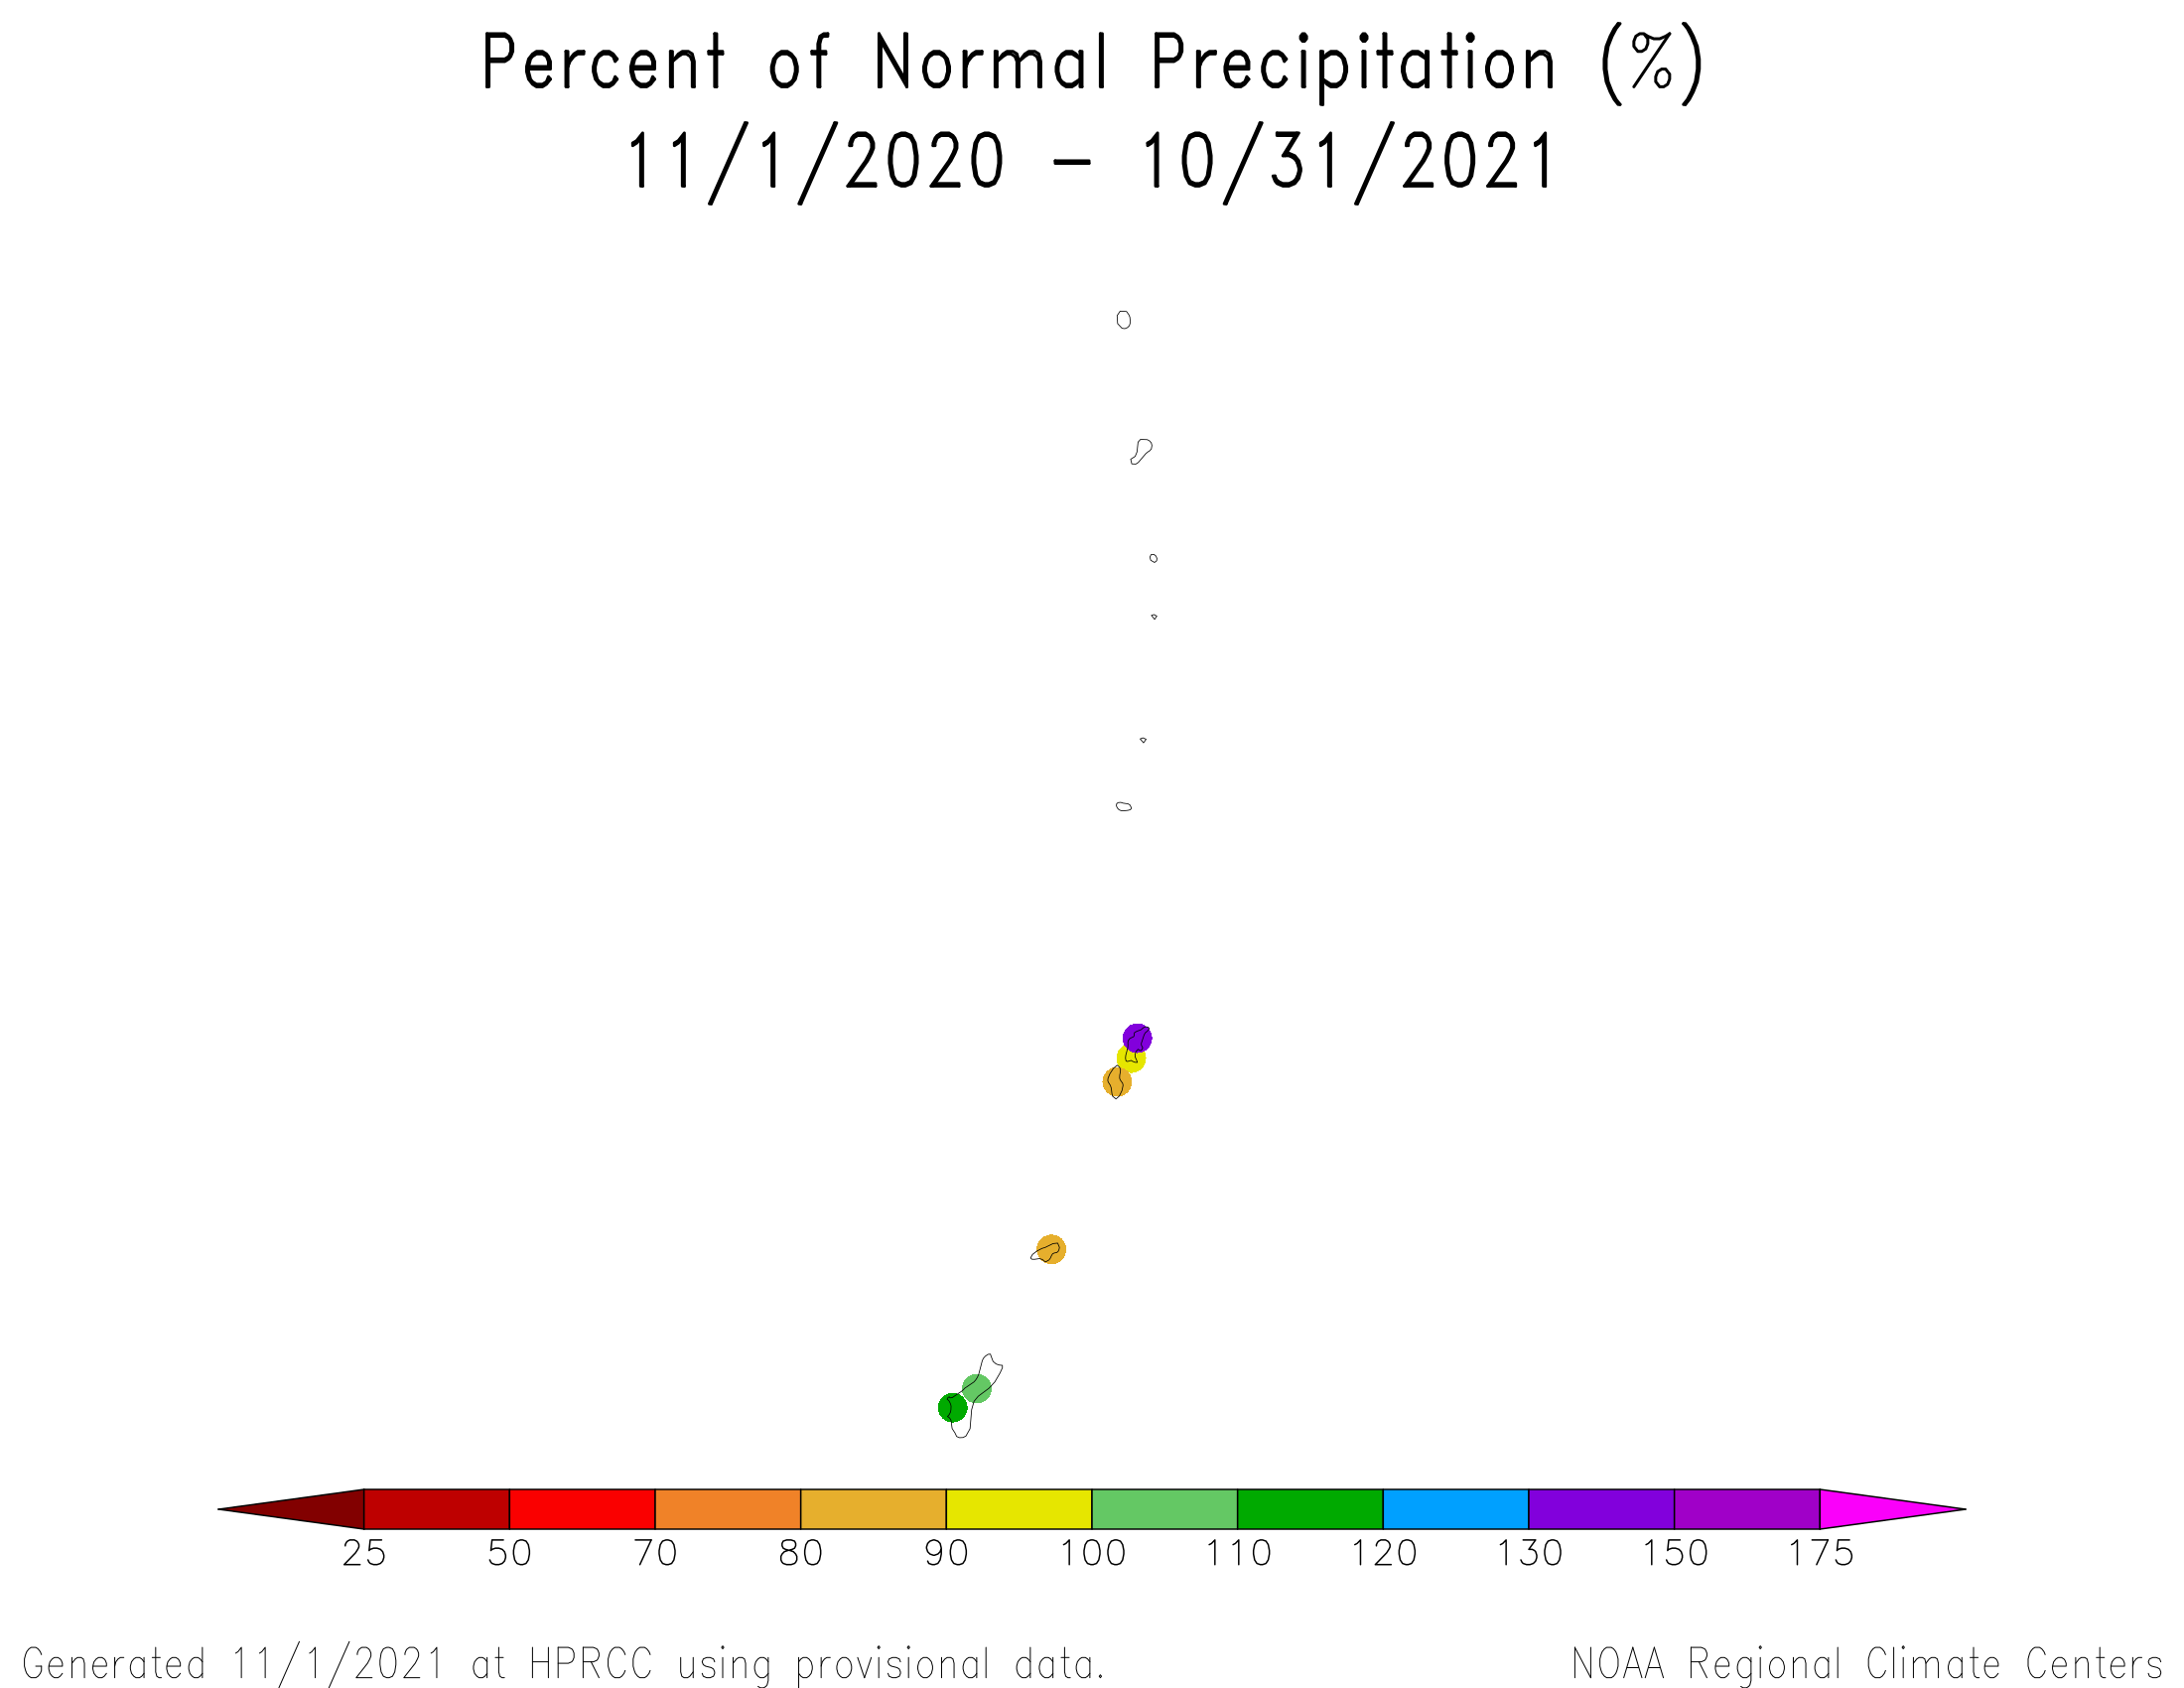
The last 12 months (November 2020-October 2021) were drier than normal in the same areas as for the year to date. Ten states in the West, northern Plains, and Upper Mississippi Valley had a precipitation rank in the driest third of the historical record for November-October, including two in the top ten driest category — California (eighth driest) and Montana (fourth driest).
Agricultural Belts
During October 2021, the Primary Hard Red Winter Wheat agricultural belt generally was warmer than average with drier-than-normal conditions in the west and wetter-than-average conditions in the east. The month ranked as the 46th wettest and 14th warmest October, regionwide, in the 1895-2021 record.
As of November 2, drought affected approximately 89 percent of barley production, 87 percent of spring wheat production, 54 percent of the sheep inventory, 43 percent of winter wheat production, 42 percent of the milk cow inventory, 37 percent of hay acreage, 35 percent of the cattle inventory, 23 percent of cotton production, 20 percent of rice production, 19 percent of sorghum production, 19 percent of corn production, and 15 percent of soybean production.
October 31 USDA reports indicated that topsoil moisture was short or very short (dry or very dry) across 29 percent of the CONUS and subsoil moisture was short or very short across 36 percent of the CONUS. These values are less than a month ago. Forty-two percent of the pasture and rangeland was in poor to very poor condition, nationwide, while 21 percent of the winter wheat crop was in poor to very poor condition. Those states having 30 percent or more of the topsoil or subsoil moisture short or very short, or 30 percent or more of the pasture and rangeland or winter wheat crop in poor to very poor condition, at the end of October 2021 are listed in the table below.

U.S.-Affiliated Pacific Islands
The NOAA National Weather Service (NWS) offices, the Pacific ENSO Applications Climate Center (PEAC), and partners provided reports on conditions across the Pacific Islands.
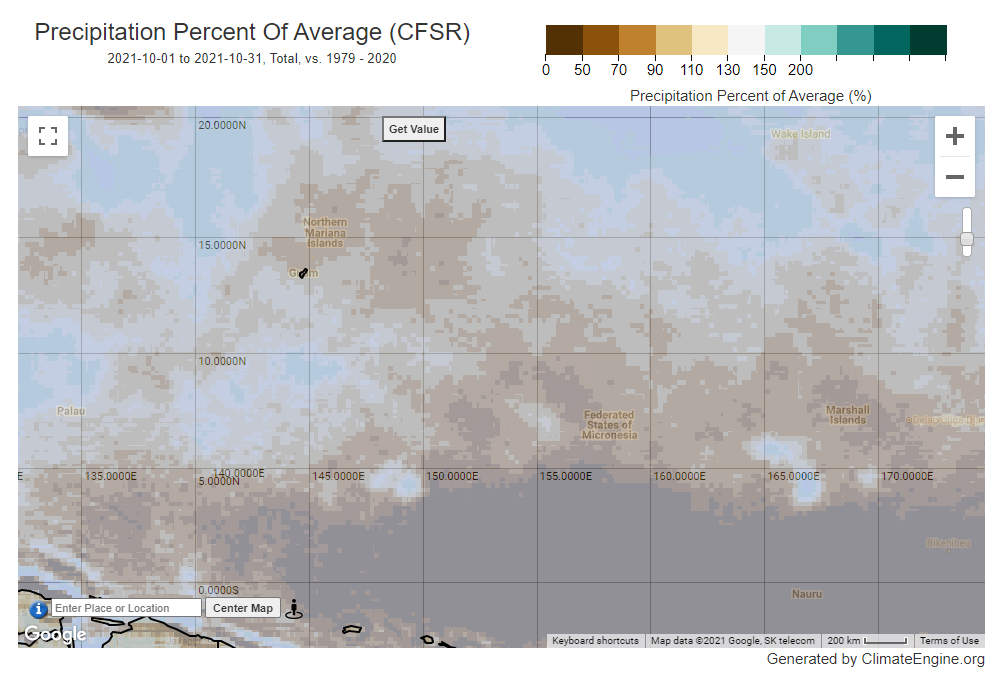
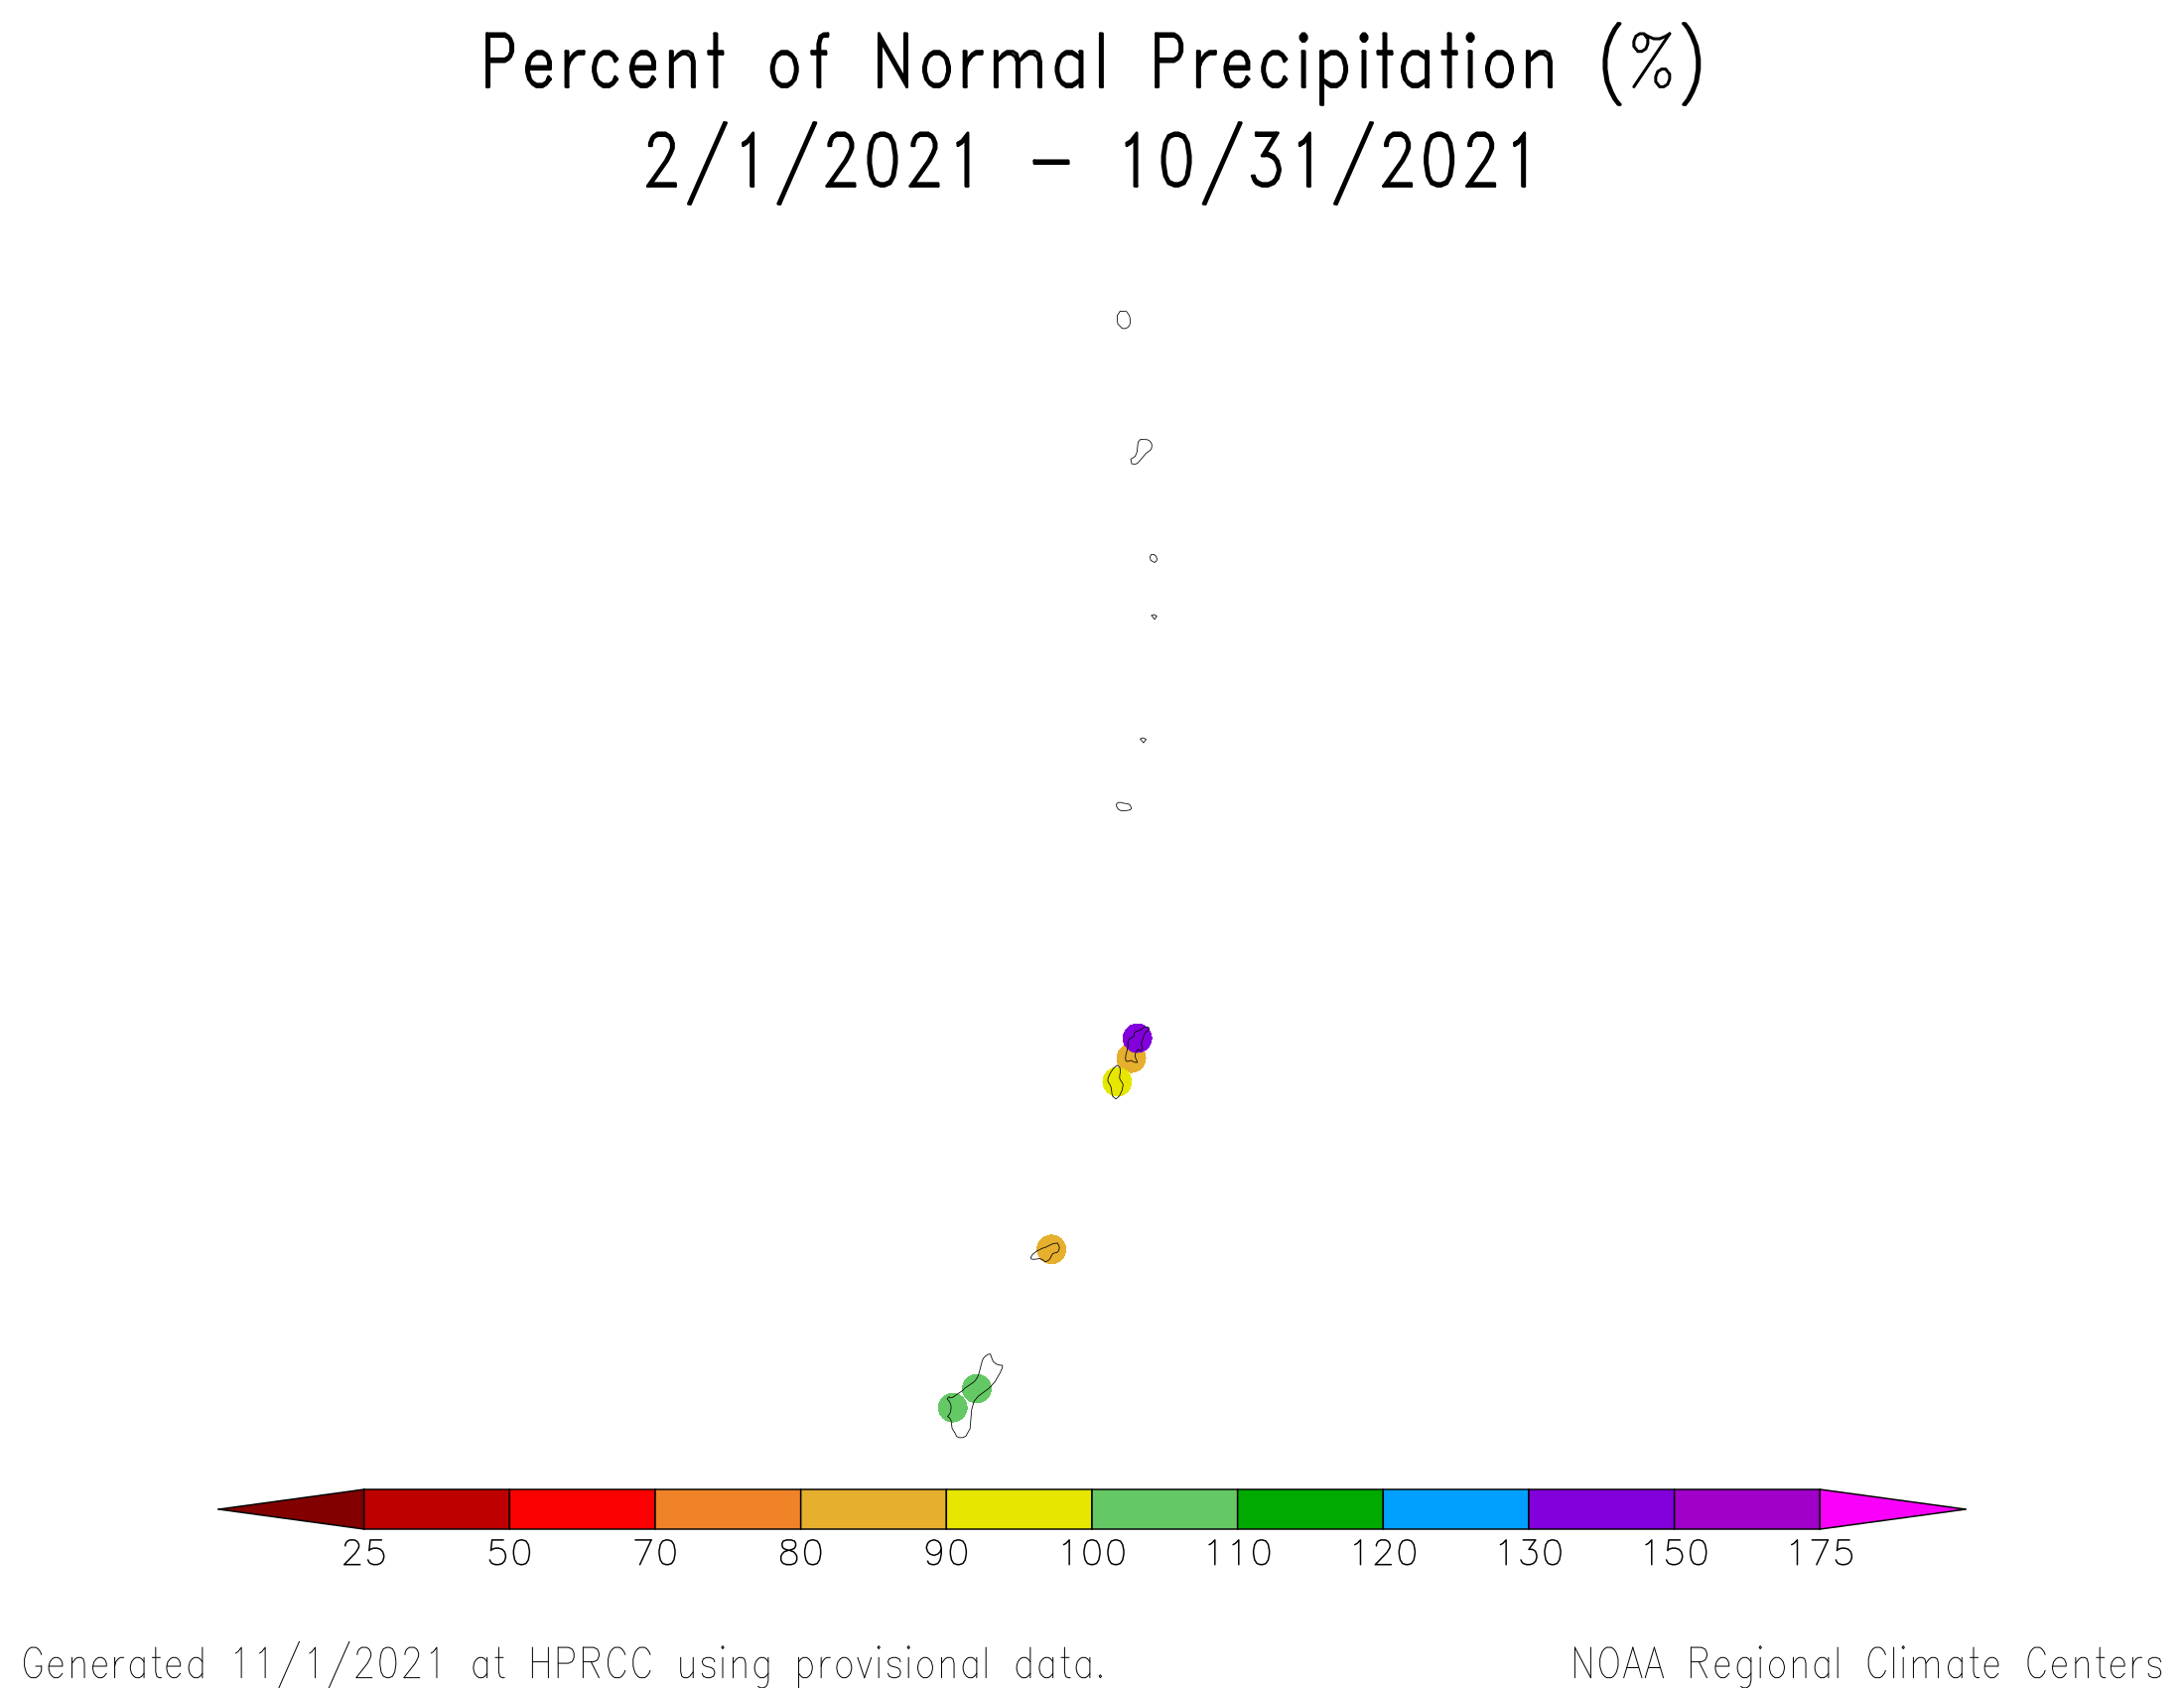
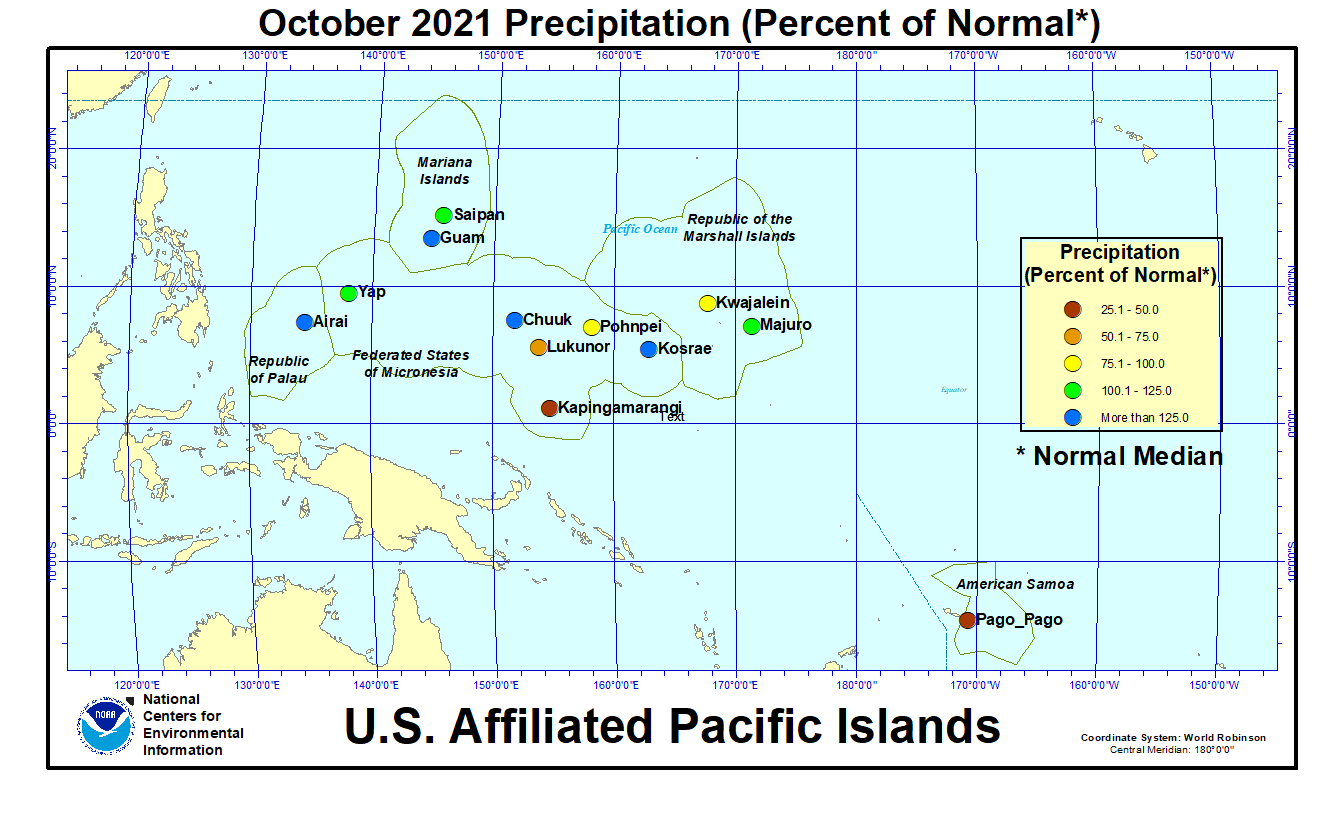
In the U.S. Affiliated Pacific Islands (USAPI) (maps — Federated States of Micronesia [FSM], Northern Mariana Islands, Marshall Islands [RMI], Republic of Palau, American Samoa, basinwide), October 2021 was drier-than-normal in American Samoa and parts of the FSM (especially southern parts) and RMI. It was near to wetter than normal in other parts of the FSM and RMI and in Palau and the Marianas.
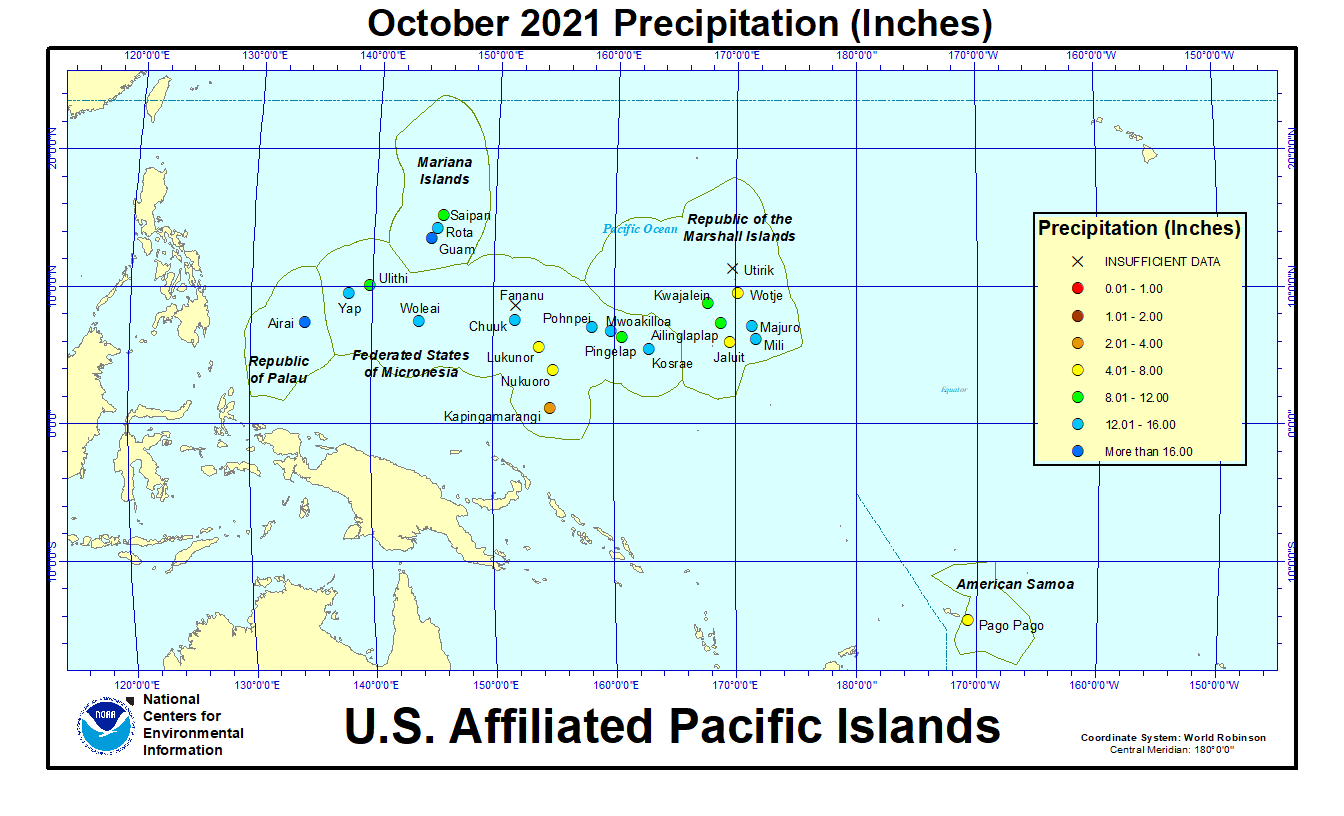
Monthly precipitation amounts were below the monthly minimum needed to meet most water needs (4 inches in the Marianas and Pago Pago, and 8 inches elsewhere) at Kapingamarangi, Lukunor, and Nukuoro (in the FSM); Jaluit and Wotje (in the RMI), and Pago Pago (in American Samoa). October precipitation was above the monthly minimums at the rest of the stations across the USAPI. The 4- and 8-inch thresholds are important because, if monthly precipitation falls below the threshold, then water shortages or drought become a concern.
The tropical Pacific climatology can experience extremes in precipitation, from very low precipitation during the dry season to very high precipitation during the wet season. This can result in monthly normal precipitation values that are different from the monthly minimum needed to meet most water needs, and this can lead to percent of normal values that seem odd. This was the case during October 2021, which is in the wet season or entering the wet season for most locations in Micronesia. Precipitation was above the monthly minimum but below normal (1981-2010 normal), because the normals are high, at:
- Kwajalein: October 2021 precipitation 10.97 inches, October normal mean 11.83 inches, October normal median 11.18 inches
- Pohnpei: October 2021 precipitation 14.57 inches, October normal mean 15.27 inches, October normal median 15.27 inches
In the table below, the station identified as Koror is Palau International Airport (Airai).
| Station Name | Nov 2020 | Dec 2020 | Jan 2021 | Feb 2021 | Mar 2021 | Apr 2021 | May 2021 | Jun 2021 | Jul 2021 | Aug 2021 | Sep 2021 | Oct 2021 | Nov- Oct |
|---|---|---|---|---|---|---|---|---|---|---|---|---|---|
| Chuuk | 127% | 182% | 114% | 156% | 223% | 55% | 244% | 60% | 135% | 48% | 143% | 138% | 125% |
| Guam NAS | 140% | 157% | 102% | 33% | 130% | 119% | 210% | 82% | 86% | 105% | 92% | 233% | 105% |
| Kapingamarangi | 31% | 38% | 65% | 63% | 78% | 150% | 129% | 72% | 99% | 52% | 40% | 30% | 67% |
| Koror | 88% | 142% | 102% | 166% | 119% | 287% | 178% | 56% | 73% | 101% | 164% | 233% | 121% |
| Kosrae | 177% | 185% | 188% | 141% | 194% | 106% | 154% | 194% | 166% | 67% | 107% | 129% | 128% |
| Kwajalein | 115% | 60% | 74% | 75% | 264% | 174% | 126% | 67% | 82% | 35% | 105% | 98% | 92% |
| Lukonor | 102% | 219% | 146% | 180% | 84% | 134% | 238% | 105% | 41% | 63% | 94% | 64% | 104% |
| Majuro | 112% | 147% | 150% | 57% | 228% | 135% | 285% | 84% | 84% | 91% | 111% | 119% | 128% |
| Pago Pago | 160% | 113% | 132% | 141% | 91% | 76% | 80% | 212% | 84% | 145% | 51% | 47% | 97% |
| Pohnpei | 169% | 168% | 147% | 65% | 216% | 77% | 152% | 141% | 93% | 66% | 105% | 95% | 122% |
| Saipan | 88% | 193% | 91% | 122% | 46% | 77% | 120% | 158% | 123% | 83% | 85% | 100% | 100% |
| Yap | 196% | 200% | 201% | 139% | 189% | 316% | 109% | 86% | 67% | 87% | 93% | 107% | 123% |
| Station Name | Nov 2020 | Dec 2020 | Jan 2021 | Feb 2021 | Mar 2021 | Apr 2021 | May 2021 | Jun 2021 | Jul 2021 | Aug 2021 | Sep 2021 | Oct 2021 | Nov- Oct |
|---|---|---|---|---|---|---|---|---|---|---|---|---|---|
| Chuuk | 13.45" | 20.47" | 11.56" | 11.29" | 18.55" | 6.86" | 27.53" | 7.00" | 16.13" | 6.20" | 16.70" | 15.86" | 171.6" |
| Guam NAS | 10.33" | 8.02" | 4.11" | 1.01" | 2.70" | 3.02" | 7.14" | 5.08" | 8.76" | 15.44" | 11.61" | 26.68" | 103.9" |
| Kapingamarangi | 2.83" | 3.77" | 5.92" | 5.86" | 8.91" | 20.44" | 15.53" | 9.95" | 14.01" | 4.26" | 3.98" | 2.46" | 97.92" |
| Koror | 9.97" | 15.82" | 10.42" | 14.23" | 8.84" | 21.03" | 21.06" | 9.87" | 13.55" | 13.66" | 19.33" | 27.58" | 185.36" |
| Kosrae | 24.52" | 29.87" | 31.36" | 18.28" | 31.20" | 18.63" | 27.37" | 28.33" | 24.77" | 9.48" | 15.27" | 14.15" | 273.23" |
| Kwajalein | 12.95" | 4.02" | 2.34" | 1.97" | 6.21" | 9.17" | 8.45" | 4.61" | 8.05" | 3.43" | 11.30" | 10.97" | 83.47" |
| Lukonor | 9.23" | 24.71" | 12.29" | 16.11" | 7.81" | 15.21" | 27.86" | 12.26" | 6.61" | 8.83" | 9.50" | 7.25" | 157.67" |
| Majuro | 14.99" | 16.71" | 11.58" | 3.89" | 15.00" | 12.71" | 28.81" | 9.28" | 9.42" | 10.60" | 12.41" | 15.12" | 160.52" |
| Pago Pago | 16.25" | 14.55" | 17.62" | 16.86" | 9.68" | 7.14" | 7.71" | 11.32" | 4.64" | 7.82" | 3.33" | 4.38" | 121.3" |
| Pohnpei | 25.13" | 26.95" | 19.38" | 6.24" | 28.50" | 14.18" | 30.38" | 20.95" | 14.30" | 9.35" | 13.18" | 14.57" | 223.11" |
| Saipan | 4.95" | 7.43" | 2.30" | 3.15" | 0.86" | 2.02" | 2.85" | 5.71" | 10.94" | 10.95" | 8.62" | 10.63" | 70.41" |
| Yap | 17.27" | 16.99" | 12.85" | 7.24" | 8.63" | 17.78" | 8.59" | 10.35" | 10.13" | 12.84" | 12.55" | 13.00" | 148.22" |
| Station Name | Nov 2020 | Dec 2020 | Jan 2021 | Feb 2021 | Mar 2021 | Apr 2021 | May 2021 | Jun 2021 | Jul 2021 | Aug 2021 | Sep 2021 | Oct 2021 | Nov- Oct |
|---|---|---|---|---|---|---|---|---|---|---|---|---|---|
| Chuuk | 10.61" | 11.25" | 10.10" | 7.25" | 8.32" | 12.47" | 11.30" | 11.66" | 11.98" | 12.86" | 11.71" | 11.51" | 136.77" |
| Guam NAS | 7.38" | 5.11" | 4.01" | 3.03" | 2.07" | 2.53" | 3.40" | 6.18" | 10.14" | 14.74" | 12.66" | 11.44" | 99.09" |
| Kapingamarangi | 9.27" | 9.84" | 9.15" | 9.27" | 11.43" | 13.64" | 12.08" | 13.78" | 14.15" | 8.13" | 9.93" | 8.19" | 145.85" |
| Koror | 11.39" | 11.16" | 10.18" | 8.56" | 7.44" | 7.32" | 11.83" | 17.48" | 18.53" | 13.50" | 11.77" | 11.84" | 152.90" |
| Kosrae | 13.83" | 16.11" | 16.67" | 12.93" | 16.06" | 17.51" | 17.75" | 14.64" | 14.91" | 14.22" | 14.22" | 10.94" | 213.87" |
| Kwajalein | 11.28" | 6.66" | 3.16" | 2.64" | 2.35" | 5.26" | 6.72" | 6.93" | 9.87" | 9.74" | 10.74" | 11.18" | 90.41" |
| Lukonor | 9.08" | 11.27" | 8.41" | 8.93" | 9.26" | 11.31" | 11.69" | 11.65" | 15.93" | 14.04" | 10.15" | 11.32" | 151.36" |
| Majuro | 13.44" | 11.39" | 7.74" | 6.88" | 6.58" | 9.42" | 10.11" | 11.01" | 11.17" | 11.69" | 11.17" | 12.73" | 125.25" |
| Pago Pago | 10.14" | 12.84" | 13.34" | 12.00" | 10.68" | 9.39" | 9.66" | 5.33" | 5.55" | 5.38" | 6.53" | 9.26" | 125.57" |
| Pohnpei | 14.83" | 16.08" | 13.18" | 9.55" | 13.17" | 18.41" | 19.96" | 14.81" | 15.43" | 14.26" | 12.55" | 15.27" | 182.36" |
| Saipan | 5.61" | 3.85" | 2.53" | 2.59" | 1.89" | 2.63" | 2.38" | 3.62" | 8.91" | 13.13" | 10.09" | 10.62" | 70.25" |
| Yap | 8.83" | 8.51" | 6.39" | 5.19" | 4.56" | 5.63" | 7.85" | 12.04" | 15.08" | 14.82" | 13.50" | 12.18" | 120.31" |
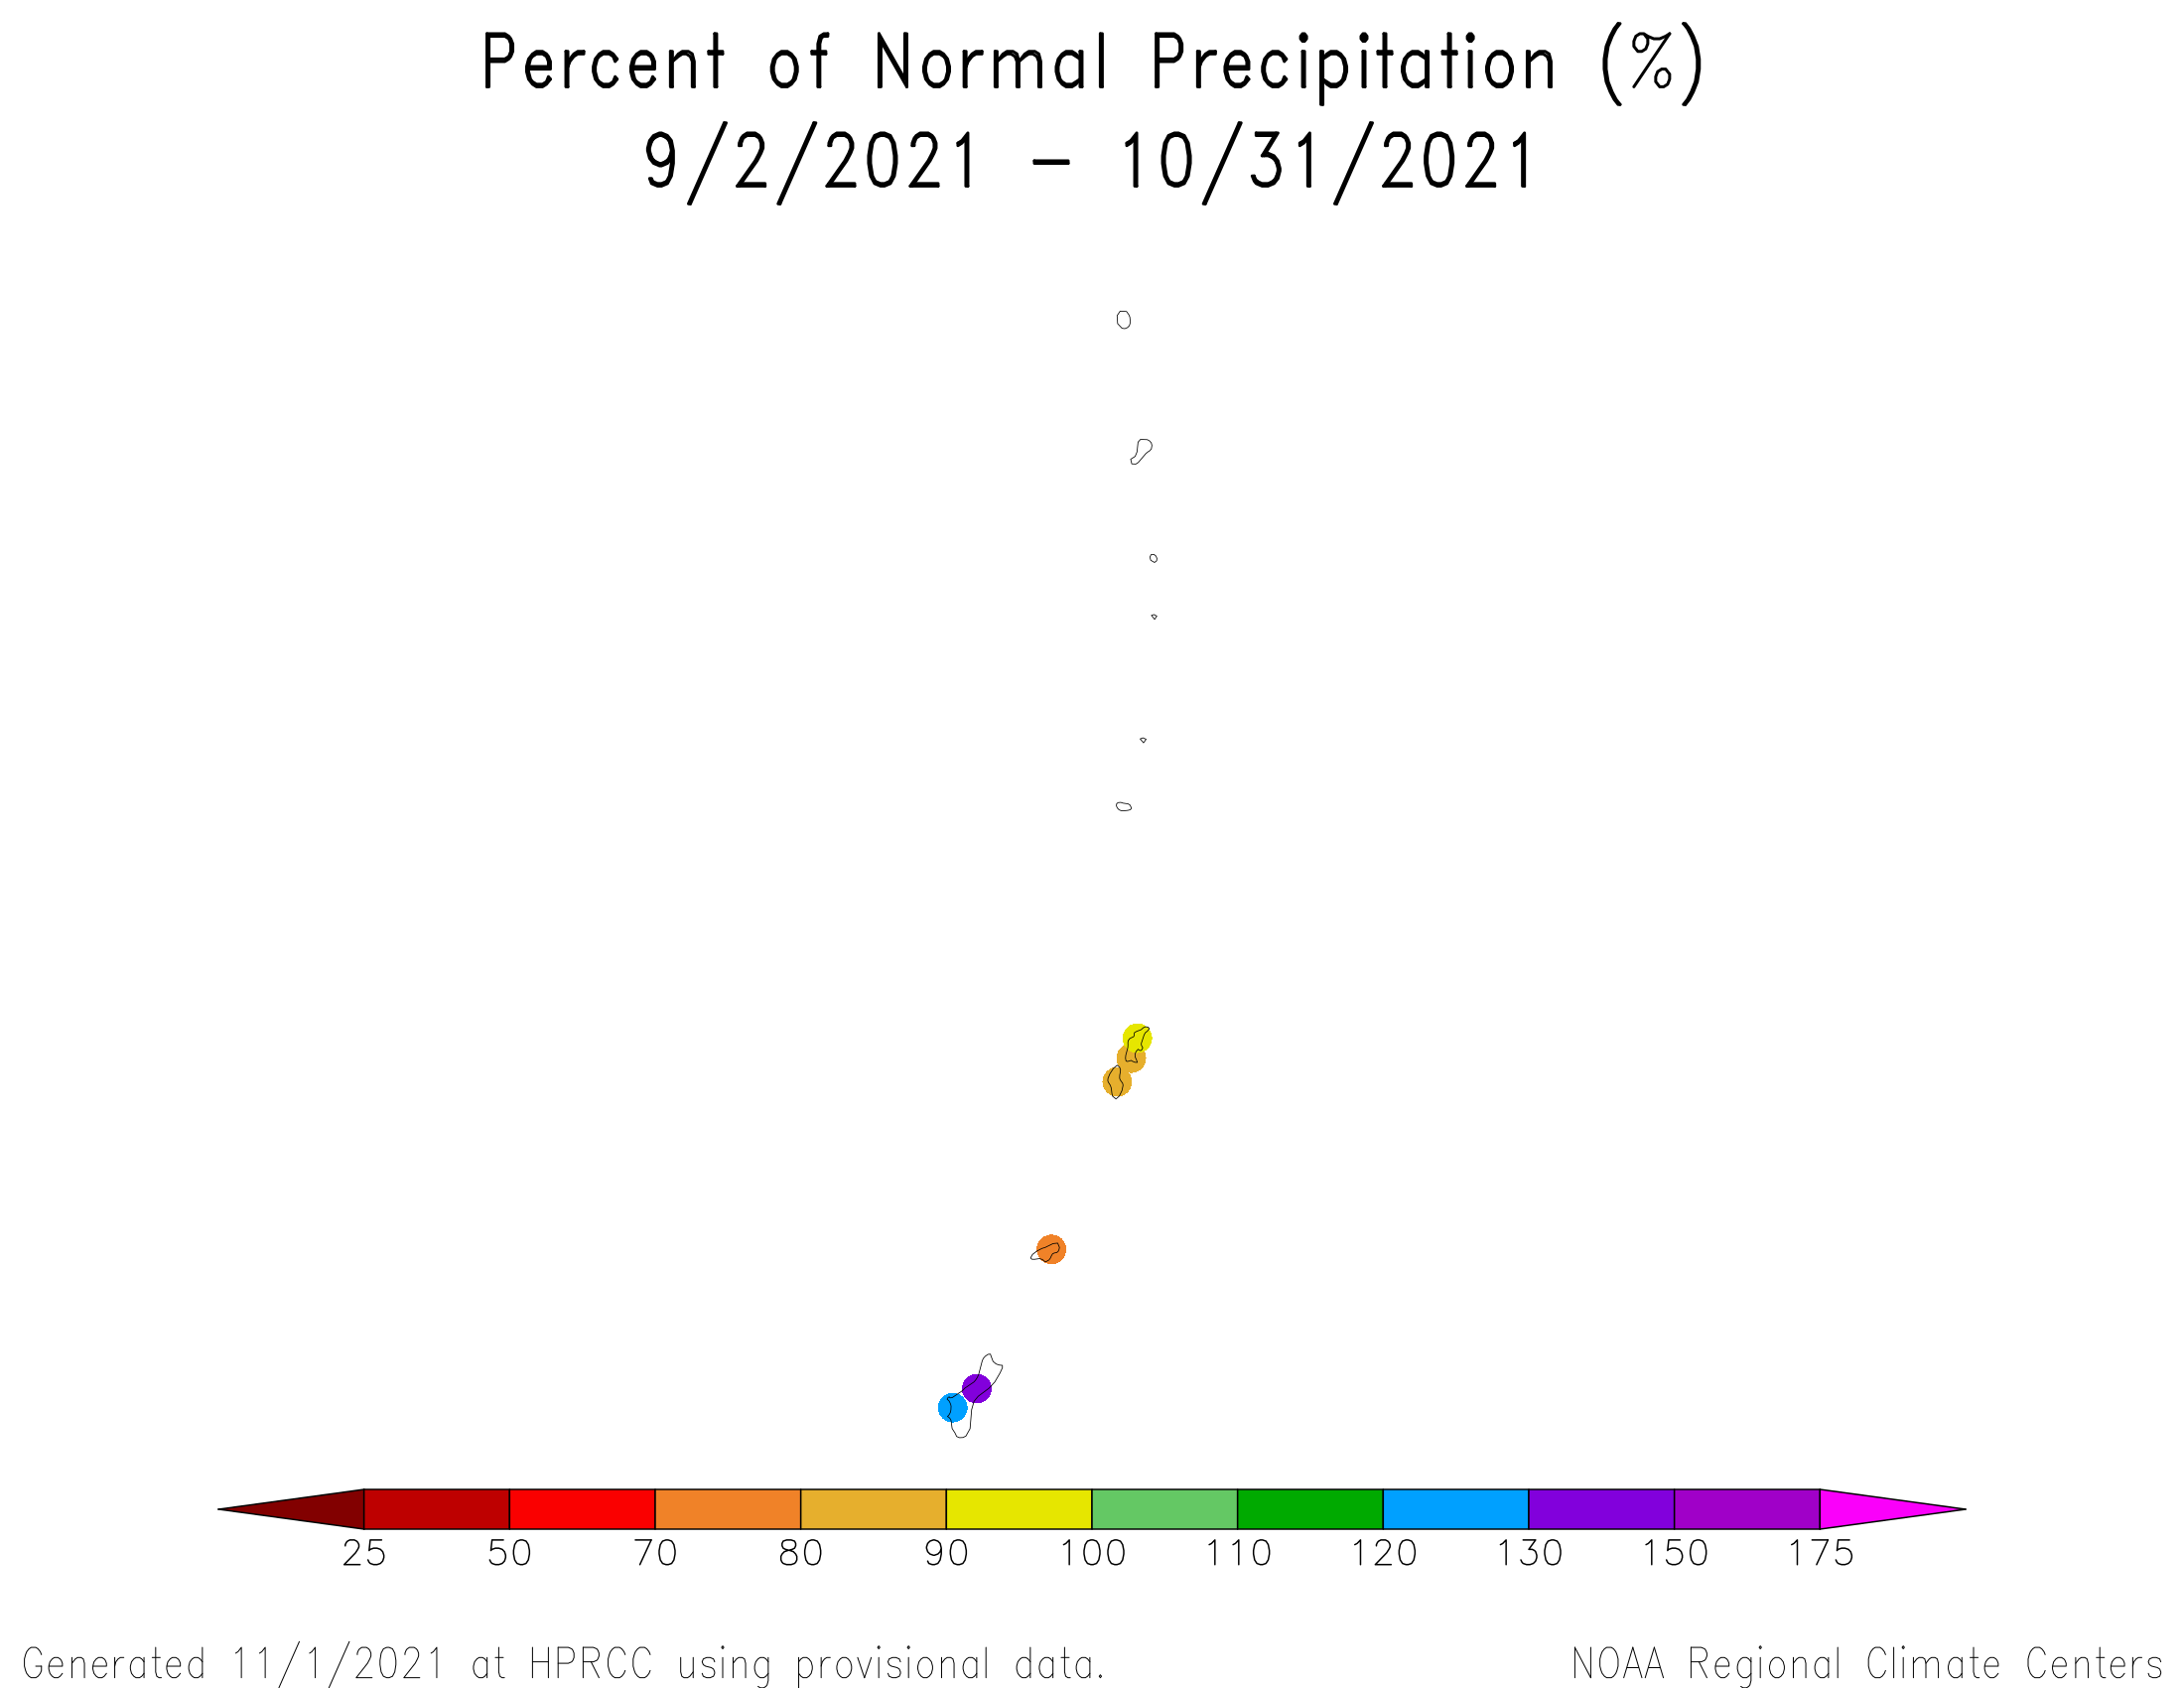
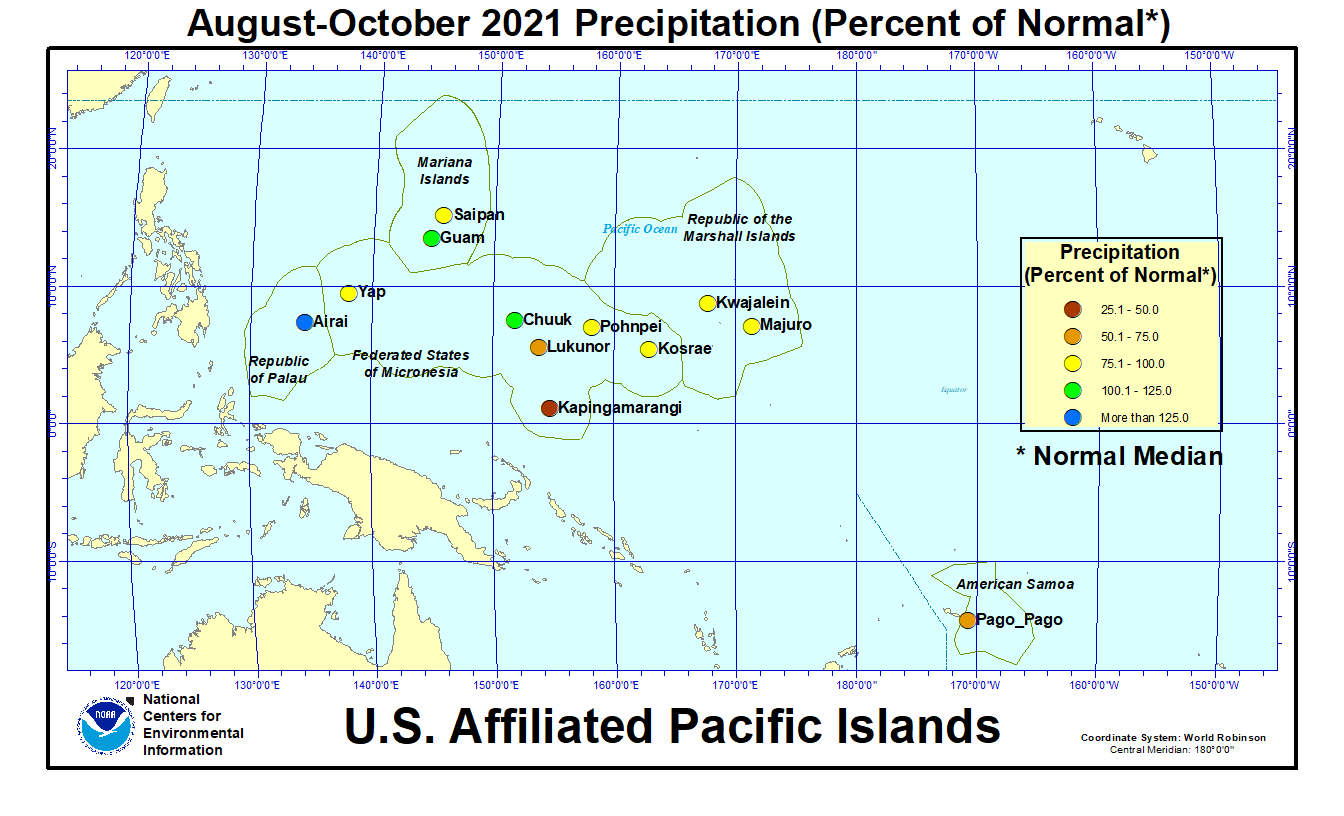
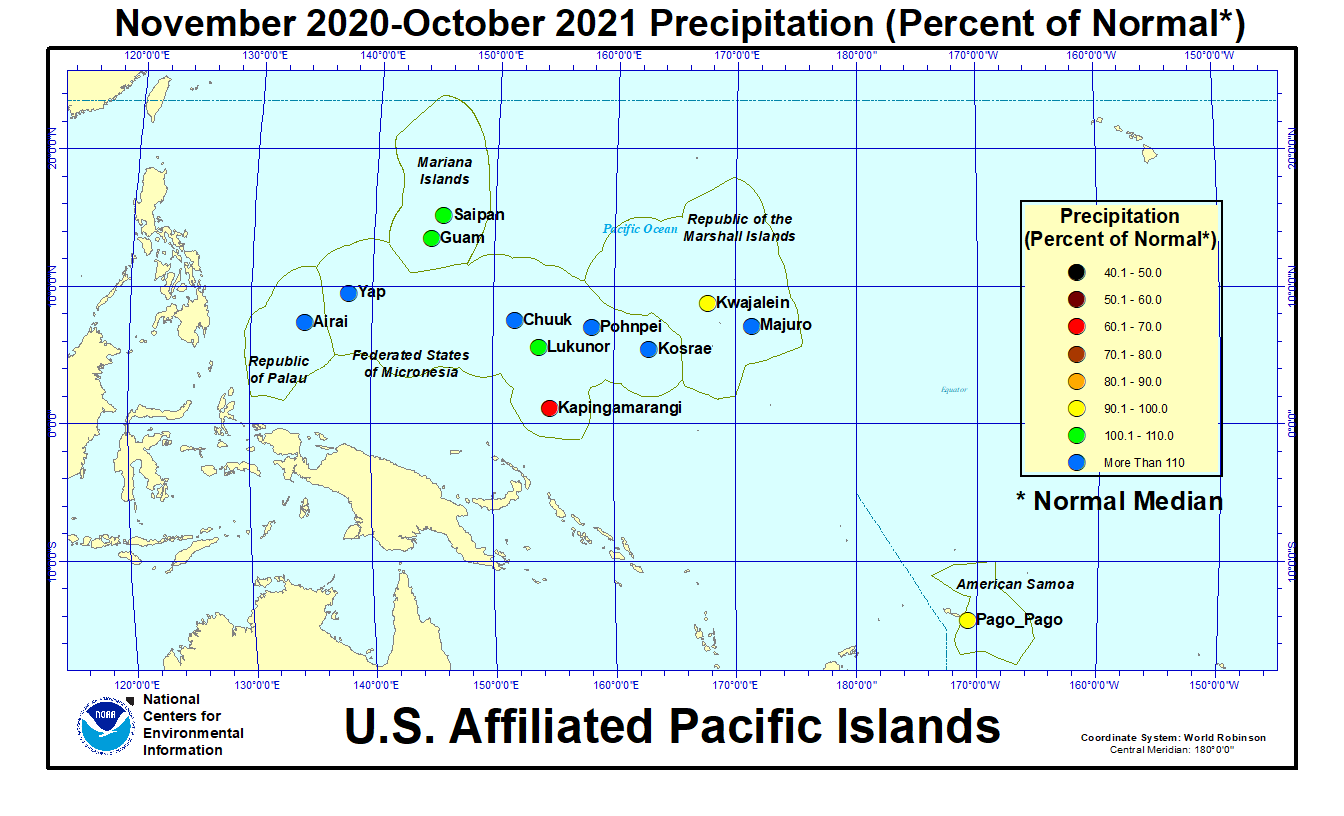
As measured by percent of normal precipitation, Kapingamarangi, Kwajalein, and Pago Pago were drier than normal in the short term (October and the last 3 months [August-October 2021]) and long term (year to date [January-October 2021] and last 12 months [November 2020-October 2021]). Lukunor was drier than normal in the short-term and for the year to date, but near to wetter than normal for the last 12 months. Pohnpei was drier than normal in the short-term and wetter than normal in the long term. Saipan was drier than normal at the 3- and 10-month time scales, but near normal for October and the last 12 months. Kosrae and Yap were drier than normal at the 3-month time scale, but wetter than normal at the other three time scales. Palau (Airai), Chuuk, Guam, and Majuro were near to wetter than normal for all 4 time periods.

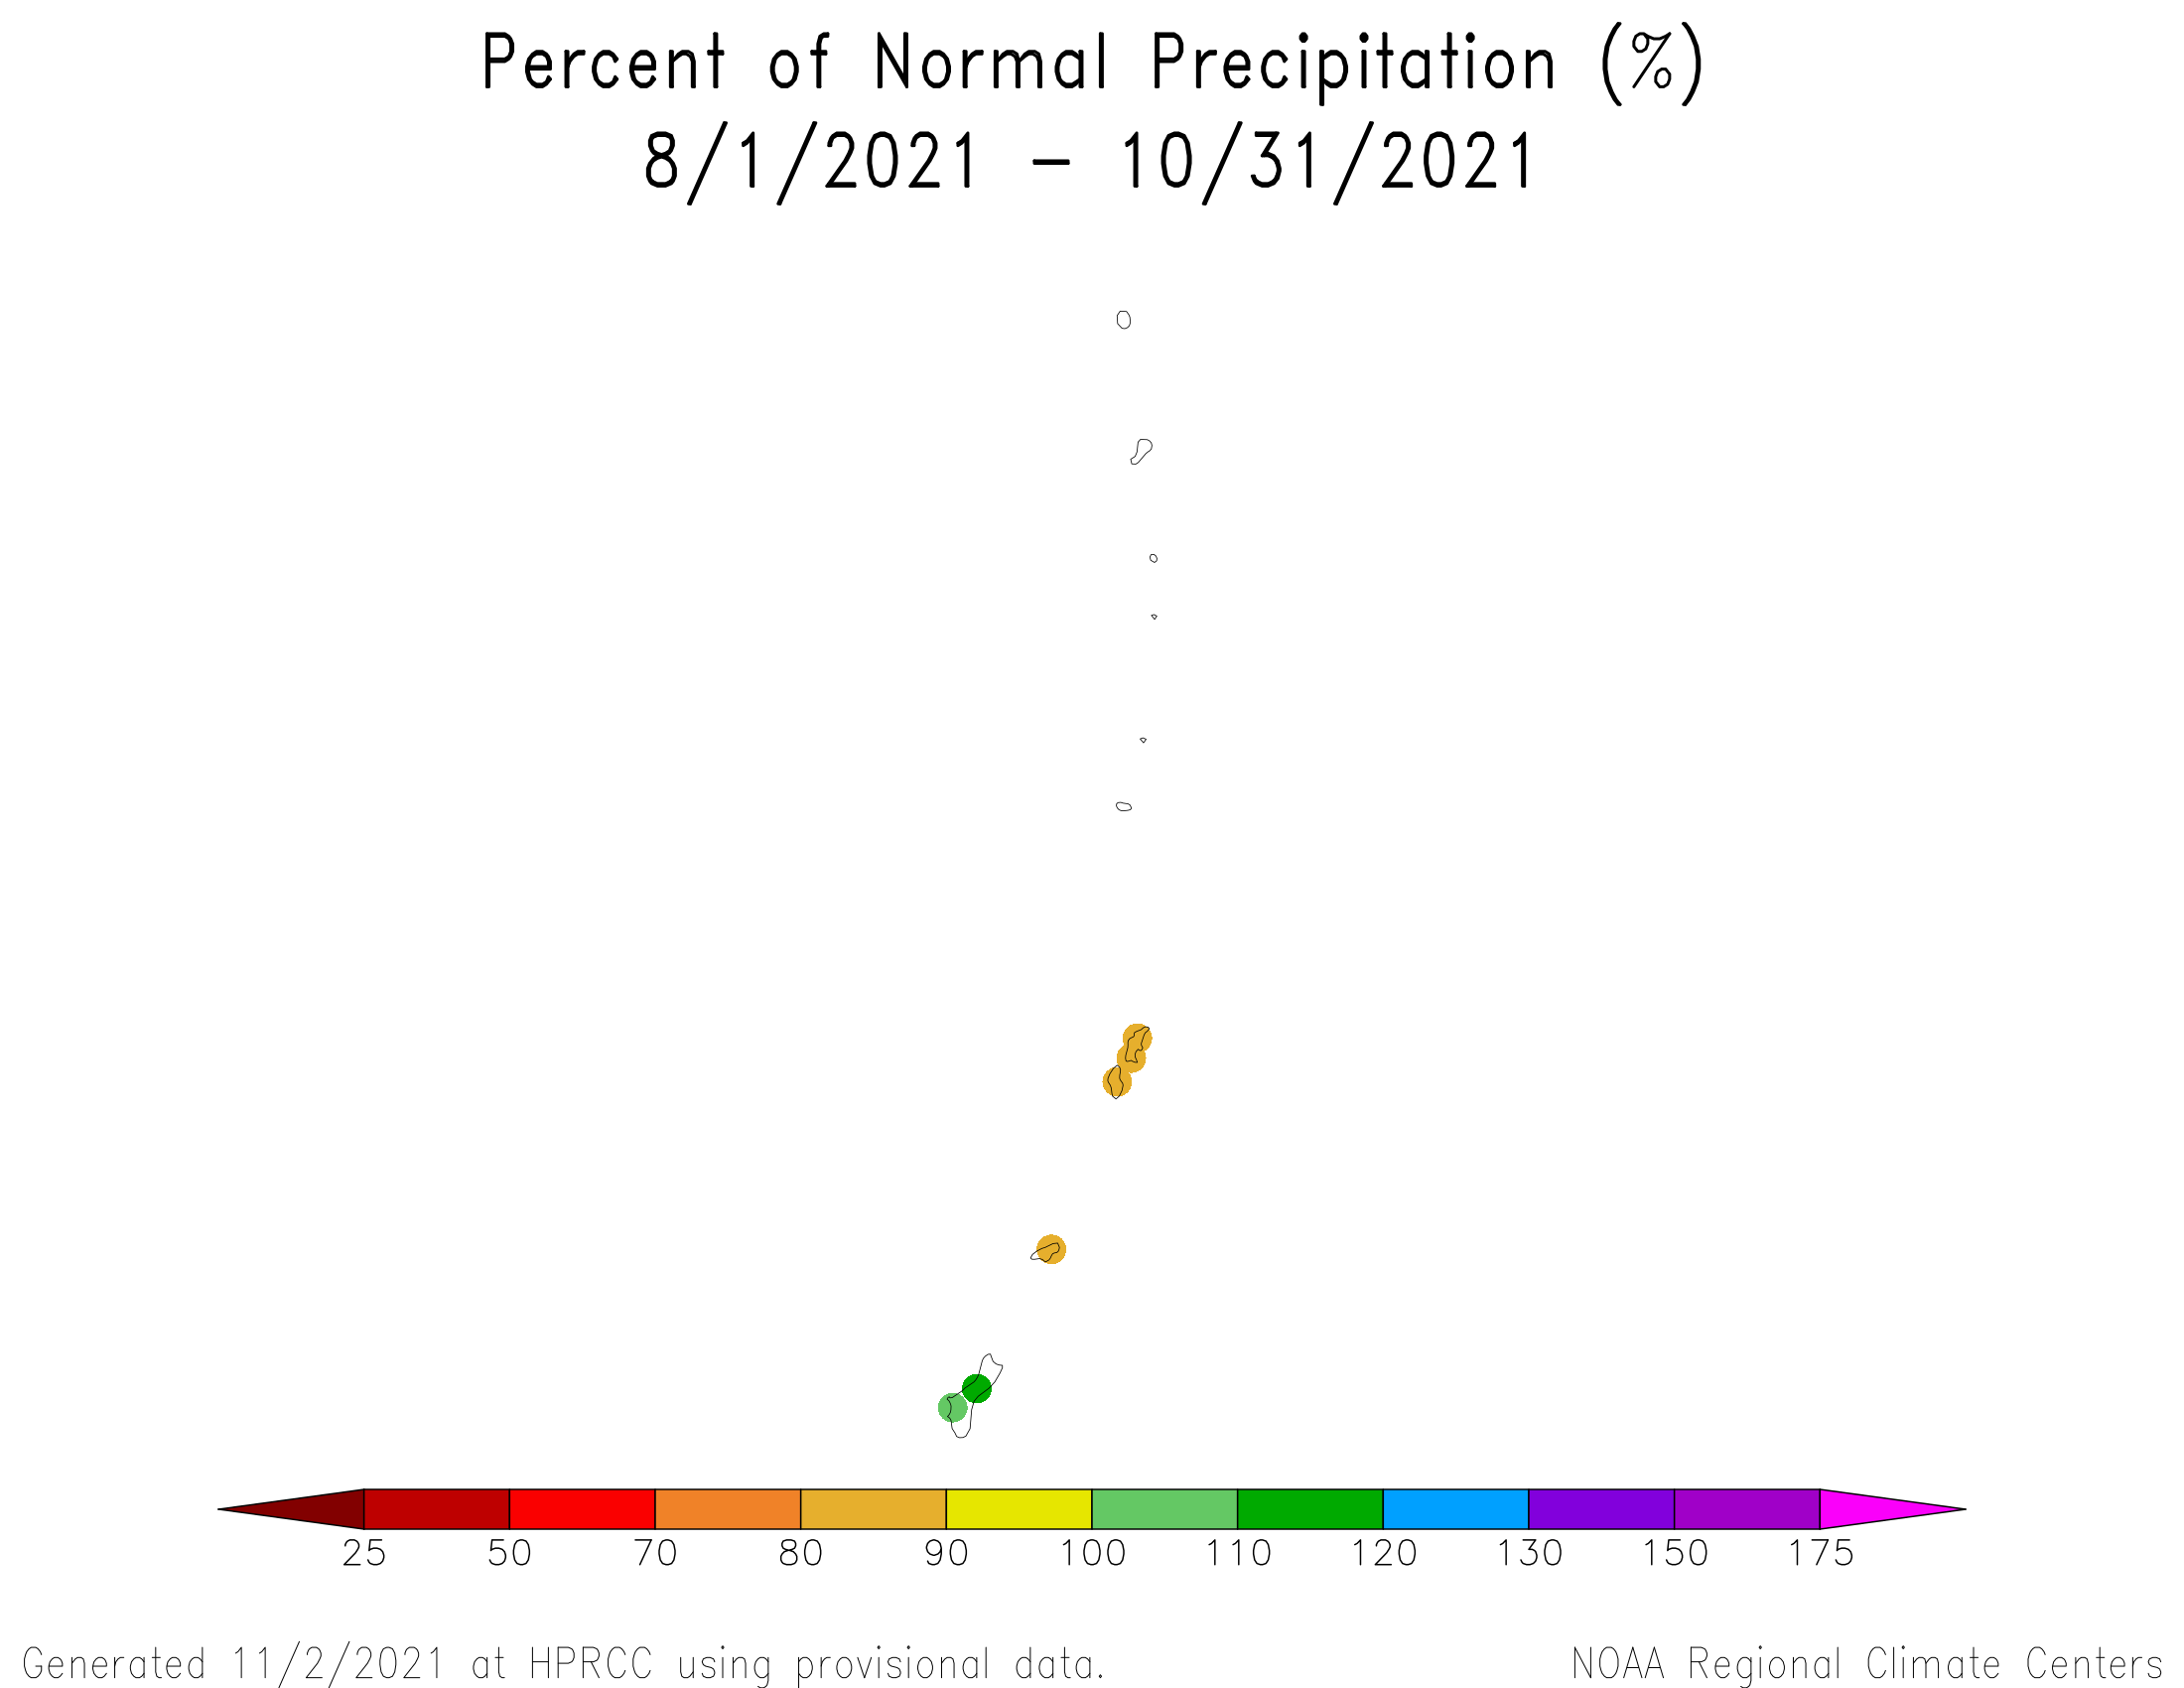
Based on percent of normal average (instead of normal median values), in the Marianas Islands, precipitation during October was mostly above normal across the islands. A drier-than-normal pattern dominated across Rota and Saipan for the last 2 to 12 months. The HPRCC maps at longer time scales were not available this month (percent of normal precipitation maps for the last 1, 2, 3, 4, 6, 7, 9, 10, 12 months).
HPRCC percent of normal average precipitation maps for the Marshall Islands were not available this month.
According to the October 31st USDM produced for the USAPI, moderate drought worsened to severe drought in the southern FSM at Kapingamarangi, and abnormal dryness developed at Jaluit (RMI) and Nukuoro (FSM) but disappeared from Ailinglaplap (RMI). The rest of the USAPI stations were free of drought and abnormal dryness. The National Weather Service (NWS) office in Guam issued one Drought Information Statement (DGT) for drought in October (on October 29) discussing the conditions in the USAPI. The redevelopment of La Niña has produced very dry conditions for Kapingamarangi in Pohnpei state. Reports received by the NWS indicate that private water tanks were around 20% capacity, and crops and vegetation have started to brown. Residents have been conserving water for several weeks. These water conservation efforts have maintained public water tank levels near full capacity. Storage in the Majuro reservoir fluctuated up and down throughout the month, reaching a maximum of 33.1 million gallons on the 7th and a minimum of 25.8 million gallons on the 21st, and ending the month at 30.8 million gallons, which is above the 28.8 million gallon threshold for concern.
October 2021 precipitation ranks ranged from driest to westtest, but were mid-range at many stations. Dry conditions during previous months resulted in low ranks for some time periods for some stations:
- Nukuoro: October 2021 was the driest October in the 39-year record, with August-October fifth driest.
- Lukunor: sixth driest October (in 37 years of data) and second driest August-October, but driest July-October and June-October.
- Kapingamarangi: seventh driest October (32 years) and September-October, and fifth driest August-October, July-October, January-October, December-October, and November-October.
- Pago Pago: seventh driest October (56 years) and fifth driest September-October.
- Pingelap: eighth driest October (38 years) and September-October, but third driest August-October.
- Ailinglaplap: ninth driest October (38 years), but May-October was driest on record, June-October second driest, and July-October and April-October third driest.
- Jaluit: October 2021 was the ninth driest October in the 38-year record, but July-October ranked third driest, June-October fourth driest, and several other time scales ranked seventh driest including the last 12 months (November-October).
- Kwajalein: 32nd driest October out of 70 years of data, but fifth driest June-October and sixth driest July-October and May-October.
- Pohnpei: 28th driest October (71 years), but sixth driest August-October and seventh driest July-October; however, wet for the last 12 months with sixth wettest November-October.
At the wet end of the scale, it was the wettest October on record at Guam (65-year record) and Airai (71-year record). Airai also had the second wettest 12-month period (November-October).
The following analysis of historical data for the USAPI stations in the Global Historical Climatology Network-Daily (GHCN-D) dataset, augmented with fill-in data from the 1981-2010 Normals, helps put the current data into historical perspective by computing ranks based on the period of record. The table below lists the precipitation ranks for October 2021, May-October 2021 (last 6 months), and November 2020-October 2021 (the last 12 months). Some stations have a long period of record and their dataset is fairly complete, while other stations have a shorter period of record and the dataset has some missing data.
| Station | October 2021 | May-Oct 2021 | Nov 2020-Oct 2021 | Period of Record | |||
|---|---|---|---|---|---|---|---|
| Rank | Years | Rank | Years | Rank | Years | ||
| Ailinglaplap | 9 | 38 | 1 | 37 | 23 | 35 | 1981-2021 |
| Airai | 71 | 71 | 65 | 69 | 68 | 69 | 1951-2021 |
| Chuuk | 56 | 71 | 58 | 70 | 67 | 70 | 1951-2021 |
| Fananu | -- | 7 | -- | 3 | -- | 2 | 2003-2021 |
| Guam | 65 | 65 | 49 | 65 | 41 | 64 | 1957-2021 |
| Jaluit | 9 | 38 | 6 | 37 | 7 | 35 | 1981-2021 |
| Kapingamarangi | 7 | 32 | 7 | 21 | 5 | 20 | 1962-2021 |
| Kosrae | 35 | 53 | 38 | 42 | 31 | 35 | 1954-2021 |
| Kwajalein | 32 | 70 | 6 | 70 | 18 | 69 | 1952-2021 |
| Lukonor | 6 | 37 | 11 | 25 | 19 | 25 | 1981-2021 |
| Majuro | 43 | 68 | 58 | 67 | 61 | 67 | 1954-2021 |
| Mili | 32 | 38 | 36 | 36 | -- | 33 | 1981-2021 |
| Nukuoro | 1 | 39 | 26 | 37 | 24 | 36 | 1981-2021 |
| Pago Pago | 7 | 56 | 15 | 56 | 24 | 55 | 1966-2021 |
| Pingelap | 8 | 38 | 24 | 36 | 28 | 33 | 1981-2021 |
| Pohnpei | 28 | 71 | 46 | 70 | 65 | 70 | 1951-2021 |
| Saipan | 20 | 41 | 21 | 41 | 19 | 32 | 1981-2021 |
| Ulithi | 20 | 38 | -- | 36 | -- | 32 | 1981-2021 |
| Utirik | -- | 18 | -- | 6 | -- | 2 | 1985-2020 |
| Woleai | 32 | 37 | 26 | 28 | 26 | 27 | 1968-2021 |
| Wotje | 13 | 38 | 8 | 37 | 14 | 34 | 1981-2021 |
| Yap | 39 | 71 | 16 | 70 | 66 | 70 | 1951-2021 |
NOAA Regional Climate Centers
More information, provided by the NOAA Regional Climate Centers and others, can be found below.
Southeast
As noted by the Southeast Regional Climate Center, temperatures were above average across much of the Southeast region and Puerto Rico for the month of October, and precipitation varied across the region with a few wet and dry extremes recorded. The driest locations were found across much of North Carolina, South Carolina, eastern Florida, and Puerto Rico. Monthly precipitation totals ranged from 70 to less than 25 percent of normal across these locations.
Drought intensified slightly across North Carolina, and abnormally dry conditions (D0) increased in coverage across portions of South Carolina, Georgia and Florida in October. At the beginning of the month, pockets of abnormally dry conditions (D0) were found in Virginia, North Carolina and South Carolina. By the end of the month, these pockets of dryness (D0) expanded, with a small area of moderate drought (D1) developing in eastern North Carolina. Drought conditions improved across Puerto Rico, with a small pocket of moderate drought (D1) in the south-western part of the island and pockets of abnormally dry conditions (D0) elsewhere by the end of the month. Abnormally dry conditions (D0) developed in the citrus growing region of Florida by the end of the month, forcing farmers to irrigate in several areas. The drier conditions in South Carolina helped many farmers complete cotton and peanut harvesting.
South
As explained by the Southern Regional Climate Center, October 2021 was a very warm month throughout the Southern region, ranking 5th warmest in 127 years of records with an average temperature of 68.8 F (20.4 C), and the monthly rainfall across the region tended to be on the wet side. The only state below the historical median was Louisiana, 49th driest at 2.50 inches (64 mm). About a dozen stations in western Texas failed to record measurable precipitation.
From September 28 to November 2, the portion of the six-state Southern region in drought expanded from nearly 14% to nearly 23%. The largest drought expansion was in Texas, which went from 7% in drought to 33% in drought. The neighboring state of Oklahoma saw drought extent shrink dramatically, from 73% to 37%. There were modest expansions of drought in Arkansas and Louisiana as well. The largest worsening of conditions was in the four-state region surrounding Texarkana and in west-central and southwestern Texas, with primary concerns associated with wildfire risk and establishment of cool-season forage.
Midwest
As described by the Midwest Regional Climate Center, temperatures across the Midwest were unseasonably warm for October, and precipitation was wetter than normal. The region averaged 57.1 degrees F (13.9 C), which was 5.7 degrees F (3.1 C) above normal and ranked as the fourth warmest October on record dating back to 1895. All states were warmer than normal. Regionwide, the average precipitation was 4.72 inches (120 mm), which was 1.62 inches (41 mm) above normal and ranked as the 6th wettest October on record. Precipitation amounts across the Midwest varied from 3-10 inches (76-254 mm), except for a dry area centered around central Wisconsin where monthly precipitation ranged from 1-3 inches. All states had above-normal precipitation except Wisconsin, which was 0.88 inch (22 mm) below normal.
Drought conditions affected about 19 percent of the Midwest by late October, with about 17 percent of the region flagged as abnormally dry according to the USDM. Although drought persisted, conditions did improve throughout the month in Minnesota, Iowa, and Illinois. Wisconsin and the Upper Peninsula of Michigan saw the greatest expansion and intensification of drought in the Midwest. About 94 percent of Wisconsin was abnormally dry or in drought compared to 38 percent 3 months ago. In response to long-term dryness and drought, most US Geological Survey (USGS) streamflow gauges in Minnesota, Wisconsin, and the Upper Peninsula of Michigan had river flows in the 0-24th percentile by late October.
Northeast
As explained by the Northeast Regional Climate Center, October 2021 was the warmest October since 1895 for the Northeast. The Northeast received 4.14 inches (105.16 mm) of precipitation in October, which was 98 percent of normal. Seven of the 12 Northeast states were drier than normal in October. State precipitation ranged from 38 percent of normal in Maine, the state's 14th driest October on record, to 145 percent of normal in New York, the state's 10th wettest October on record.
The USDM released on October 7 showed 1 percent of the Northeast in severe drought, 2 percent in moderate drought, and 7 percent as abnormally dry. There were minimal changes during October, with drought persisting in parts of northern New England and the slight expansion of abnormal dryness in portions of northern New England, northern New York, and West Virginia. The USDM released on October 28 showed 1 percent of the Northeast in severe drought, 2 percent in moderate drought, and 10 percent as abnormally dry. Below-normal or lower streamflow and/or groundwater levels persisted in parts of northern New York and northern New England, particularly Maine, during the month. As of late October, the number of dry wells reported in Maine was 20. Drought stress caused some pine trees in Maine to drop more needles than usual.
High Plains
As summarized by the High Plains Regional Climate Center, temperatures for October remained above normal for most of the High Plains region while October precipitation varied across the region. Above-normal precipitation was observed across Wyoming and stretched into the Dakotas. While drought was still present in the High Plains region, the above-normal precipitation and snow did help to provide minor improvement across Wyoming, the Dakotas, and areas in Colorado. Despite the wetness in the northern and eastern parts of the High Plains region, dryness was present in a large portion of the region. Eastern Colorado and the western parts of Kansas and Nebraska experienced below-normal precipitation for the month, with large swathes of 50 percent or below-normal precipitation. Denver, CO recorded the 8th driest October, with only 0.08 inch (2 mm) of precipitation. The dryness within this area has impacted agriculture. According to the USDA's Weekly Weather and Crop Bulletin, pasture and rangelands that were rated as poor to very poor conditions were covering above 25 percent of the area for Colorado, Kansas, and Nebraska. Corn harvest was also ahead of the 5-year average for all states in the High Plains.
Beneficial precipitation across drought-stricken areas of the High Plains region led to improvements in drought and abnormally dry (D0-D4) conditions. The most notable improvements included a reduction of 12 percent in extreme and exceptional (D3-D4) conditions. Despite the improvements this month, 83 percent of the region was still experiencing D0-D4 conditions. Conditions improved significantly in North Dakota after much of the state experienced above-normal precipitation during October. D3-D4 conditions were reduced 50 percent during the month, with only 9 percent of the state currently under the most severe drought conditions. In South Dakota, similar improvements occurred. D3-D4 categories were removed for the state while severe to exceptional (D2-D4) drought was reduced by 27 percent. Wyoming also experienced a 16 percent decrease to D3-D4 conditions. Despite the improvements this month, Colorado saw an increase of 21 percent to drought conditions (D1-D4). Throughout the rest of the region, other minor improvements were observed. According to the U.S. Monthly Drought Outlook for November, drought development is likely in southern Colorado and western Kansas.
West
As described by the Western Regional Climate Center, a series of atmospheric rivers began impacting the West coast and Great Basin around mid-month with the strongest one occurring October 24-26. The footprint of the strong, inland penetrating atmospheric river that occurred during the end of the month is evident in northern California and the Great Basin with a large area of greater than 200% of normal precipitation. The storm track did not extend to southern tier of the West with part of southern California, Arizona, and New Mexico receiving less than 25% of normal precipitation for the month. Central Montana also saw below-normal precipitation. With broad areas of low pressure dominating the West for much of the month, temperatures were below normal throughout the region.
Long-term drought remains entrenched in the West. Parts of every western state were in drought at the end of the month with 91% of the region in at least moderate drought (D1) according to the USDM. While the strong atmospheric river that impacted the West Coast was beneficial for short-term drought relief, the single event was not nearly enough to erase the long-term drought conditions that developed over the course of two or more years. Flooding, landslides, downed trees, and power outages were observed throughout the region experiencing the strong atmospheric river event, but despite more than 15 in (381 mm) of precipitation for some areas, major reservoir storage in the region was still below normal due to dry conditions over the past two years. Lake Oroville, California's second largest reservoir, gained over 150,000 acre-feet of storage in just three days bringing the reservoir up to 54% of average (28% of capacity) by the end of the month. Folsom Lake, south of Oroville on the west slope of the Sierra, improved to 75% of average storage by the end of the month.
In Alaska, parts of the central/northern Interior saw above-normal temperatures and much of the western part of the state saw below-normal temperatures. Parts of south-central Alaska saw well above-normal precipitation that was record-breaking in some cases.
Precipitation was well below normal across the Hawaiian Islands with the exception being the windward side of the Big Island. Honolulu saw its driest October on record with just 0.05 in (1.27 mm; 3% of normal) and Molokai logged 0.21 in (5 mm) at 14% of normal. Dryness has been persistent for months over Maui, Lani, and Molokai with severe drought (D3) present on these islands at the end of the month.